Charts of The Week: Growth Under Pressure
Nepal’s growth is set to fall to 2.3% from 4.6% after unrest and an oil shock hit simultaneously, exposing a fragile and uneven recovery.
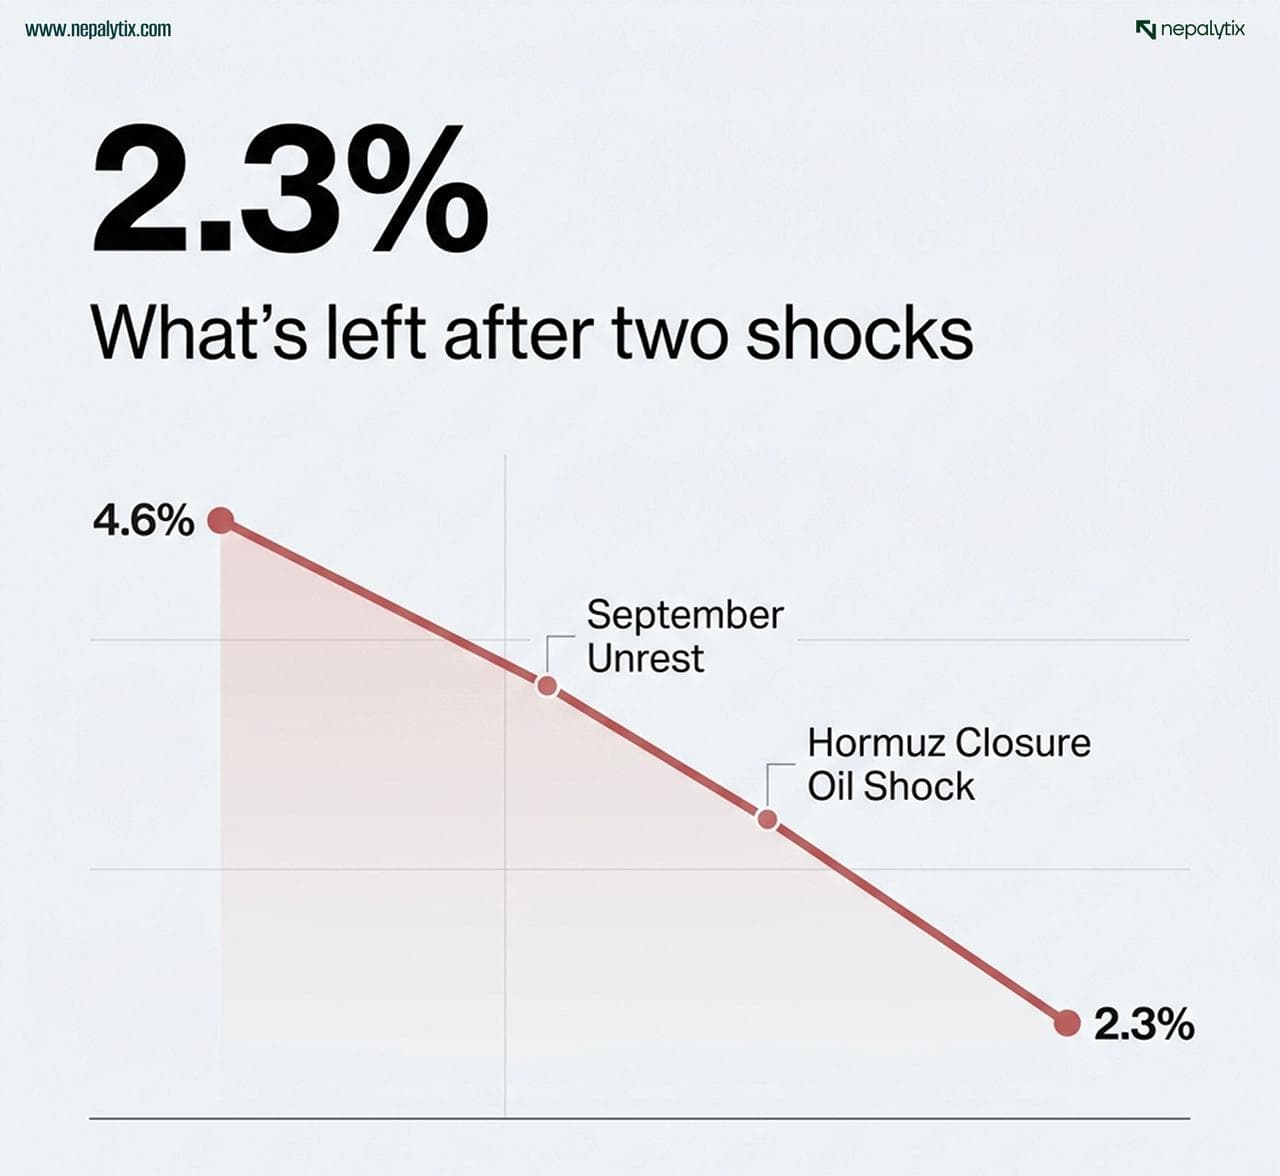
1. The World Bank just told Nepal it will grow at 2.3% this year. This is half of last year.
Nepal grew 4.6% in FY 25. It had taken three years to get there, crawling out of the COVID hole, through the 2022 credit crunch, through four governments in five years. The trajectory was not spectacular, but it was credible. Remittances surging. Hydropower coming online. A new majority government after the March elections with something Nepal had not had in a decade: a clear mandate and a full term ahead of it. For the first time in years, the consensus view was that Nepal might actually be turning a corner.
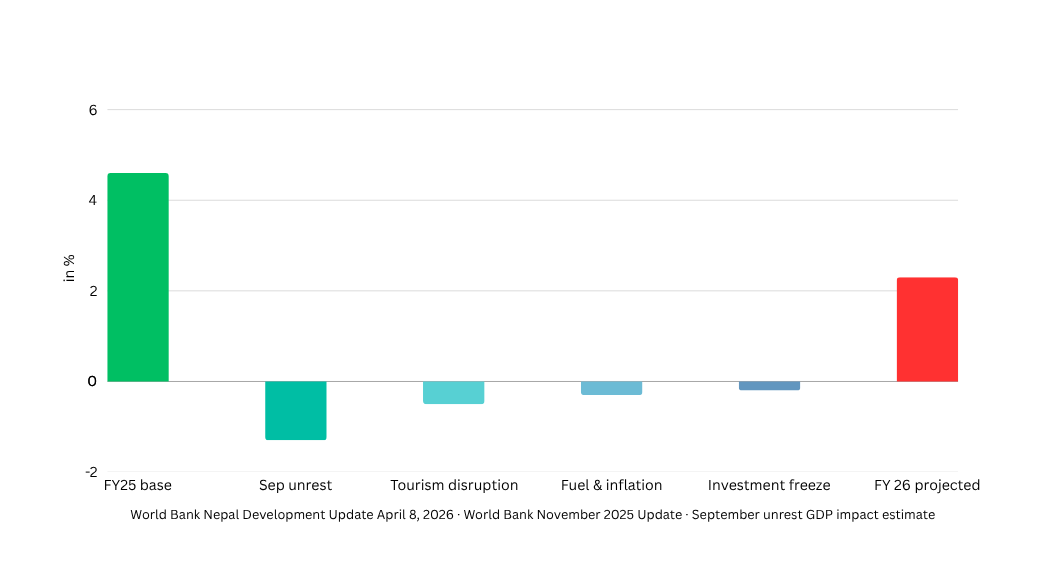
Then on April 8, the World Bank released its Nepal Development Update titled Growth Under Pressure: Navigating Domestic and Global Shocks and cut the full-year FY26 projection to 2.3%. Not a small trim. Half of last year. The steepest single-year deceleration in a decade.
Two shocks arrived before Nepal had recovered from either. First: the September 2025 unrest, which the World Bank estimates cost 1.3% of GDP in direct losses, businesses shuttered, the autumn tourism season eviscerated, and private investment frozen for months while the political situation was resolved. Second: the Strait of Hormuz closing on February 28, crude going to $115, the fuel crisis now costing Nepal Rs. 627 million every day. The World Bank is not projecting a catastrophe. It is doing arithmetic on an economy hit twice.
Nepal last grew this slowly in FY23, still absorbing post-COVID damage. This time, the cause is two simultaneous shocks. The projected recovery to 4.4% in FY27–28 assumes the conflict resolves, and reconstruction is actually implemented; both are uncertain
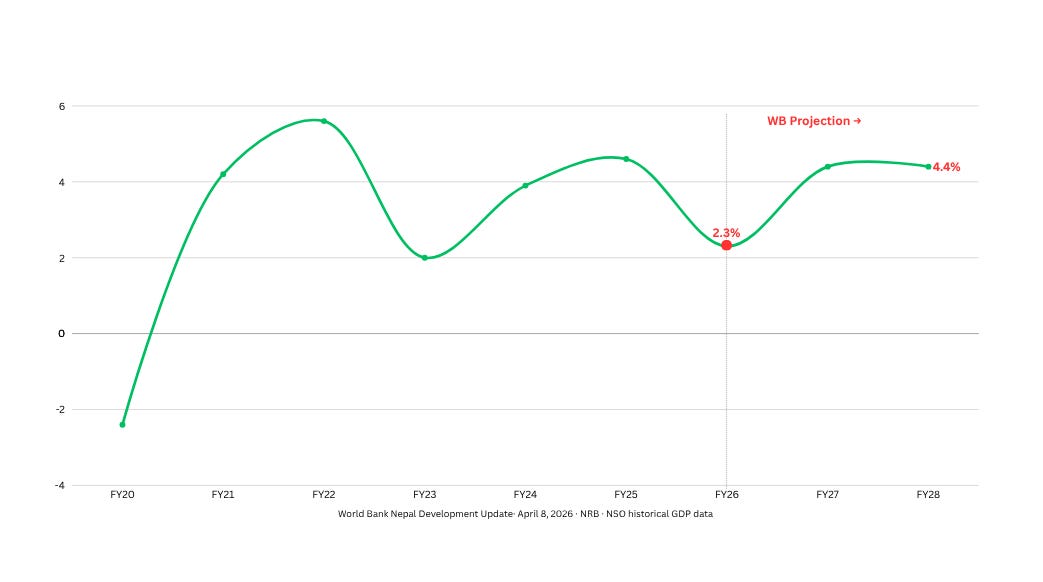
The recovery the World Bank projects for FY26, 4.4% average in FY27–28, rests on three things: reconstruction spending from the September unrest actually flowing through, hydropower expansion continuing, and election-cycle consumption rising ahead of the 2027 subnational elections. All plausible. None guaranteed. But before getting to what breaks the recovery, the World Bank report does something more precise than a headline cut: it maps exactly how the Gulf conflict reaches Nepali households. There are four channels, and the most important one is not the one that gets discussed the most.
77.3% of Nepal’s migrant workers are in the Middle East. Saudi Arabia, Qatar, and the UAE together account for around 37% of total remittance inflows. When those workers lose jobs when Gulf construction slows, when businesses pull back, two things happen simultaneously at the household level: income disappears, and the cost of living is rising at the same time because fuel price hikes are flowing through to food, transport, and goods. The remittance data that came out last week looked strong. What it does not show yet is what happens when the employment that generates those remittances weakens. That data comes with a lag. The World Bank is telling you not to celebrate the 37.7% remittance growth without reading the footnote.
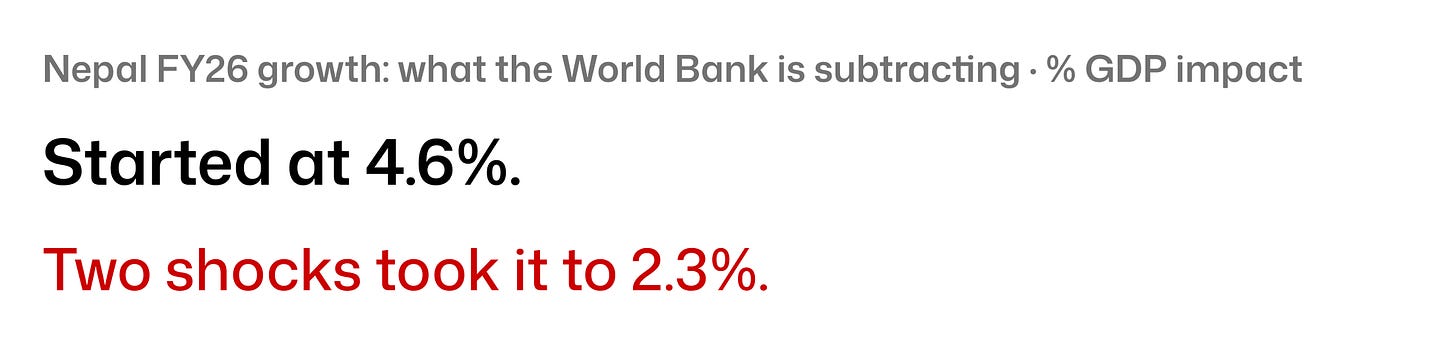
The World Bank is not guessing. It is subtracting. September unrest: −1.3% of GDP in direct losses, disrupted tourism, frozen investment. Middle East conflict: services down, fuel up, remittances at risk, aviation disrupted. What remains after both shocks is 2.3%.
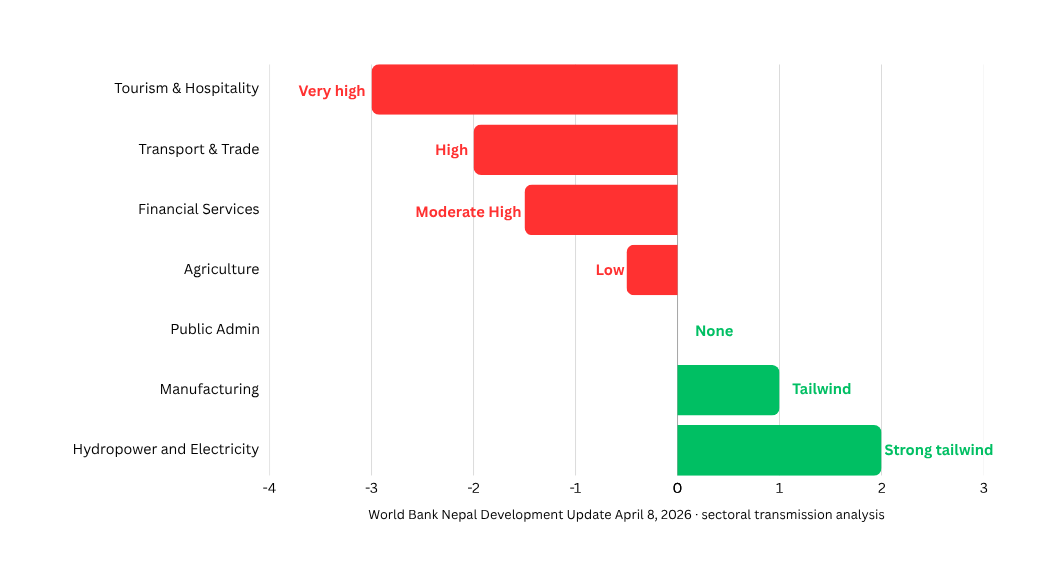
The arithmetic lands at 2.3%. What it does not show is which sectors are absorbing which hits because the damage is not distributed evenly. Services get the worst of it. Hydropower gets none of it. The divergence is stark enough to have its own visual.
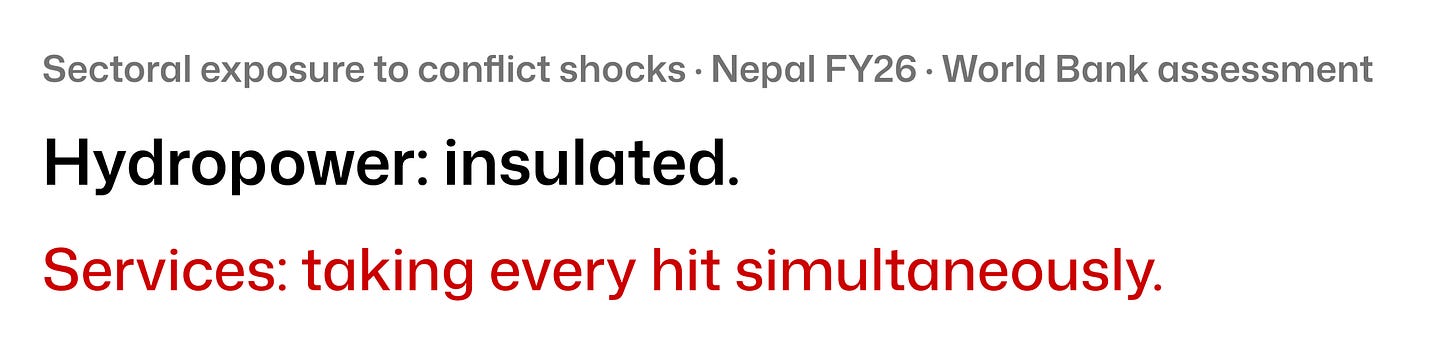
Services is Nepal's largest GDP contributor and the sector most exposed to every transmission channel, simultaneously fuel costs, aviation disruption, tourism decline in peak season, and remittance-dependent household spending drying up. Hydropower runs on water, not imported petroleum. The divergence is not accidental.
The 17,267 people the World Bank projects will be pushed into poverty by the conflict are not in hydropower. They are in tourism, transport, and the services economy, households whose income flows from a family member working in the Gulf, whose cost of living is rising simultaneously because fuel hikes flow through to food and transport, and who have no social protection to fall back on. The World Bank buries this number in the report. It should not be buried.
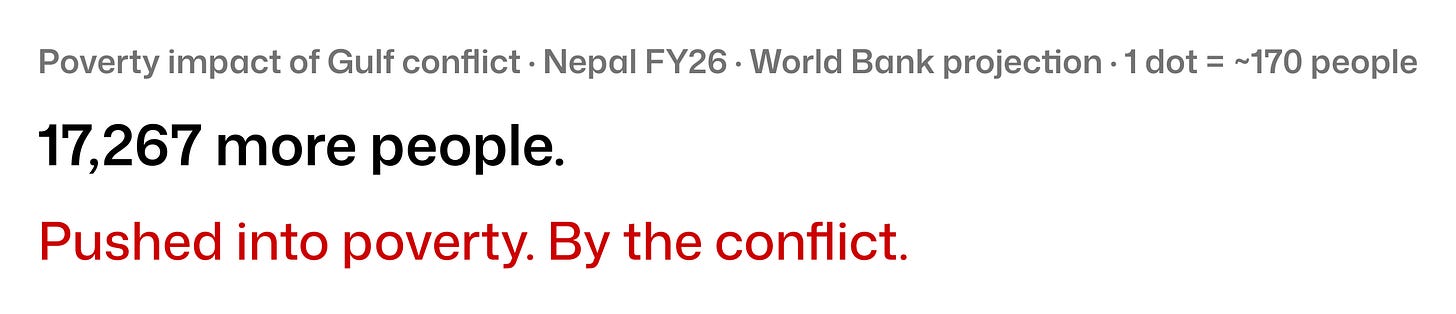
The 0.1 percentage point rise in the poverty rate sounds small. Represented as people, it is 17,267 households near the poverty line, rural, remittance-dependent, for whom a simultaneous income shock and cost-of-living increase tips the balance.

These are households in rural Nepal whose income flows almost entirely from a family member working in Saudi Arabia or the UAE. Their cost of living is rising because fuel price hikes flow through to food and transport. They have no social protection buffer. The World Bank notes: "Slower growth, higher inflation, and a sharp decline in remittances, especially in rural areas, will weigh on household incomes." This is not macroeconomics. This is whether families can afford to eat.
And Nepal is not alone in this deceleration, but it is the South Asian outlier in the severity of it.
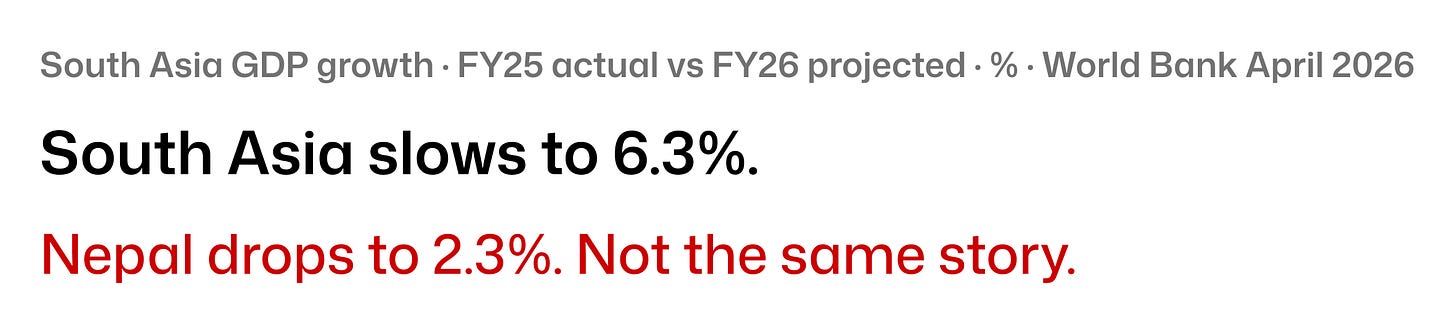
Every South Asian economy is feeling the conflict. Nepal is the only one seeing its growth rate nearly cut in half. The difference: Nepal has the highest labour migration concentration in the Gulf, the deepest dependence on a single fuel supplier, and a domestic shock (September unrest) that arrived six months before the external one.
South Asia as a region slows from 7% to 6.3%. Nepal goes from 4.6% to 2.3%. Every country in the region is absorbing the same external shocks, higher fuel prices, Gulf disruption, and aviation uncertainty. Nepal absorbs it hardest because it arrived on top of a domestic shock, because 77.3% of its migrant workers are concentrated in the conflict zone, and because its fuel supply runs entirely through one relationship with one counterparty. The comparison makes the 2.3% harder to dismiss as a normal cyclical slowdown.
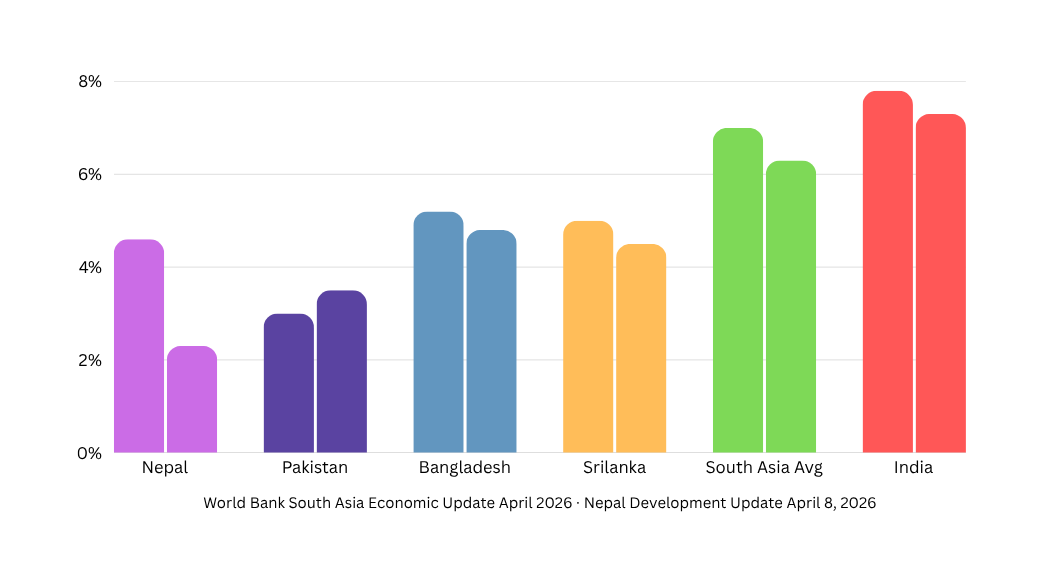
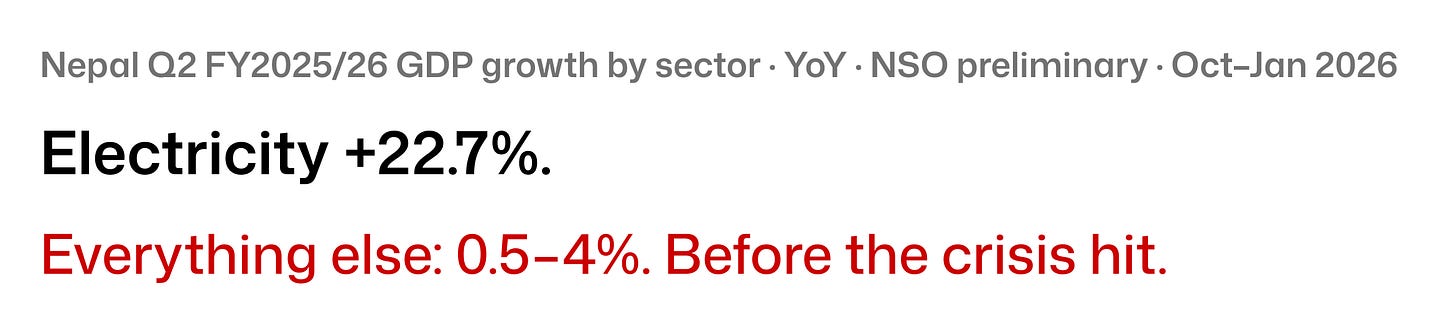
2. The NSO released Q2 data. Electricity up 22.7%. Everything physical is slowing.
The National Statistics Office released preliminary Q2 FY2025/26 estimates on April 6. Nepal grew 4.05% year-on-year in the second quarter, from October to January. Before reading anything into it, this quarter needs to be placed in time. It ended before February 28. The Strait closed after. The fuel hikes happened after. The tourism disruption is happening afterward. This is a photograph of Nepal before the second shock arrived. It is the pre-crisis baseline. And even the pre-crisis baseline reveals something worth examining: a K-shaped economy already forming before the crisis added pressure.
One number stands apart. The electricity, gas, and air conditioning sector, which essentially drives Nepal’s hydropower buildout, expressed itself in GDP data, grew 22.74% year-on-year. Real megawatts from real dams that took a decade to build. Everything else in the economy grew between 0.55% and 4.11%. When a 22.74% gain in a relatively small sector produces a 4.05% aggregate, the arithmetic means the rest of the economy was growing at roughly 2–3%. That is the pre-crisis number. Q3, which covers February through April, the entire fuel crisis, three price hikes, and the peak tourism disruption, will be worse.
This is the pre-crisis baseline. The Strait closed after this quarter ended. Every sector except electricity was already running at 2–4% growth before fuel costs surged. Q3 data, February through April, will show what those same sectors look like after three price hikes.
The electricity number is real; Nepal has been building hydropower for twenty years, and the output is finally visible in GDP data. But hydropower is not yet large enough as a share of total GDP to carry the headline number without the rest of the economy's cooperation. The split between Q1 and Q2 within this data also tells a more granular story: which sectors accelerated between Q1 and Q2, and which ones were already slowing before the second shock arrived.
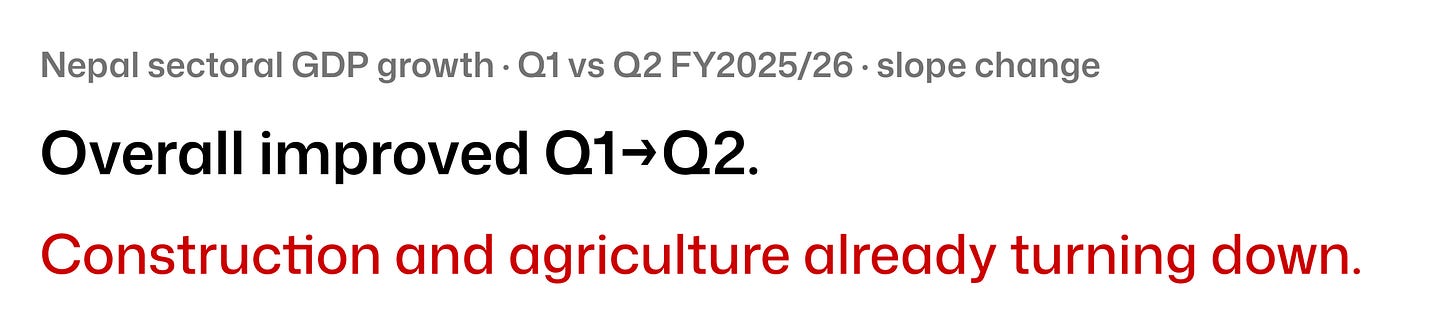
The headline went from 3.24% to 4.05%, an improvement. But inside the aggregate, construction materials imports declined, and paddy fell. The sectors that employ the most people and build the most physical things were already decelerating before the fuel crisis arrived.
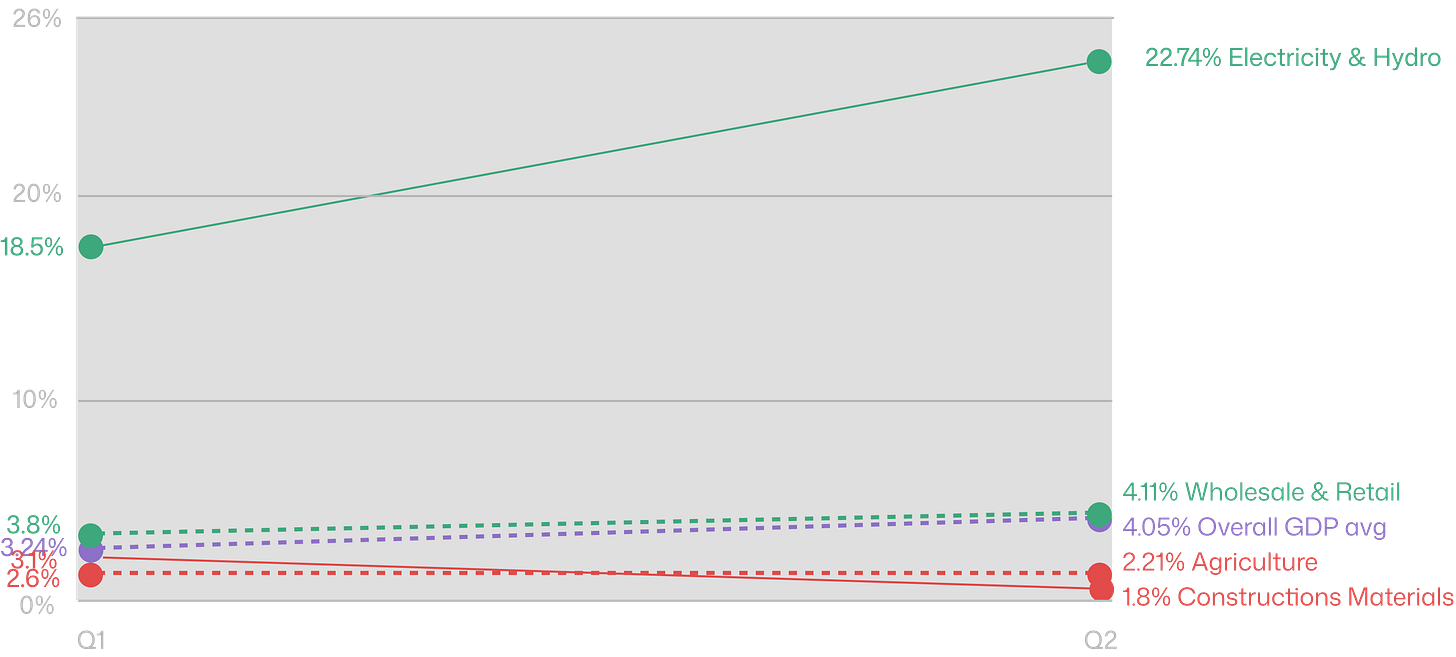
Construction was already decelerating from Q1 to Q2 before a single fuel hike. Agriculture, including paddy, was already slipping. These are the pre-crisis trends. The fuel crisis arrives on top of the deceleration that was already underway in the physical sectors. Now put the two halves of the fiscal year side by side, and the World Bank's arithmetic becomes visible.
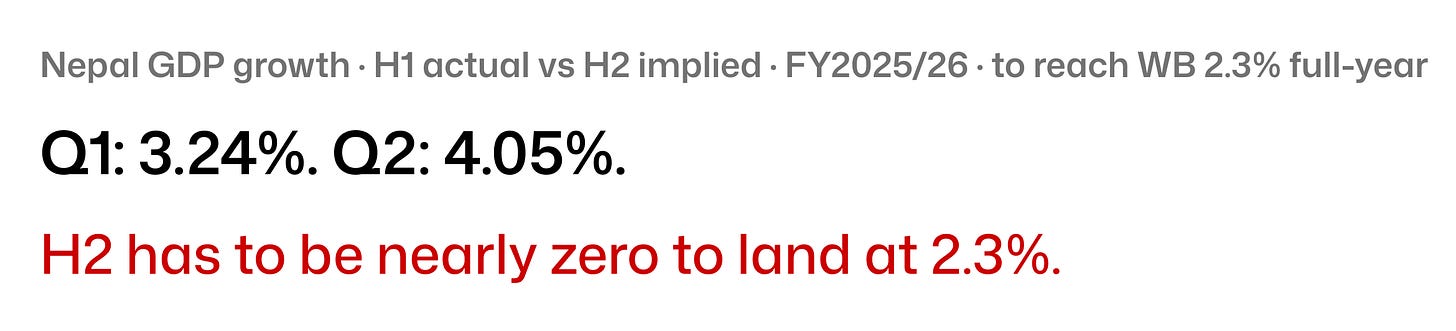
H2 covers February to July, the entire fuel crisis, three price hikes, the peak tourism disruption, and the household income squeeze. This is not pessimism. It is arithmetic. The fuel crisis, the declining construction pipeline, and a tourism season running into conflict-disrupted aviation are all priced into the second half.
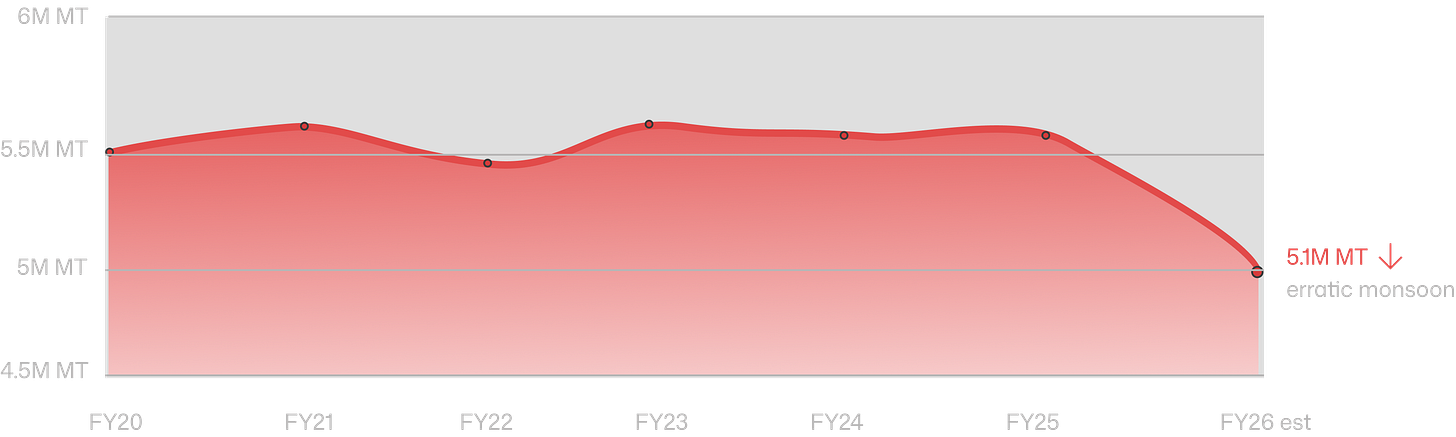
H2 implied is barely above zero. That is what the full-year projection requires, given the actual Q1 and Q2 numbers. The paddy story makes it more concrete: agriculture grew 2.21% in Q2, but paddy — the defining crop of the Terai, the thing Nepal grows most of — declined. The NSO attributes the overall agriculture figure staying positive to livestock and vegetables compensating. But Nepal is already importing Rs. 28 billion of rice a year. The domestic paddy crop declining is not a rounding error. It is one more input into a food system that is increasingly dependent on imports from India, paid for with remittances from the Gulf.

The agriculture headline stayed positive because livestock and vegetables compensated. But paddy, Nepal's defining crop, grown across the Terai, declined due to erratic monsoon and localized drought. Nepal already imports Rs. 28B of rice a year. Domestic production declining means that the import bill grows larger, paid for with remittances from the Gulf corridor that is now at war.
3. Nepal has spent 19% of its capital budget in 8 months. Debt servicing now exceeds infrastructure spending.
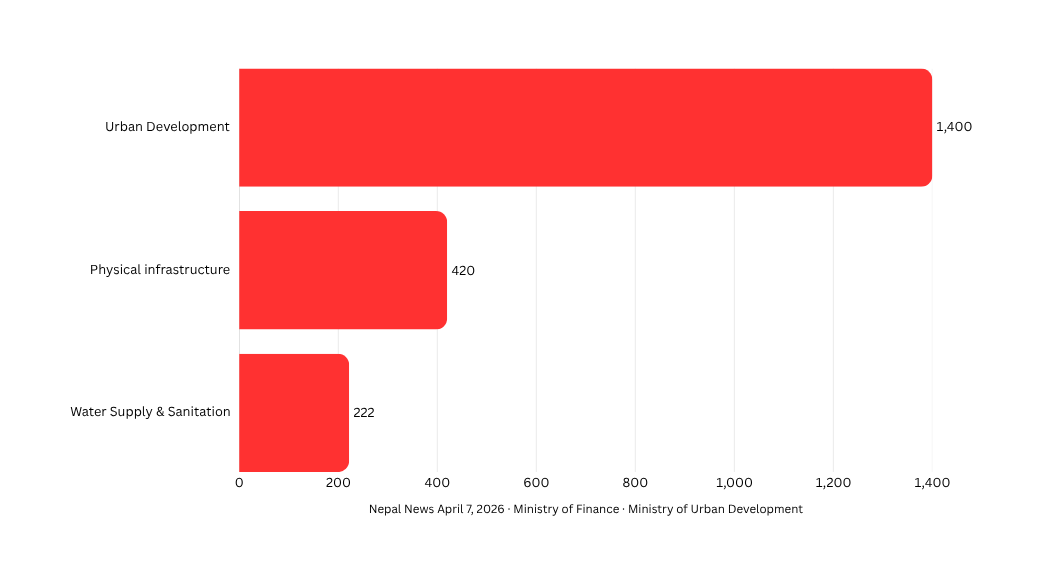
The government froze Rs. 58.168 billion from the development ministry budgets this week. Not the first freeze, Rs. 119 billion was suspended after September. Only Rs. 52.9 billion of that has been released. The Ministry of Urban Development still has 1,400 projects stalled. This week’s Rs. 58B freeze is additive to that backlog. Infrastructure projects are not just underfunded in Nepal; they are actively being paused mid-cycle while the government simultaneously tells the World Bank it plans to use reconstruction spending as the primary recovery driver for FY27.
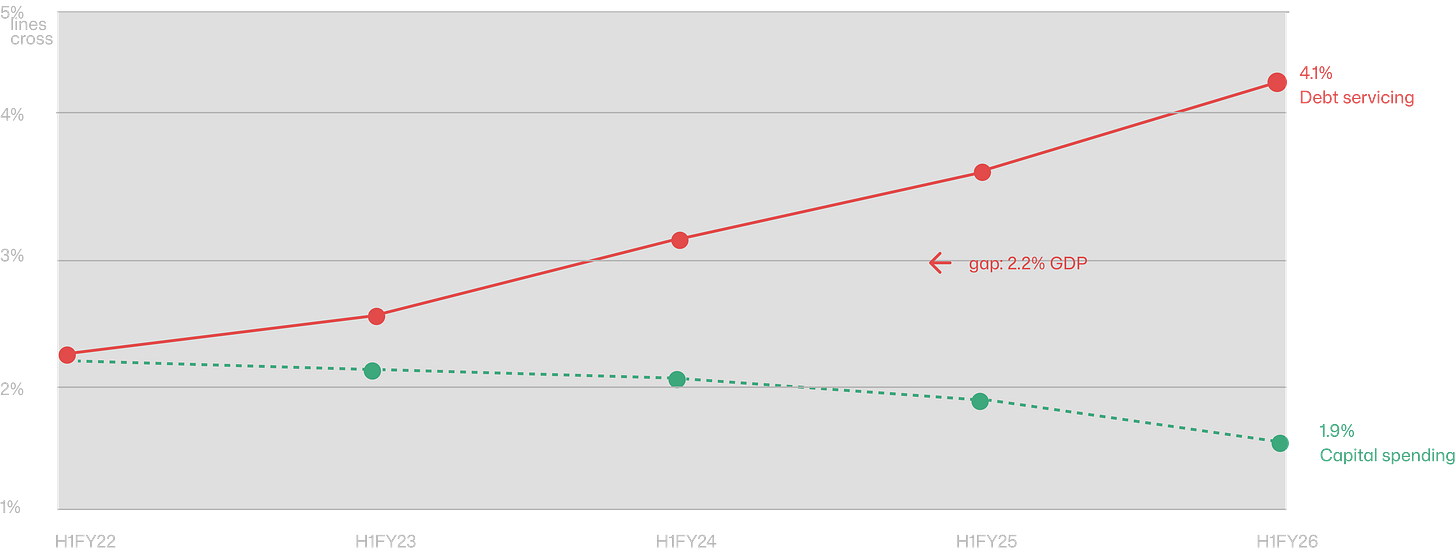
But the freeze headline almost distracts from the structural number the World Bank quantified for the first time explicitly in the April 8 report: Nepal’s debt servicing now exceeds its capital expenditure. The gap reached 2.2% of GDP in H1FY26 and has been widening every year since H1FY22. Nepal is paying more to service old borrowing than it is spending to build new things. In a country with one of the largest infrastructure deficits in South Asia, that inversion makes every other development problem harder.

Nepal borrowed to build infrastructure. The repayments have started. Capital spending has been falling every year as fiscal space tightens. September 2025 widened the gap sharply, capital spending collapsed, while debt obligations stayed fixed. The country is now paying more for past projects than it is investing in new ones.
The debt is not at crisis levels, 45.5% of GDP is manageable, and the World Bank rates Nepal at low risk of debt distress. But the repayment profile on two decades of concessional borrowing is now competing with new capital spending for the same limited fiscal space. Every rupee that goes to principal and interest on old loans does not go to building a new road. And Nepal’s response to this squeeze has been consistent: allocate ambitious capital budgets on paper, fail to execute them in practice, then borrow more to fill the gap.
The execution data makes the pattern concrete. Total capital budget this fiscal year: Rs. 407.88 billion. Spent at eight months: 19.24%.

Out of Nepal's Rs. 1.96 trillion budget, Rs. 1.18 trillion is recurrent expenditure, salaries, admin, operations. Rs. 375B is debt servicing. Only Rs. 407B, 21% is capital. That is the portion that builds roads, schools, and hospitals. And at 8 months in, only 19% of it has been spent.

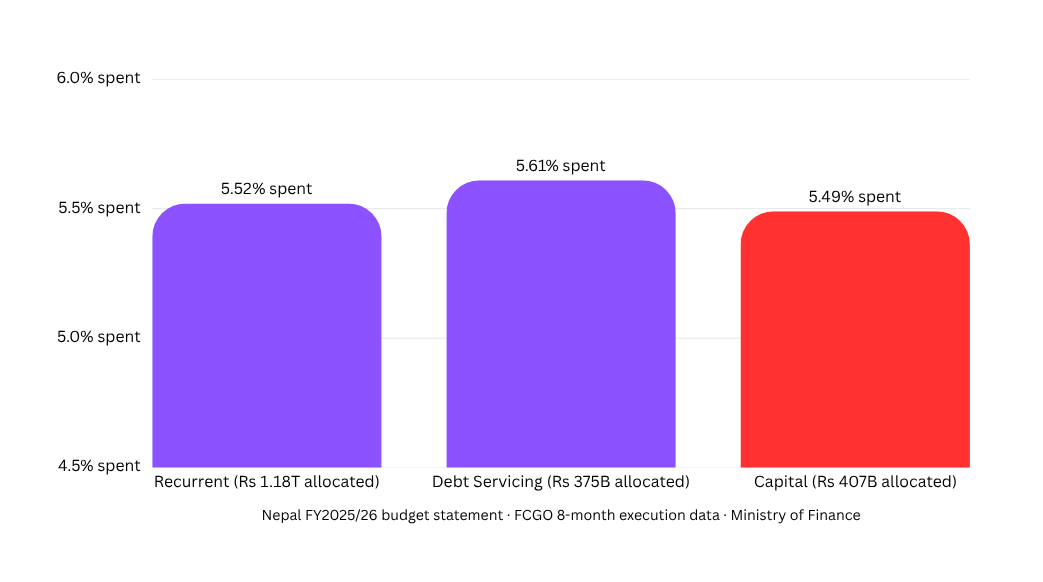
Recurrent spending, salaries, administration, and running costs are at 54% of their allocation at eight months. Debt servicing is at 55%. Both are tracking roughly where they should be for a fiscal year two-thirds done. Capital spending is at 19%. The government is paying its staff and its creditors on schedule. It is not building anything.
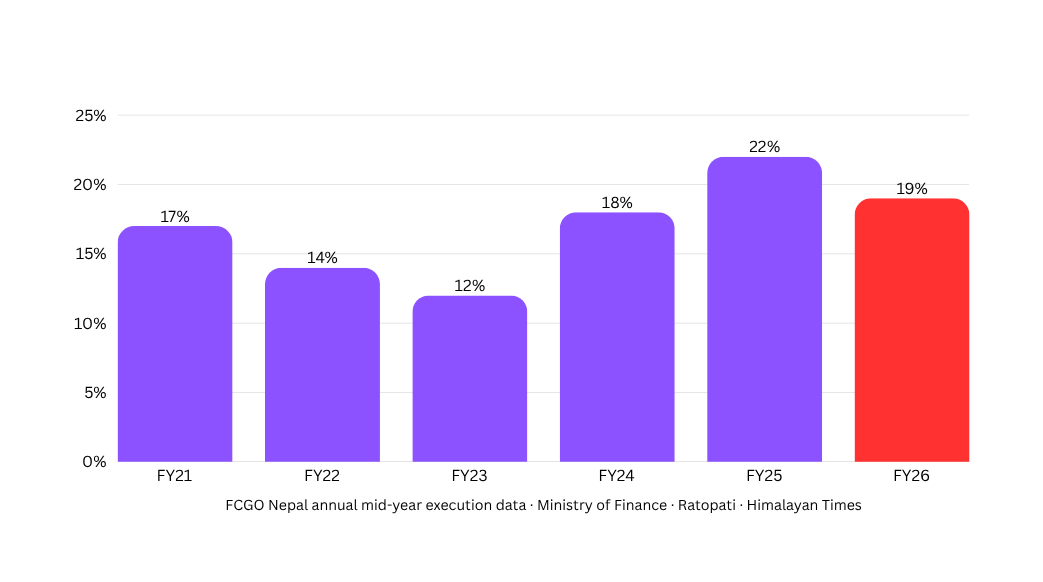
The 19% is not unusually bad by Nepal’s historical standards — FY24 was 18%, FY23 was 15%. What makes it damaging specifically in FY26 is the context: the World Bank just named reconstruction spending as the primary recovery driver for FY27, and reconstruction requires contracts awarded now, project teams mobilised now, and procurement processes started now. If FY26 ends at the historical 50–60% capital execution rate, which it will, because the pattern is identical every year, the reconstruction pipeline entering FY27 will be too thin to drive the 4.4% recovery the World Bank is projecting.

The 19% is not a crisis anomaly. It is precisely where Nepal is every year at this point. The pattern has not improved in five years. What changes is the consequence this year, the World Bank is saying the FY27 recovery depends on exactly the execution Nepal has never managed to improve.
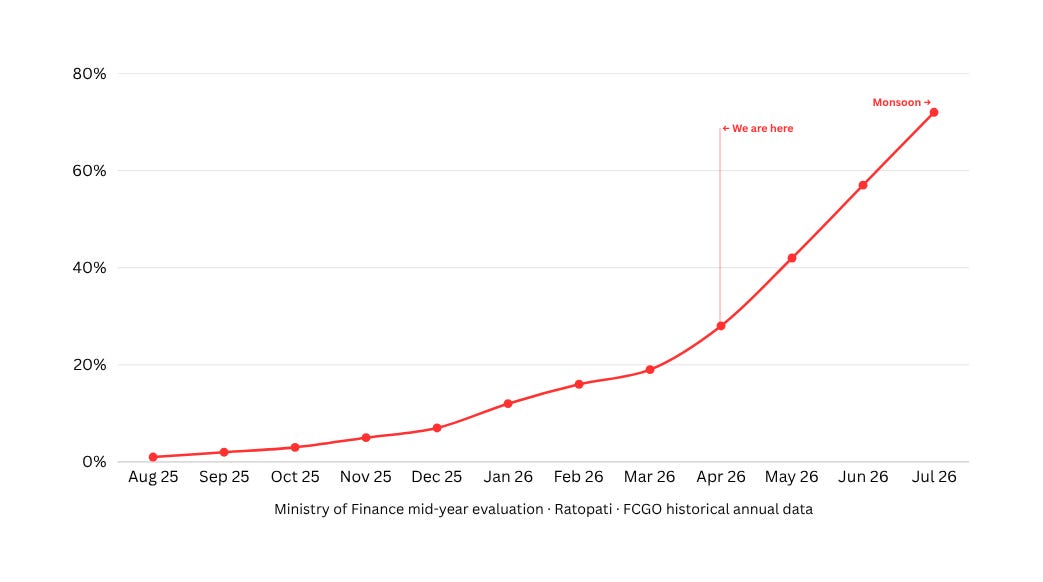
Then comes the sprint. Not in the building season, in the monsoon.

This is not this year's chart. It is every year's chart. Nepal consistently sits at 12–22% at 8 months, then spends half the budget in the final two months, during the monsoon. Roads built in June wash out in August. Bridges rush-contracted in March get finished in the rain. The infrastructure degrades faster than it should. The repair budget competes with next year's allocation.
The government's response to the capital execution problem this week: cut fuel allowances for secretaries from 125 to 70 litres a month, reduce pool vehicle usage, and mandate three people per car. These are not solutions. The reason Nepal cannot execute its development budget is not that senior officials are using too much petrol. It is that procurement processes start six months late, project contracts are awarded in April for work that needs to happen in October, and the institutional machinery across three tiers of government does not match the ambition of the budgets presented every June. Cutting a joint secretary's petrol allowance does not change any of that.
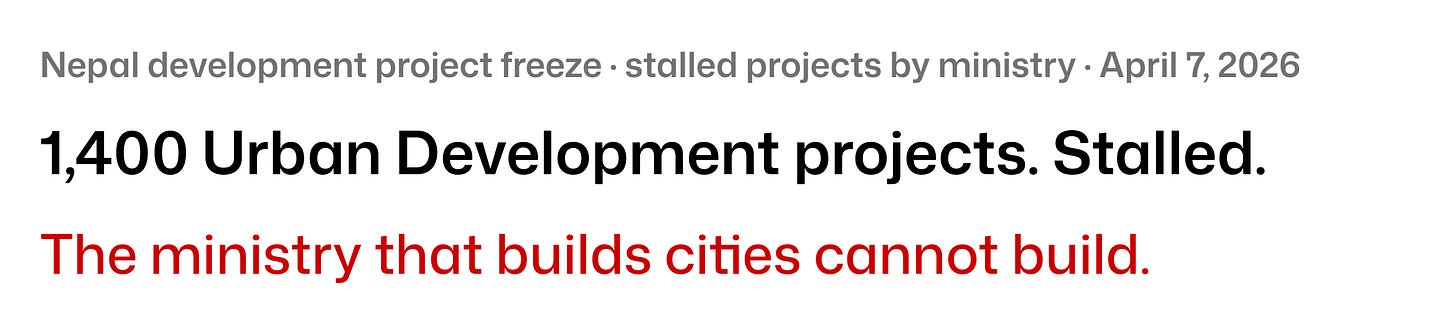
Rs. 119B was frozen after September. Only Rs. 52.9B has been released, covering 2,042 projects. The Rs. 58B freeze this week is additive. Urban Development alone has 1,400 stalled projects. These are not abstractions. There are roads, drains, parks, and schools in municipalities where the mayor has been promising delivery for two years.
Three data drops this week. Three different institutions. The World Bank’s 2.3% is the aggregate verdict of two simultaneous shocks hitting an economy with limited buffers. The NSO’s Q2 data shows what the economy looked like before the second shock arrived, already K-shaped, already slowing in the physical sectors that employ most people, paddy declining before the fuel crisis added further pressure. And the capital budget number shows why the recovery the World Bank is projecting for FY27 is not guaranteed: Nepal has consistently failed to execute the infrastructure spending that recovery requires, debt servicing is now crowding out the new investment that would break the cycle, and the government’s response this week was to tell its secretaries to carpool.
The pattern does not break because no single actor has both the incentive and the authority to break it.