Does NEPSE Really Fall Before Dashain?
A practical guide to testing seasonal market claims, using 21 years of NEPSE data to examine whether the market really falls before Dashain.
Every broker in Kathmandu will tell you the market sags before Dashain. Most seasonal stories are noise that happens to rhyme. This one survives every test thrown at it, the reason usually given for it does not and the method is the lesson.
Dashain is almost here. Over the next ten days a large share of the country will travel home, spend heavily and receive tika from the oldest person in the room. For anyone who owns shares, the festival comes with a piece of folk wisdom that is repeated every September in brokers' offices and on trading forums: the market falls into Dashain. Households need cash, the story goes so they sell. Banks need cash so they stop lending to margin traders. The index drifts lower until the exchange shuts for the holiday and then it comes back.
Folk wisdom about the calendar is the commonest kind of false finding in markets. It is easy to remember the years that fit and forget the ones that did not and with only one Dashain a year a single dramatic autumn can stand in for a decade. So this is a lesson in how to read a seasonal claim using the Dashain claim as the worked example. The method matters more than the answer. But the answer as it turns out is more interesting than the folklore: the run-up weakness is real and unusually strong, the reason usually given for it does not show up in the data and this year is so far the exception.
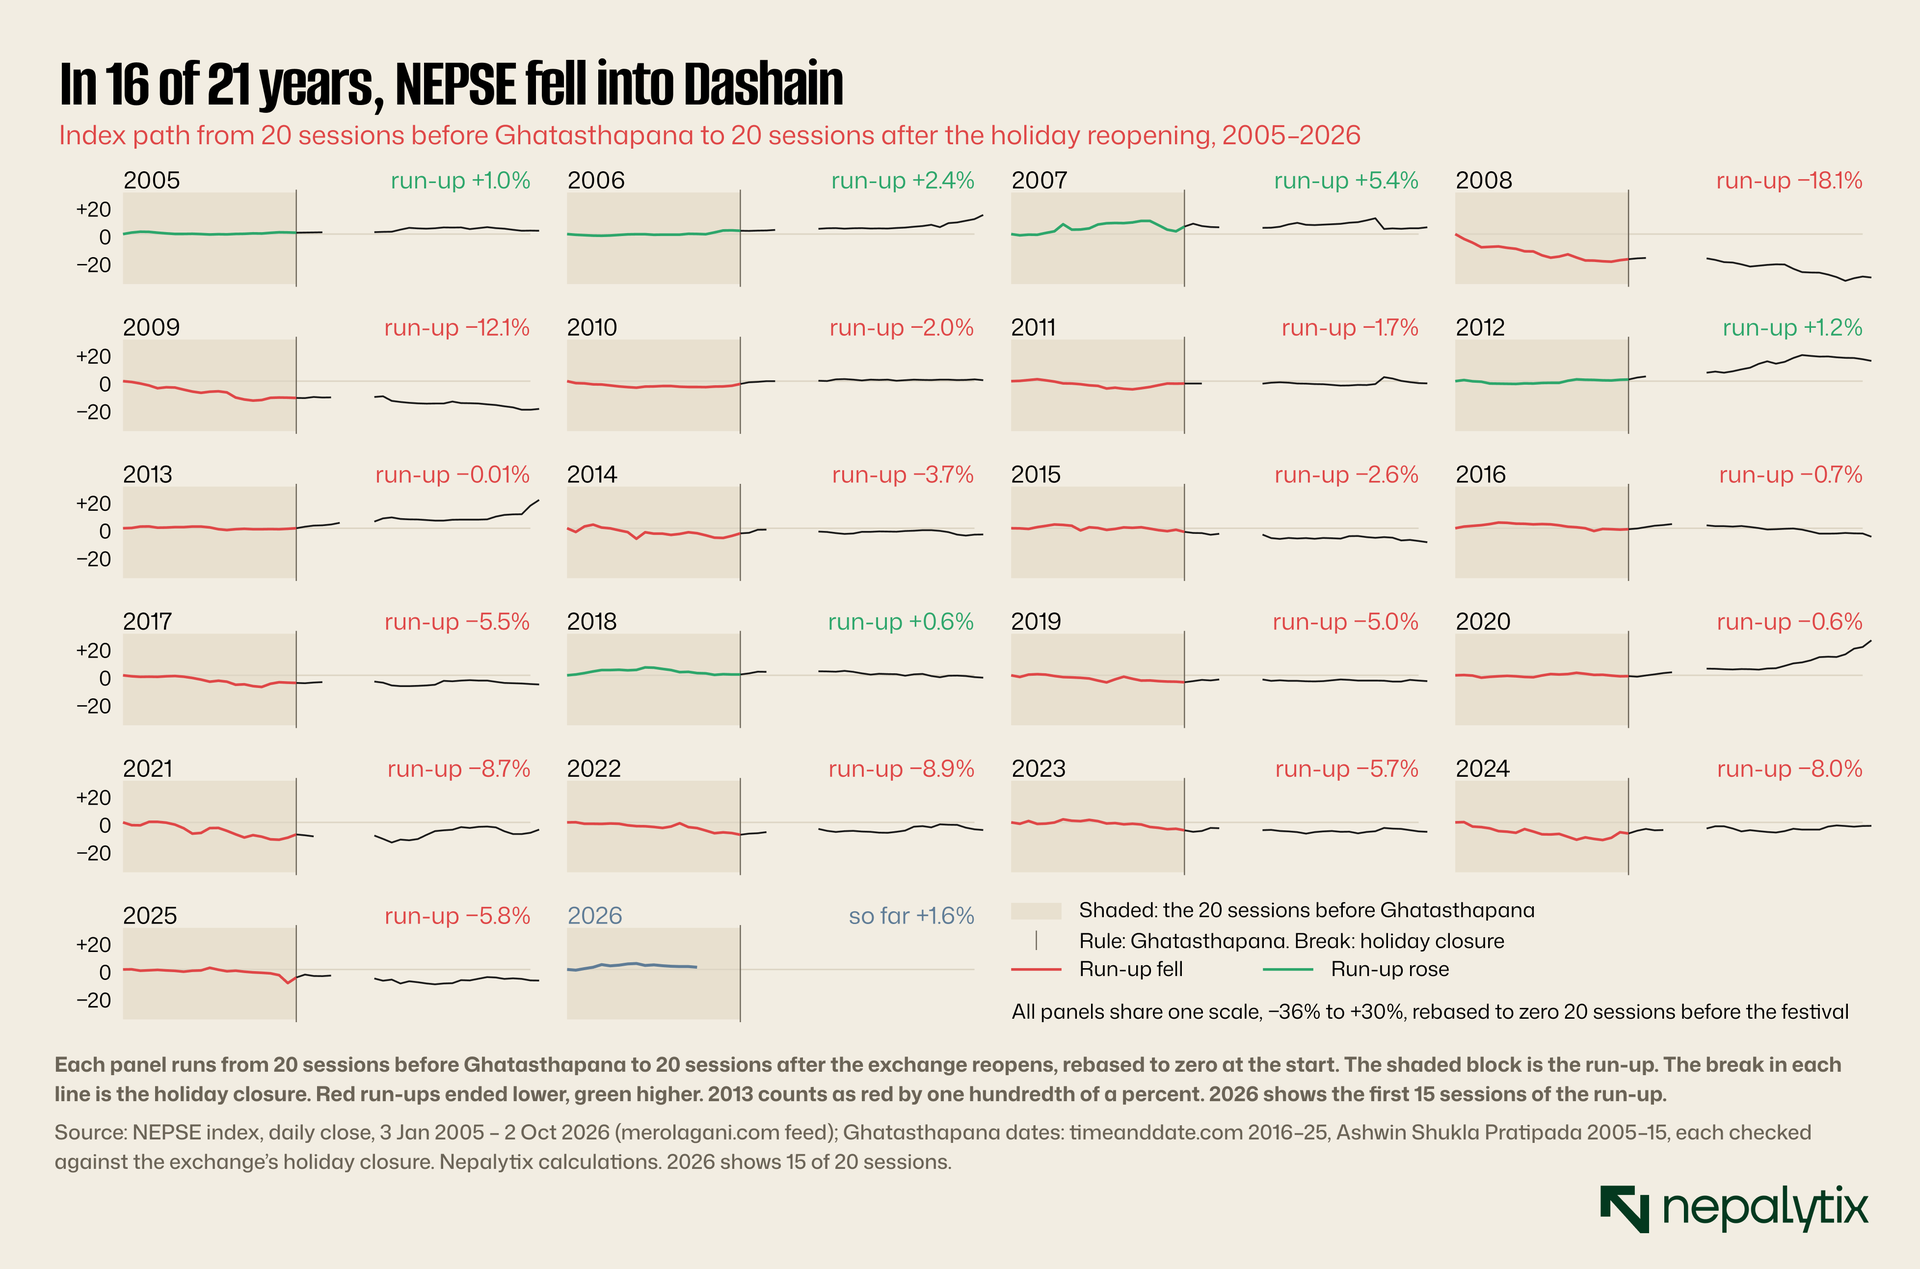
Start with what the eye sees. The exhibit below shows every Dashain since 2005 each in its own small panel, all drawn on the same scale.
Start with the calendar, not the chart
The first decision in any seasonal study is the clock. A calendar month is the wrong clock for Dashain because the festival moves. Ghatasthapana, the first day, falls on the first day of the bright fortnight of Ashwin in the lunar calendar. In the Gregorian calendar that has meant anywhere from 19 September (2009) to 17 October (2020). If you average "September" or "October" returns across years, you are averaging a mix of pre-festival weeks, holiday closures and post-festival recoveries in different proportions each year. The signal if there is one, gets smeared across two months.
So the clock used here is event time. Each year is lined up on Ghatasthapana. Day zero is the last close on or before it. Every other point is counted in trading sessions from day zero, not in calendar days because a market that is shut cannot fall. This is the same move an equity analyst makes when studying what happens to share prices around results announcements: line every event up on its own date and count outwards.
Event time needs a reliable list of event dates and the list is the first place a seasonal study can quietly go wrong. Ghatasthapana dates for 2016 to 2025 come from published holiday calendars. Earlier years are computed from the lunar rule. Neither source is worth trusting on its own so each date was checked against something independent: the exchange's own holiday closure. In every year from 2005 to 2025, the longest run of days with no trading in the three weeks after the computed Ghatasthapana starts between two and six days later. That is where it should start, because the long holiday begins around Phulpati on the seventh day. A wrong date would show up as a closure in the wrong place. None does.
The closure itself varies more than people assume. In the 21 years studied, the market was shut for between five and eleven calendar days. Between Ghatasthapana and the closure there were usually three or four sessions, never fewer than two and never more than five. Those sessions the Navaratri week turn out to behave quite differently from the month before them. That is the second reason to use event time. It lets you separate windows that a calendar month would merge.
One more detail matters this year and no other. For most of the record the exchange traded Sunday to Thursday. The index series shows sessions running Monday to Friday since April 2026. Ghatasthapana falls on a Sunday this year. Under the old calendar today would have been a trading day. Under the new one, day zero is Friday 9 October. For 2026 the window is therefore counted back 20 sessions from that Friday, and the panel shows the first 15 of them to Friday 2 October.
Read the panels one at a time
The grid is designed to be read slowly. Each panel is one year and one observation. The temptation with small multiples is to let the eye average them, and the eye is a poor averager: it overweights the dramatic panels and skips the flat ones. Count instead.
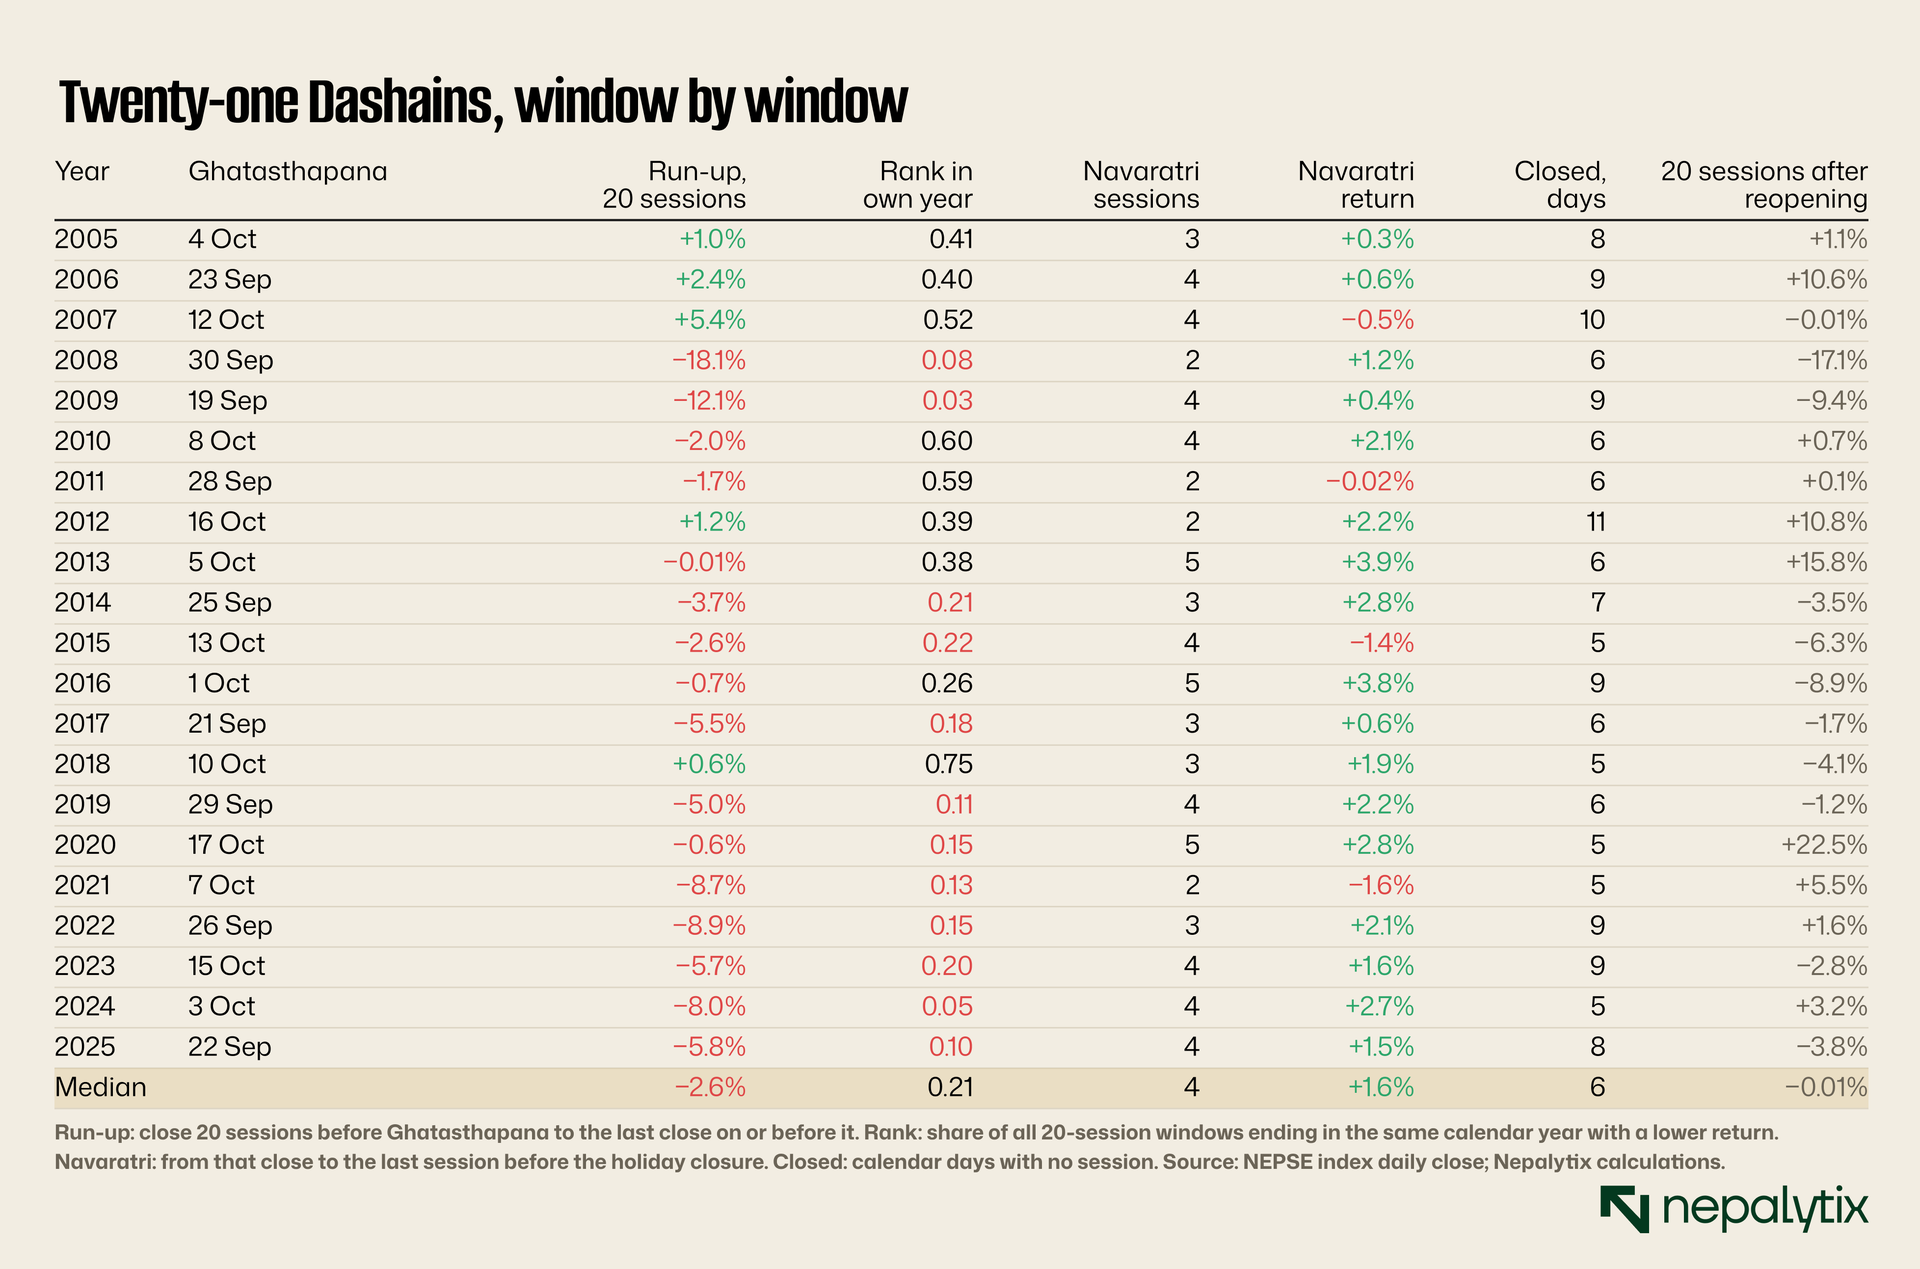
In 16 of the 21 years from 2005 to 2025, the index was lower at Ghatasthapana than 20 sessions earlier. One of those 16 is 2013, which finished down by 0.01%. That is a coin landing on its edge, and an honest count says 15 clear declines, one tie and five rises. Still for comparison: across every 20-session stretch since January 2005, the index fell 47% of the time. A run of 16 declines in 21 tries when the base rate is a little under half, would happen by chance about once in 75 tries. A one-sided sign test puts the probability at 0.013.
The panels also show where the effect is not. The two largest declines, in 2008 and 2009 are the panels the eye goes to first: run-ups of −18.1% and −12.1%. Both came during the long slide after the 2007–08 peak. If those two years were driving the result, the claim would be a story about one bear market rather than about the festival. They are not. The newer half of the record is more consistent than the older half. In the ten festivals from 2016 to 2025, the run-up fell nine times. The exception was 2018 which rose 0.6%.
And the panels show something nobody tells you about Dashain: the line usually turns up just before the break. Look at the short stretch between the shaded block and the gap. In 2014, 2016, 2019, 2020, 2022 and 2024, the run-up ends red and the Navaratri sessions slope up. That is a second, separate pattern and we will come back to it.
Rank each year against itself
Counting declines is the right first step and the wrong last one. It throws away how large each move was. It is also exposed to the market's mood in a given year: in a year when the index fell in two-thirds of all months, a falling September tells you little about the festival. The opposite holds in a boom year like 2021 when an ordinary month rose.
The fix is to grade each Dashain on its own year's curve. For every year, take every 20-session window that ends in that calendar year, a little over 200 of them, and ask what share returned less than the Dashain run-up did. A run-up that beat nothing scores zero. One that beat everything scores one. If the festival had no effect, these scores would be spread evenly between zero and one and their average would sit near 0.5.
The average is 0.281. The scores are not spread evenly. Twelve of the 21 run-ups ranked in the bottom quarter of their own year, against about five you would expect by chance. The probability of twelve or more landing there by accident is under 0.2%. None ranked above the 75th percentile. The 2008 and 2009 run-ups, already judged against two terrible years still ranked at 0.08 and 0.03. They were bad even by the standards of bad years.
This step is where most seasonal claims die and it is worth knowing why. Raw averages of seasonal returns are dominated by trend. NEPSE rose about elevenfold between January 2005 and October 2026. In a market that rises that much, almost any window has a positive average and the "seasonal" pattern is mostly a measure of which years happened to be in boom. Ranking within the year removes the trend and leaves the season. If a pattern survives that it has earned the next test.
Stack the years and look at the shape
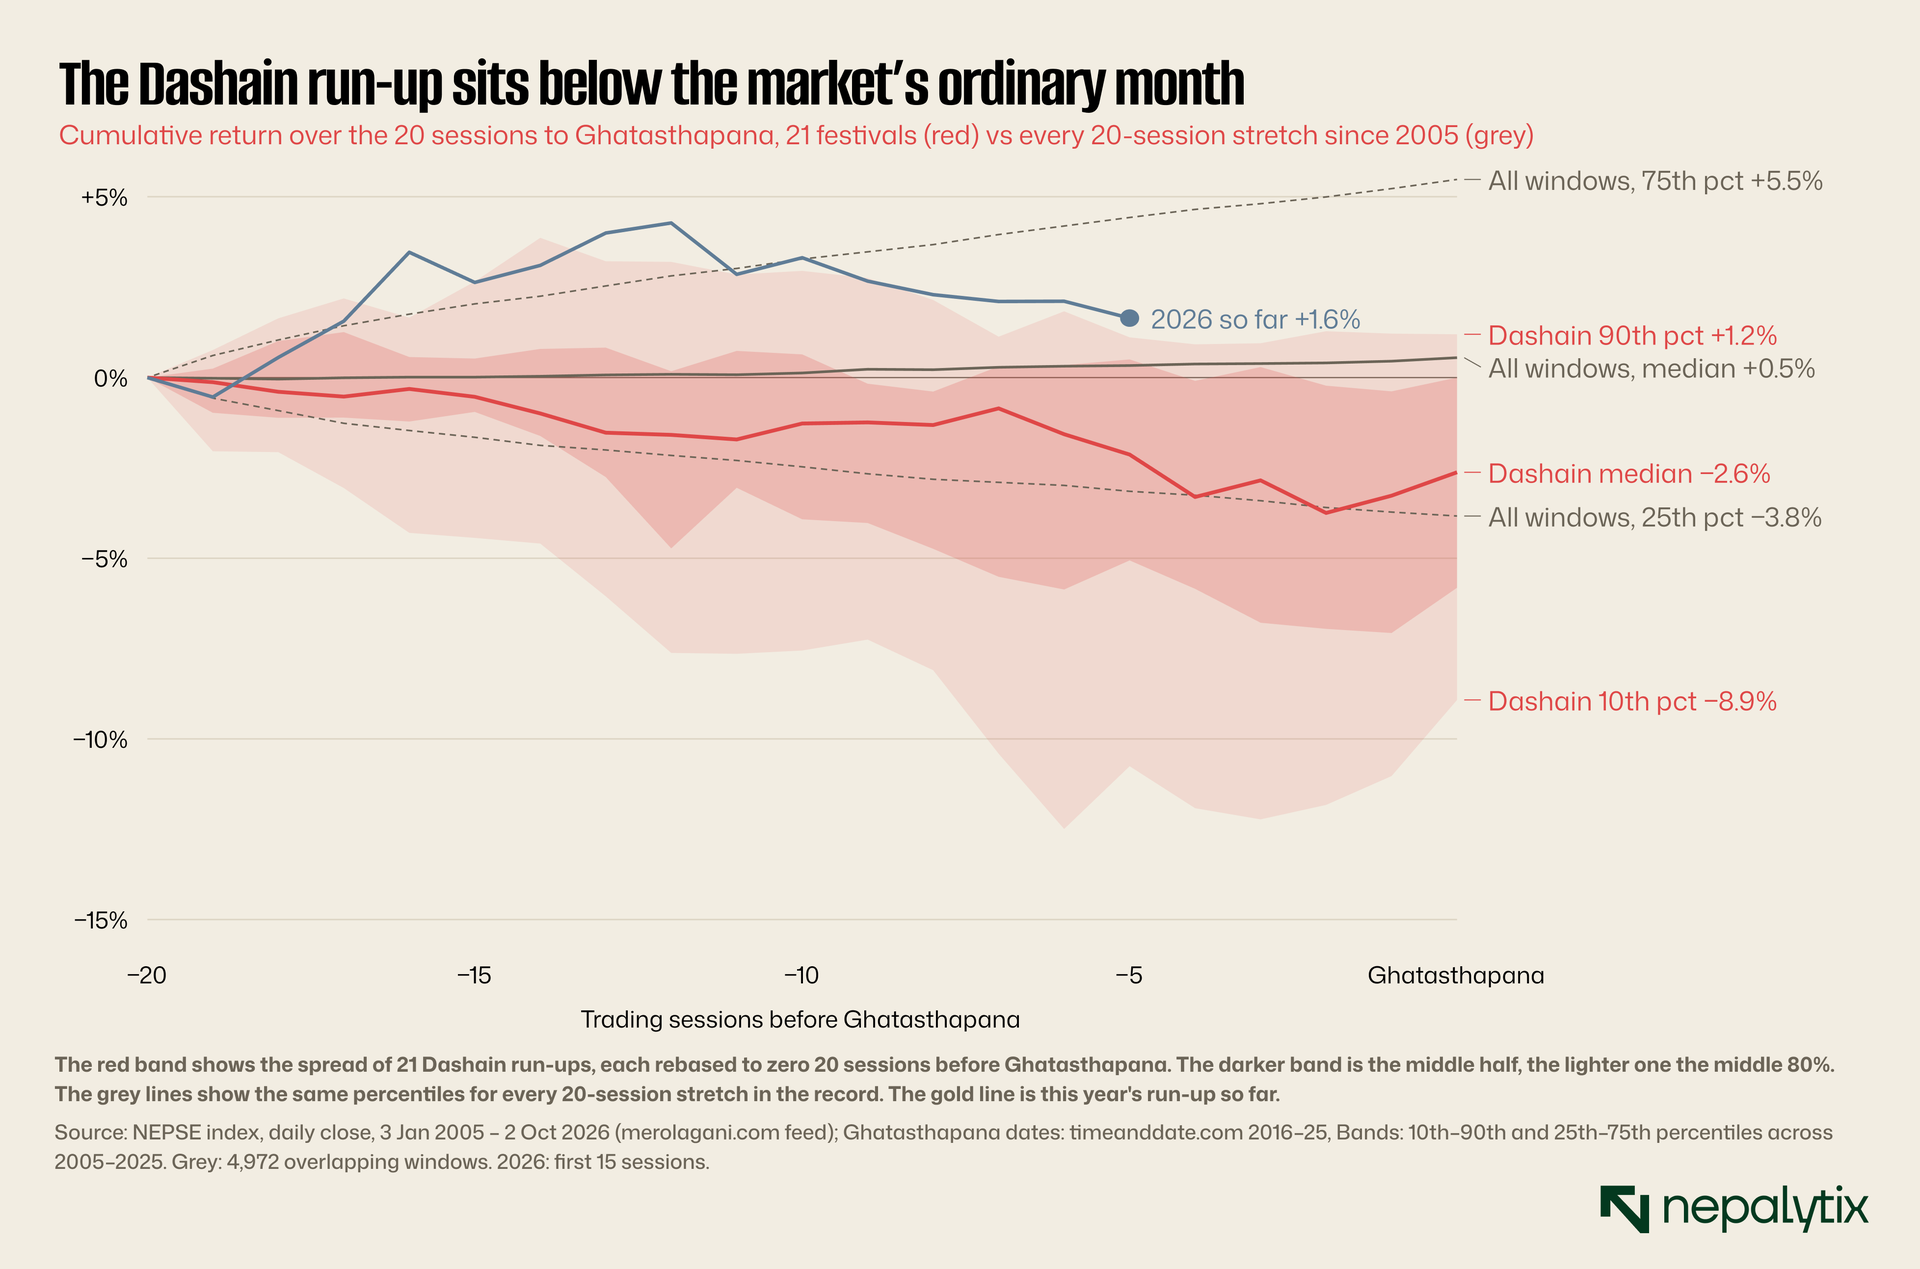
The ranked scores say the run-up is weak. The fan chart says how weak and when. At Ghatasthapana, the median Dashain run-up stands at −2.6%. The median of every 20-session stretch since 2005 stands at +0.5%. The 90th-percentile Dashain at +1.2% sits barely above the ordinary month's median. Put plainly, a good Dashain run-up looks like an unremarkable ordinary month.
The shape is the useful part. The median line does not fall steadily. It slides through the first fifteen sessions and then flattens. Measured over just the last five sessions before Ghatasthapana, the median return is +0.17% and the run-up fell in only ten of 21 years: a coin toss. Measured over the fifteen sessions before that, the median is −2.1% and the decline rate is 13 of 21. So the weakness belongs to the stretch from about four weeks to one week before the festival usually the back half of Bhadra and the start of Asoj. It is not the final pre-holiday week when the folklore says households are cashing out.
That matters for reading the claim, and it matters for 2026. Whatever drives the pattern acts early. By the time the tika shopping is visible in the streets, the market has usually done its falling.
The fan is also a reminder of how much any single year can differ from the median. The lighter band runs from −8.9% to +1.2% at day zero: ten percentage points between a bad Dashain and a good one. A pattern can be real and still be useless for predicting the next instance. The two statements are not in conflict, and confusing them is the second commonest mistake in reading seasonality.
Run the test somewhere it should fail
Everything so far has a weakness that is easy to miss. The 20-session window ending at Ghatasthapana was chosen because the folklore points at it. But financial time series have plenty of windows that look odd for no reason. If you test one window, get a striking result and stop, you do not know whether the result is striking because of the festival or because some window somewhere will always look striking.
The way to find out is a placebo test. Run exactly the same procedure on windows where the festival cannot be the cause and see how often they produce a result as extreme. Here, that means sliding the window across the year. Take the 20 sessions ending 41 sessions before Ghatasthapana, then 42, and so on out to 240. Do the same after the festival out to 200 sessions. Skip anything ending within 40 sessions of Ghatasthapana because those windows overlap the one being tested. That gives 283 placebo windows. For each, compute the same average within-year rank across the same 21 years.
None of the 283 placebos is as weak as the Dashain run-up. The weakest scores 0.346. The run-up scores 0.281. Taken at face value, that is a one-in-284 result. It is not quite that strong and the honest version of the claim matters more than the dramatic one. Neighbouring windows share 19 of their 20 sessions so the 283 placebos are not 283 independent tests. Spaced so they do not overlap, they amount to about 14. Being weaker than all of 14 independent placebos would happen by chance about once in 15 tries. That is good evidence. It is not proof.
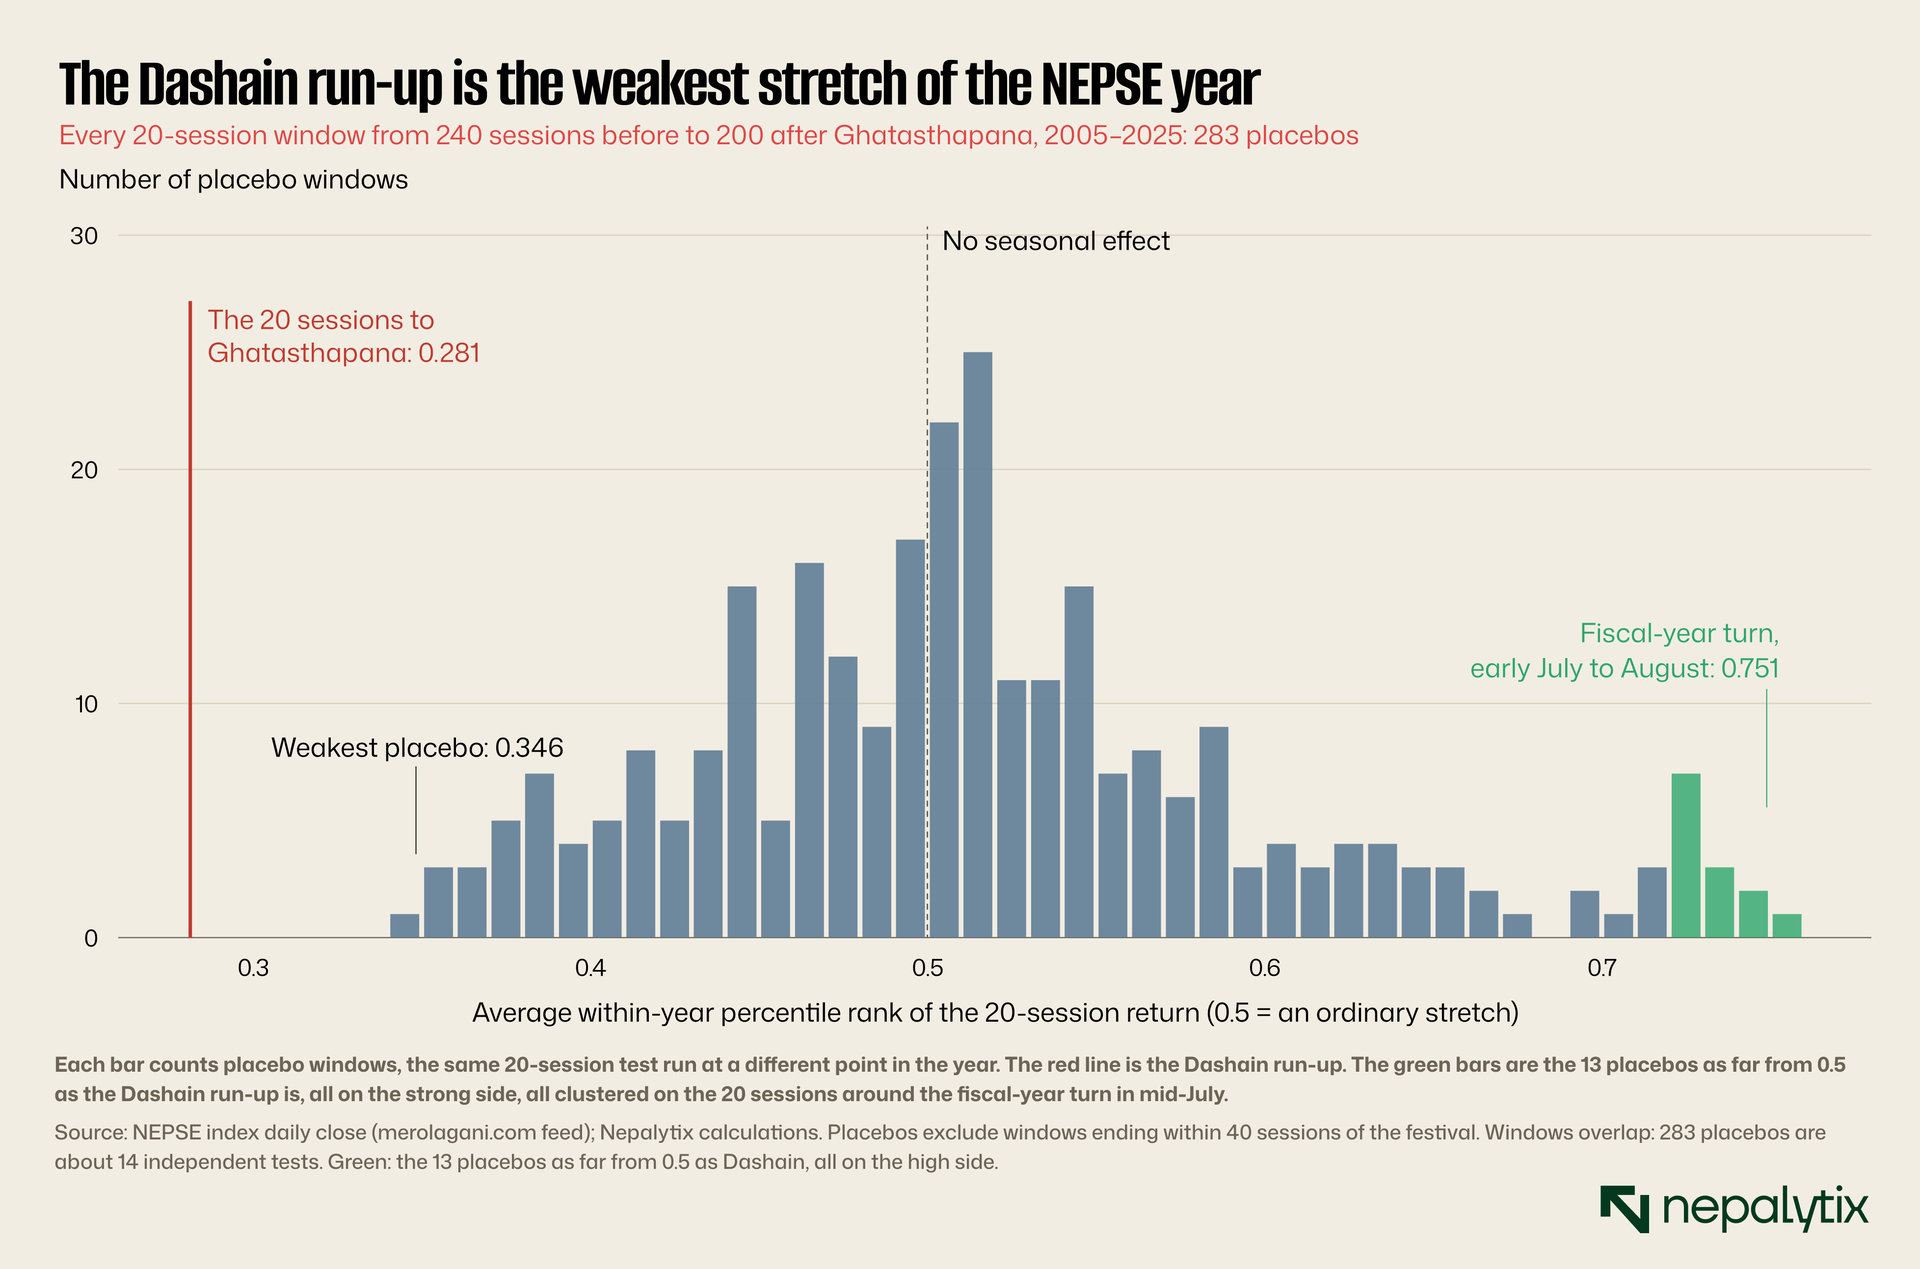
The placebo test also caught something the folklore never mentions. A seasonal test is two-sided unless you decided in advance that it was not. Measured as distance from 0.5 in either direction, 13 placebo windows are as extreme as the Dashain run-up. Every one of them is on the strong side. All of them sit in the same part of the calendar: the 20 sessions running from early July to the start of August. That is the turn of Nepal's fiscal year which ends in mid-July with the monetary policy statement usually following within weeks. The strongest of these windows scores 0.751. So NEPSE's year has two seasonal ends, not one. Its weakest stretch is the month before Dashain. Its strongest is the month either side of Shrawan 1.
That is the general lesson of the placebo step. You run it to check your finding, and it often hands you a better one. A study that tested only the Dashain window would never have seen the fiscal-year rally. It is a candidate for its own piece with its own tests and nothing here should be read as having established it.
One more check belongs in this section because it is the one readers ask about. Was day zero picked because it gave the best answer? It was not: it was fixed in advance as the last close on or before Ghatasthapana. As it happens, the very weakest window ends three sessions earlier, with a score of 0.267. The difference is small but quoting the pre-set anchor rather than the best one is the habit that keeps a seasonal study honest.
Three windows, three answers
The folklore says the market falls into Dashain and comes back after. That sentence contains three claims about three different windows. Event time lets you test each one separately and they give three different answers.
The run-up, the 20 sessions to Ghatasthapana, is weak as shown above.
The Navaratri sessions, from Ghatasthapana to the last session before the closure, are strong. The median return over those two to five sessions is +1.56%. It was positive in 17 of 21 years. Ranked against same-length windows in the same year, the average score is 0.671, and 16 of 21 beat their year's median. One reading is that traders buy back before a long closure, either to cover short-term positions or because nobody wants to hold cash through ten days of spending. Our data cannot tell those apart. The pattern itself is clear.
The recovery, the 20 sessions after the market reopens is not there. The median return is 0.0%. It rose in ten years and fell in eleven and the average within-year rank is 0.477. "It comes back after Dashain" is the part of the folklore that fails. When the market did rise strongly after the holiday, as in 2013 and 2020, the rise was part of a wider rally that had little to do with the festival. Both of those post-festival windows ranked in the top tenth of their year but so did plenty of other windows in those years.
Now see what happens if you skip the separation and measure one window from 20 sessions before Ghatasthapana to 20 sessions after reopening. The median total is −4.2%, which sounds dramatic. But it fell in only 14 of 21 years and the sign test probability rises to 0.095, which most people would not accept as evidence. The total window blends a real weakness, a real bounce and a non-effect. Combined, they produce a result that is both larger and less reliable than its strongest component. Seasonal claims made in the press are usually about windows like this one and they are usually weaker than they look for exactly this reason.
How hard to lean on twenty-one observations
Twenty-one is a small number and every test above shares the same 21 years. The right response is not to throw the result away. It is to find out how much it depends on choices that could have gone the other way.
Start with the window length. Twenty sessions is a natural month, but not the only one. Rerun the within-year rank with other lengths, all ending at Ghatasthapana and the scores are 0.449 for five sessions, 0.348 for ten, 0.285 for fifteen, 0.281 for twenty, 0.298 for thirty and 0.275 for forty. Apart from the five-session window, which we already know is flat, the result barely moves. That is what a real effect looks like. A spurious one usually appears at one length and vanishes at the next.
Then drop the most influential years. Without 2008 and 2009, the score is 0.306 across 19 festivals: weaker but still in the zone that no placebo reached. Split the record into halves and the earlier decade, 2005 to 2014 scores 0.360. The later decade, 2016 to 2025, scores 0.209. The effect has strengthened rather than faded. That is unusual. Most published seasonal patterns weaken once enough people know about them because traders act early and pull the move forward. A strengthening pattern suggests the cause is not mainly traders anticipating each other. It suggests something in the real economy of the season.
Finally, keep the limits in view. Even a clean result over 21 years cannot tell you about a year whose conditions are unlike any of the 21. Nothing in this sample resembles a market that has just switched its trading week for example and 2026 is the first year in which that is true.
Look for the mechanism and let it fail
A seasonal pattern with no mechanism is a curiosity. One with a mechanism you can measure is a finding. The folklore offers a mechanism, and it is testable: liquidity. Households withdraw cash for the festival, deposits drain from banks, banks scramble for funds, the interbank rate rises and lending against shares tightens. If that were the cause, it would show up in the money market in the Dashain month.
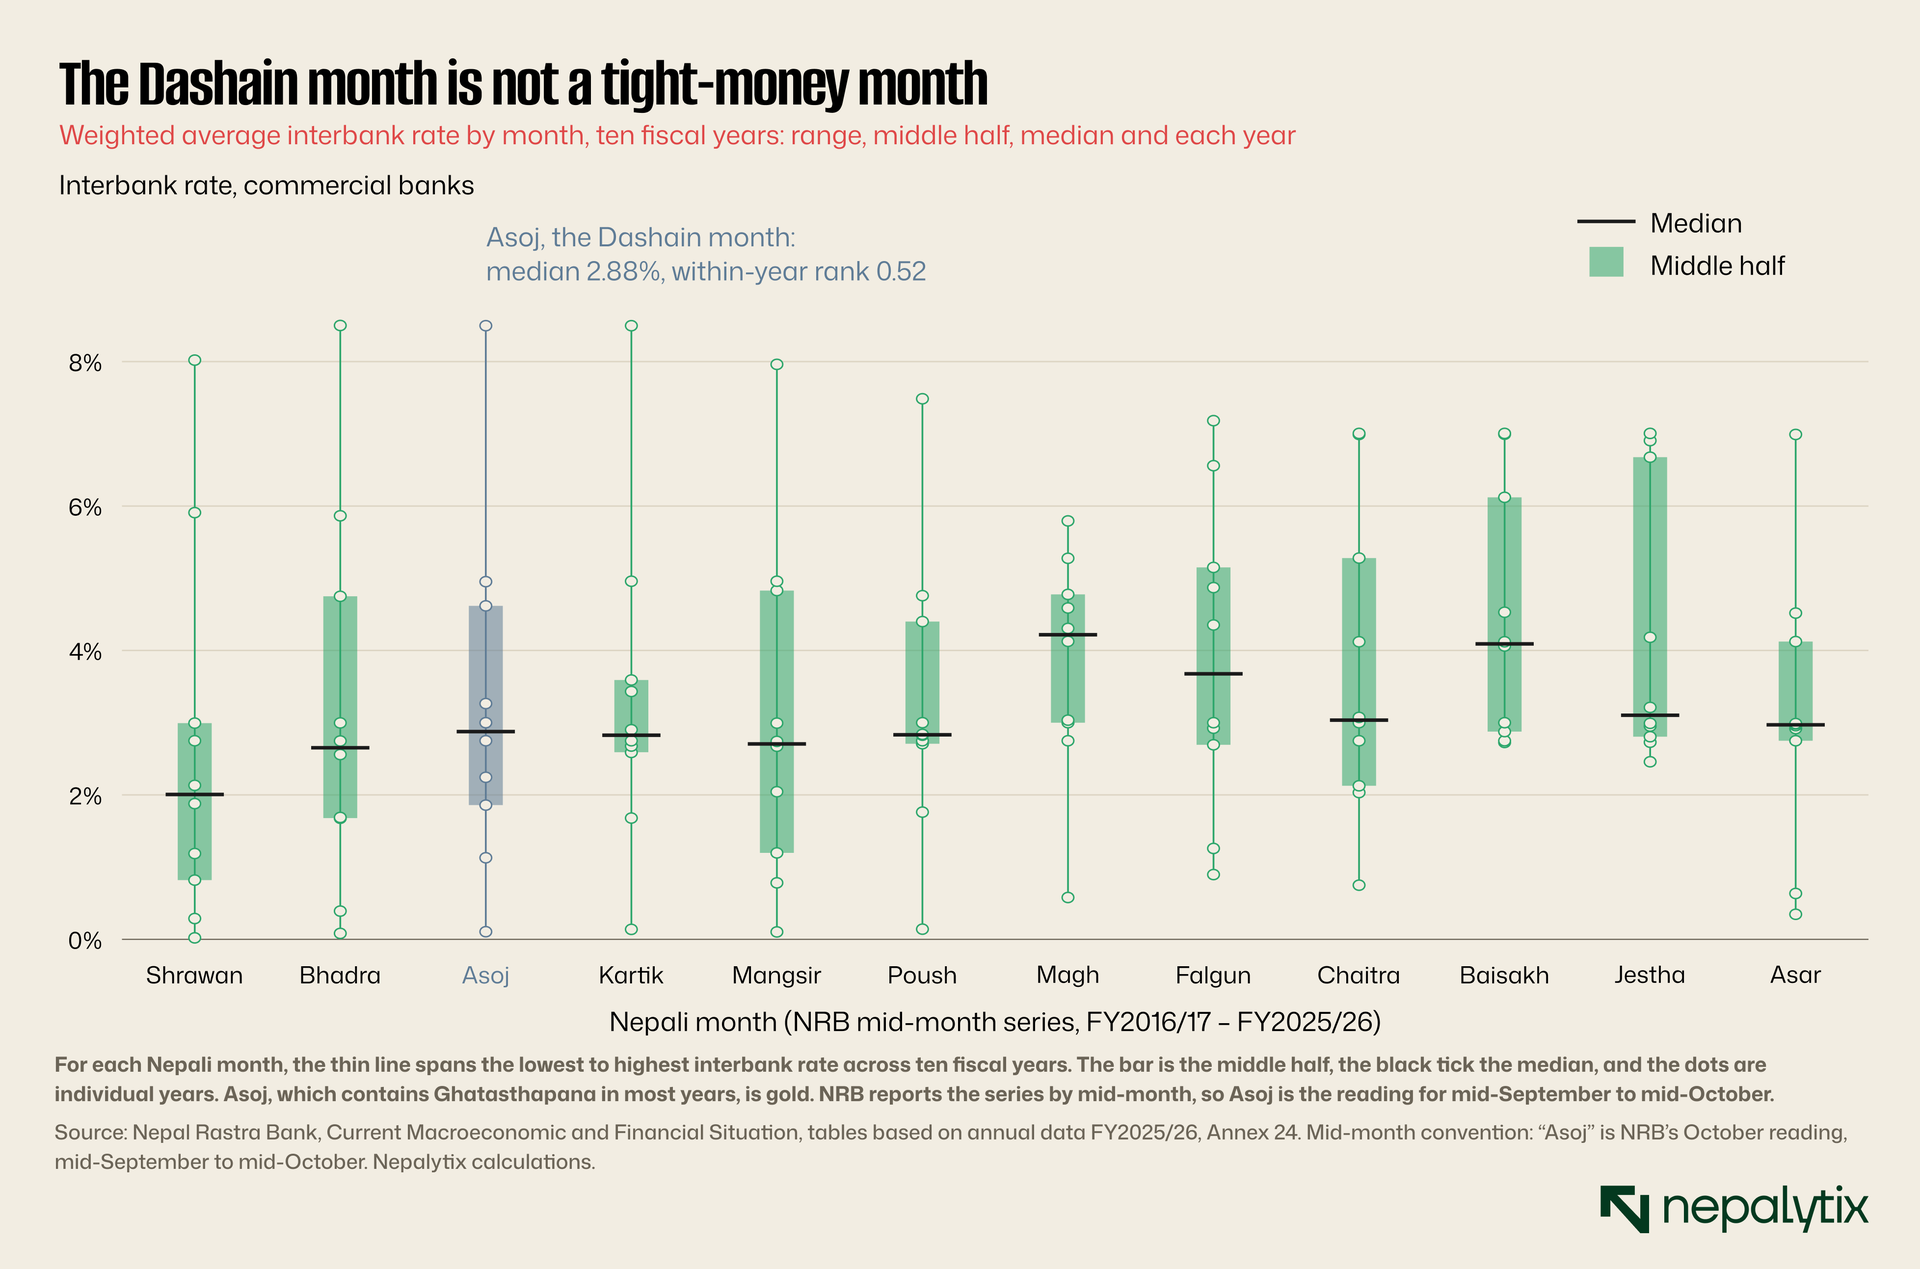
It does not show up. Across ten fiscal years, the median interbank rate in Asoj was 2.88%. That is nearly identical to Bhadra, Kartik and Poush, and well below Magh and Baisakh, the two tightest months of the year. Ranked within its own fiscal year, Asoj averages 0.52 almost exactly the middle. In some years it was the tightest month (FY2019/20). In others it was among the loosest (FY2017/18 and FY2023/24). The month in which the share market reliably weakens is for the banking system's own funding, an ordinary month.
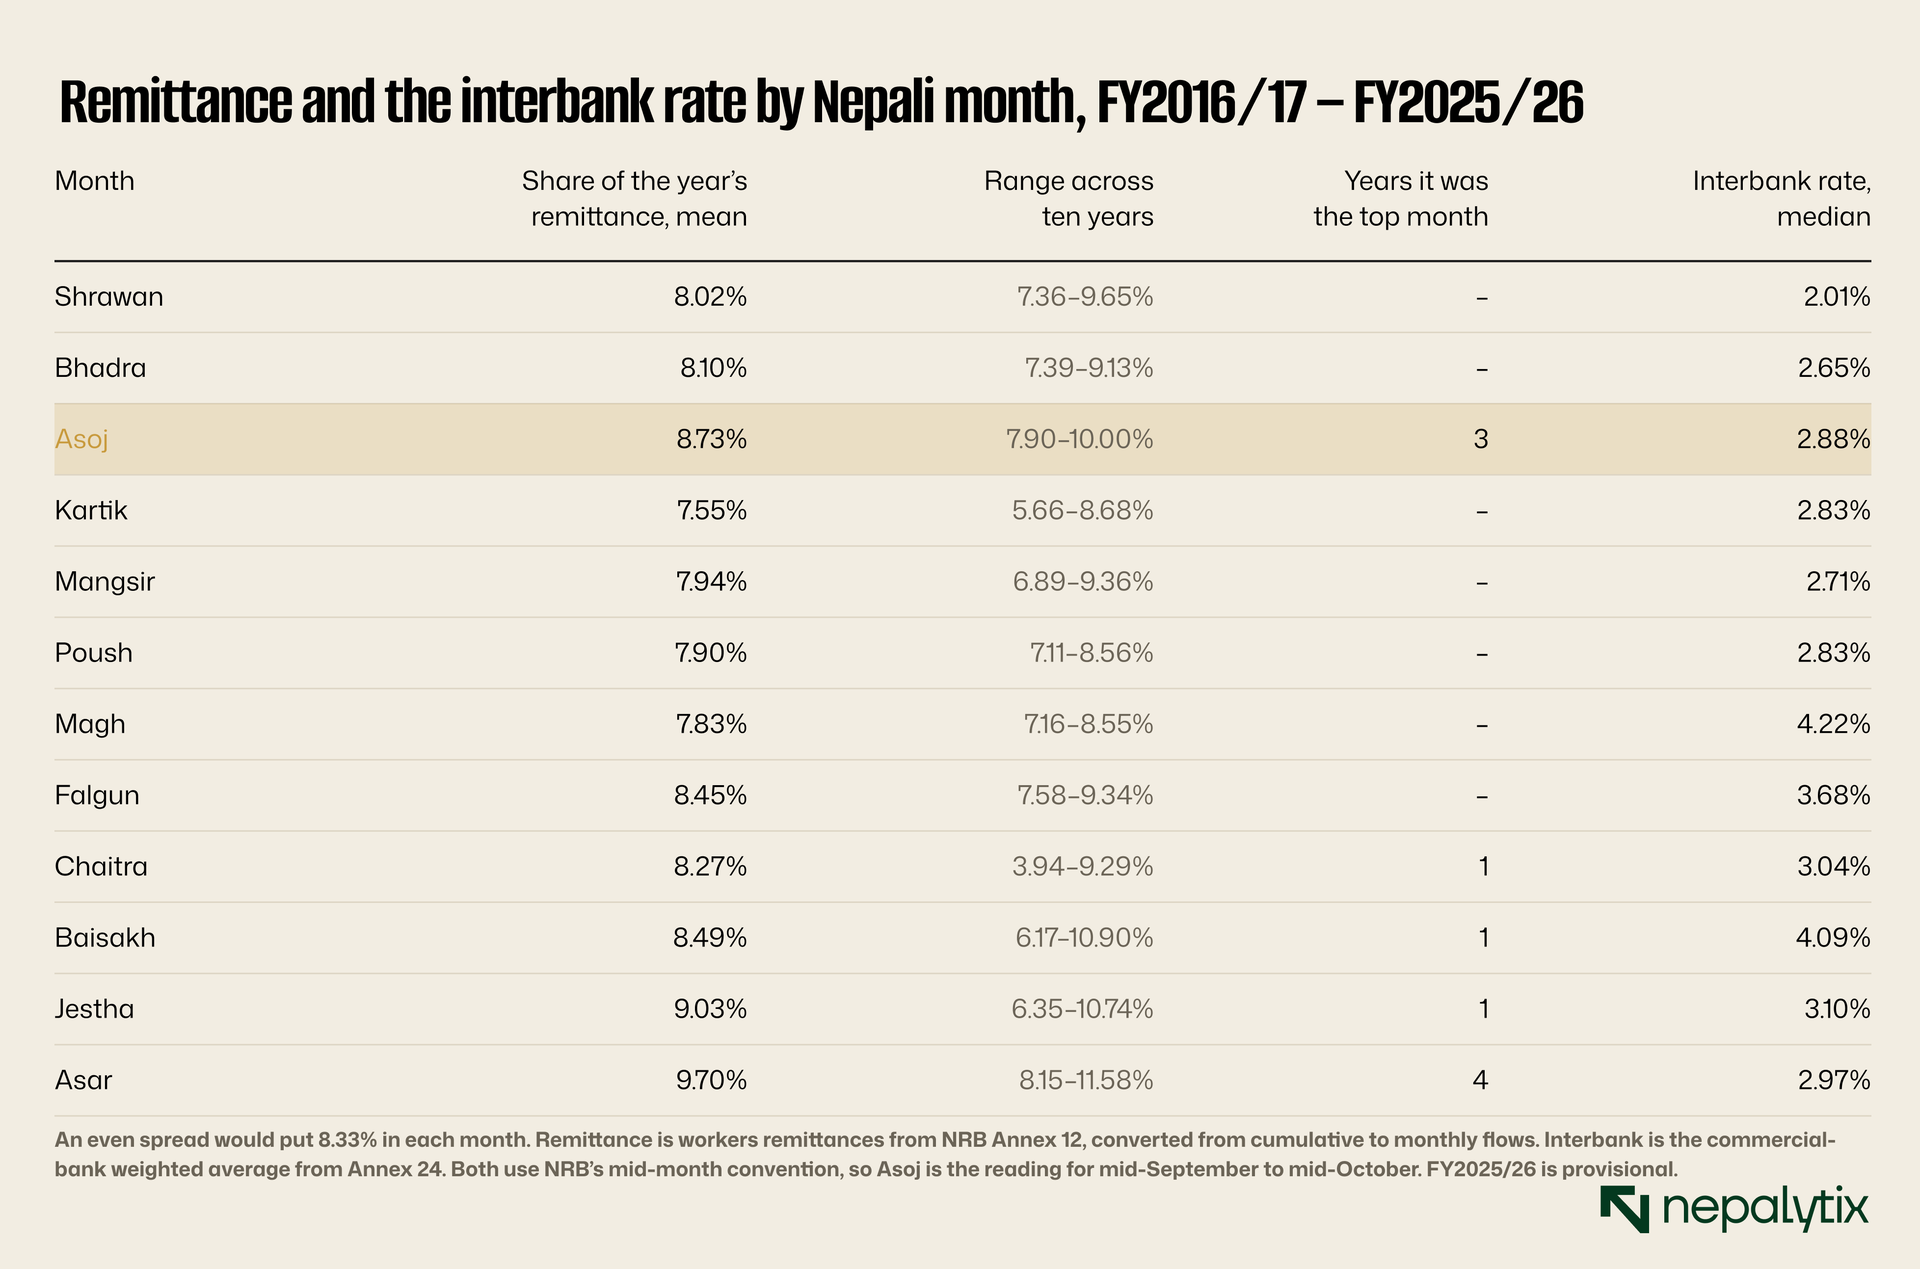
The remittance data points the same way. If a cash squeeze were the mechanism, you might expect inflows to lag the festival's demand. They do the opposite. Asoj carries on average 8.73% of the year's workers' remittances above the 8.33% an even spread would give. It was the single largest month in three of the ten years. Workers send money home for Dashain and the banking system receives it.
There are three ways to read the failure, and a good analyst holds all three open. First, the monthly data may be too coarse. A squeeze lasting ten days inside a month that is otherwise loose would average away and NRB's mid-month convention splits the Dashain fortnight across two readings in some years. Daily interbank figures would settle this. They are not in the annual tables used here. Second, the cash pressure may fall on households rather than banks. A family that sells shares to pay for the festival needs no help from the interbank market to do it and the effect would appear in the share price and nowhere in the banking statistics. Testing that properly needs selling by investor type which is not data we have. Third, the mechanism may be something else entirely: the end of the first quarter, which arrives with Asoj or the timing of quarterly results or behaviour that has simply become habit. None of these is established here.
What is established is narrower and more useful. The pattern in prices is strong. The most commonly repeated explanation for it is not visible at the resolution of the official data. When a mechanism fails that is the point at which most writing on seasonality quietly drops the mechanism and keeps the claim. The better habit is to report both, the robust pattern and the failed explanation so the next person knows where to dig.
This year so far
Which brings us to 2026, and to the exhibit's gold line. From Wednesday 9 September to Friday 2 October, the first 15 sessions of this year's run-up, the index rose 1.6% from 2,545 to 2,587. Graded against every 15-session window this year that ranks at 0.68: better than an ordinary stretch not just better than an ordinary Dashain. In the fan chart it sits above the 90th percentile of past run-ups at the same point.
Only one earlier festival started more strongly over those first 15 sessions. That was 2007, up 9.5%. 2018 started level with this year, up 1.6%. Both finished the run-up positive. Two years is not a pattern and nobody should build a position on it. But the reading follows from the shape established above. The weakness usually happens between four weeks and one week before Ghatasthapana and this year that stretch has already passed without it. Five sessions remain before day zero, assuming the exchange trades every weekday this week. The historical median for those last five sessions is close to flat.
The other thing the record says about this week is that the Navaratri bounce does not need a weak run-up to happen. In 2005, 2006, 2012, 2013 and 2018 the sessions between Ghatasthapana and the closure rose after run-ups that were flat or positive. The bounce looks like a feature of the holiday closure, not a rebound from the decline.
What to take from it
The answer to the folk question is a qualified yes. The NEPSE index has reliably underperformed in the month before Dashain, more strongly in the last decade than the one before. It has reliably risen in the few sessions between Ghatasthapana and the holiday closure. It has not reliably recovered afterwards. The usual explanation, a liquidity squeeze in the banking system, does not appear in the monthly money-market data. And 2026 has so far broken the pattern.
The method transfers to any calendar claim you will hear: Tihar, the fiscal-year turn, the budget, quarterly results, the monetary policy statement. Six habits did the work here, and each one would have caught a mistake on its own.
Use event time. Line every year up on the event and count in trading sessions. Calendar months smear a moving festival across two readings.
Check the event dates against something independent. Here the exchange's holiday closures confirmed every Ghatasthapana in the list. One wrong date in 21 is enough to blunt a real effect or manufacture a false one.
Rank within the year. Raw averages in a market that rose elevenfold measure the boom, not the season.
Run placebos and read them two-sided. The placebo test confirmed the finding and turned up the fiscal-year rally, which the folklore never mentions.
Split the window into its parts. "Falls before and recovers after" was three claims and one of them was false. The combined window was weaker evidence than its strongest part.
Test the mechanism separately from the pattern, and publish the failure. A real pattern with an unproven cause is a finding. A real pattern with a cause asserted but never tested is how folklore gets made.
None of this tells you what the index will do this week. A pattern that holds in 16 years of 21 will still fail in some years and this may be one. What it does tell you is how much weight to give the next person who says the market always falls before Dashain. They are more right than most people who say "always" about a market. They are probably wrong about why.
Disclaimer
This report has been prepared by Nepalytix for informational and educational purposes only and does not constitute investment advice, an offer, or a solicitation to buy or sell any securities.
The information contained in this report is based on sources believed to be reliable; however, Nepalytix does not guarantee its accuracy, completeness, or timeliness. Opinions, estimates, and projections expressed herein are those of the authors as of the date of publication and are subject to change without notice.
Investing in securities involves risks, including the possible loss of principal. Past performance is not indicative of future results. Readers are advised to conduct their own independent research and consult with a qualified financial advisor before making any investment decisions.
Nepalytix and its contributors may hold positions in the securities discussed in this report at the time of publication or thereafter.
Neither Nepalytix nor any of its affiliates accept any liability for any loss arising from the use of this report or its contents.