How Nepal's 365-Day Shareholding Rule Works: Capital Gains Tax Explained
Does holding a share for more than 365 days really save you money? We analysed 328,915 historical one-year holdings on NEPSE to understand how much investors actually save through lower capital gains tax and whether waiting is worth the risk.

Hold a share for more than a year and the tax on your gain falls from 5% to 3.75%. We tested the advice to wait on 328,915 one-year holdings. The saving is real, small and worth less than a single day's trading.
Somewhere in your MeroShare account there is a share you have held for eleven months. It is up. You have half a mind to sell it, and one thing is stopping you: in a few weeks the holding crosses 365 days and the tax on your gain drops from 5% to 3.75%. Everyone you know says the same thing. Wait for the year. It is free money.
It is money. It is not free and it is not much. This Paisa works out exactly how much then tests the advice against every one-year holding an investor could have bought on NEPSE since 2011. The short version: for the typical holder in profit, the lower rate is worth about 0.3% of the position. A NEPSE share moves four times that on an ordinary day. A holder who waited the final month for the lower rate ended up with less money after tax, more often than with more.
None of this means you should sell at day 335. It means the tax line is the wrong reason to hold, and the wrong reason to sell. By the end of this piece you should be able to look at any holding and say, in rupees, what day 366 is worth to you and what you are risking to get it.
The rule
When a resident individual sells a listed share at a profit, the tax is taken out of the proceeds before the money arrives. The broker's settlement runs through CDS and Clearing, the gain is measured against your recorded cost, the rate is applied and the tax goes to the government. For an individual it is a final tax: nothing more to file, nothing more to pay.
The rate depends on one thing. If you held the share for more than 365 days, you pay 3.75% of the gain. If you held it for 365 days or less, you pay 5%. Companies and other entities pay 10% whatever the holding period. Those are the rates in force since 22 September 2026, when the government published the cut in the Nepal Gazette.
The split by holding period is recent. Until July 2021 there was one rate for individuals, 5%, whether you had held a share for a day or a decade. The budget for FY2078/79 introduced the 365-day line by raising the rate on shorter holdings to 7.5% and leaving longer ones at 5%. That arrangement lasted five years. This year the rates moved twice in ten weeks. The Finance Act raised both to 10% and 7.5% from 17 July. Then the finance ministry's capital market action plan halved both to 5% and 3.75%, from 22 September.
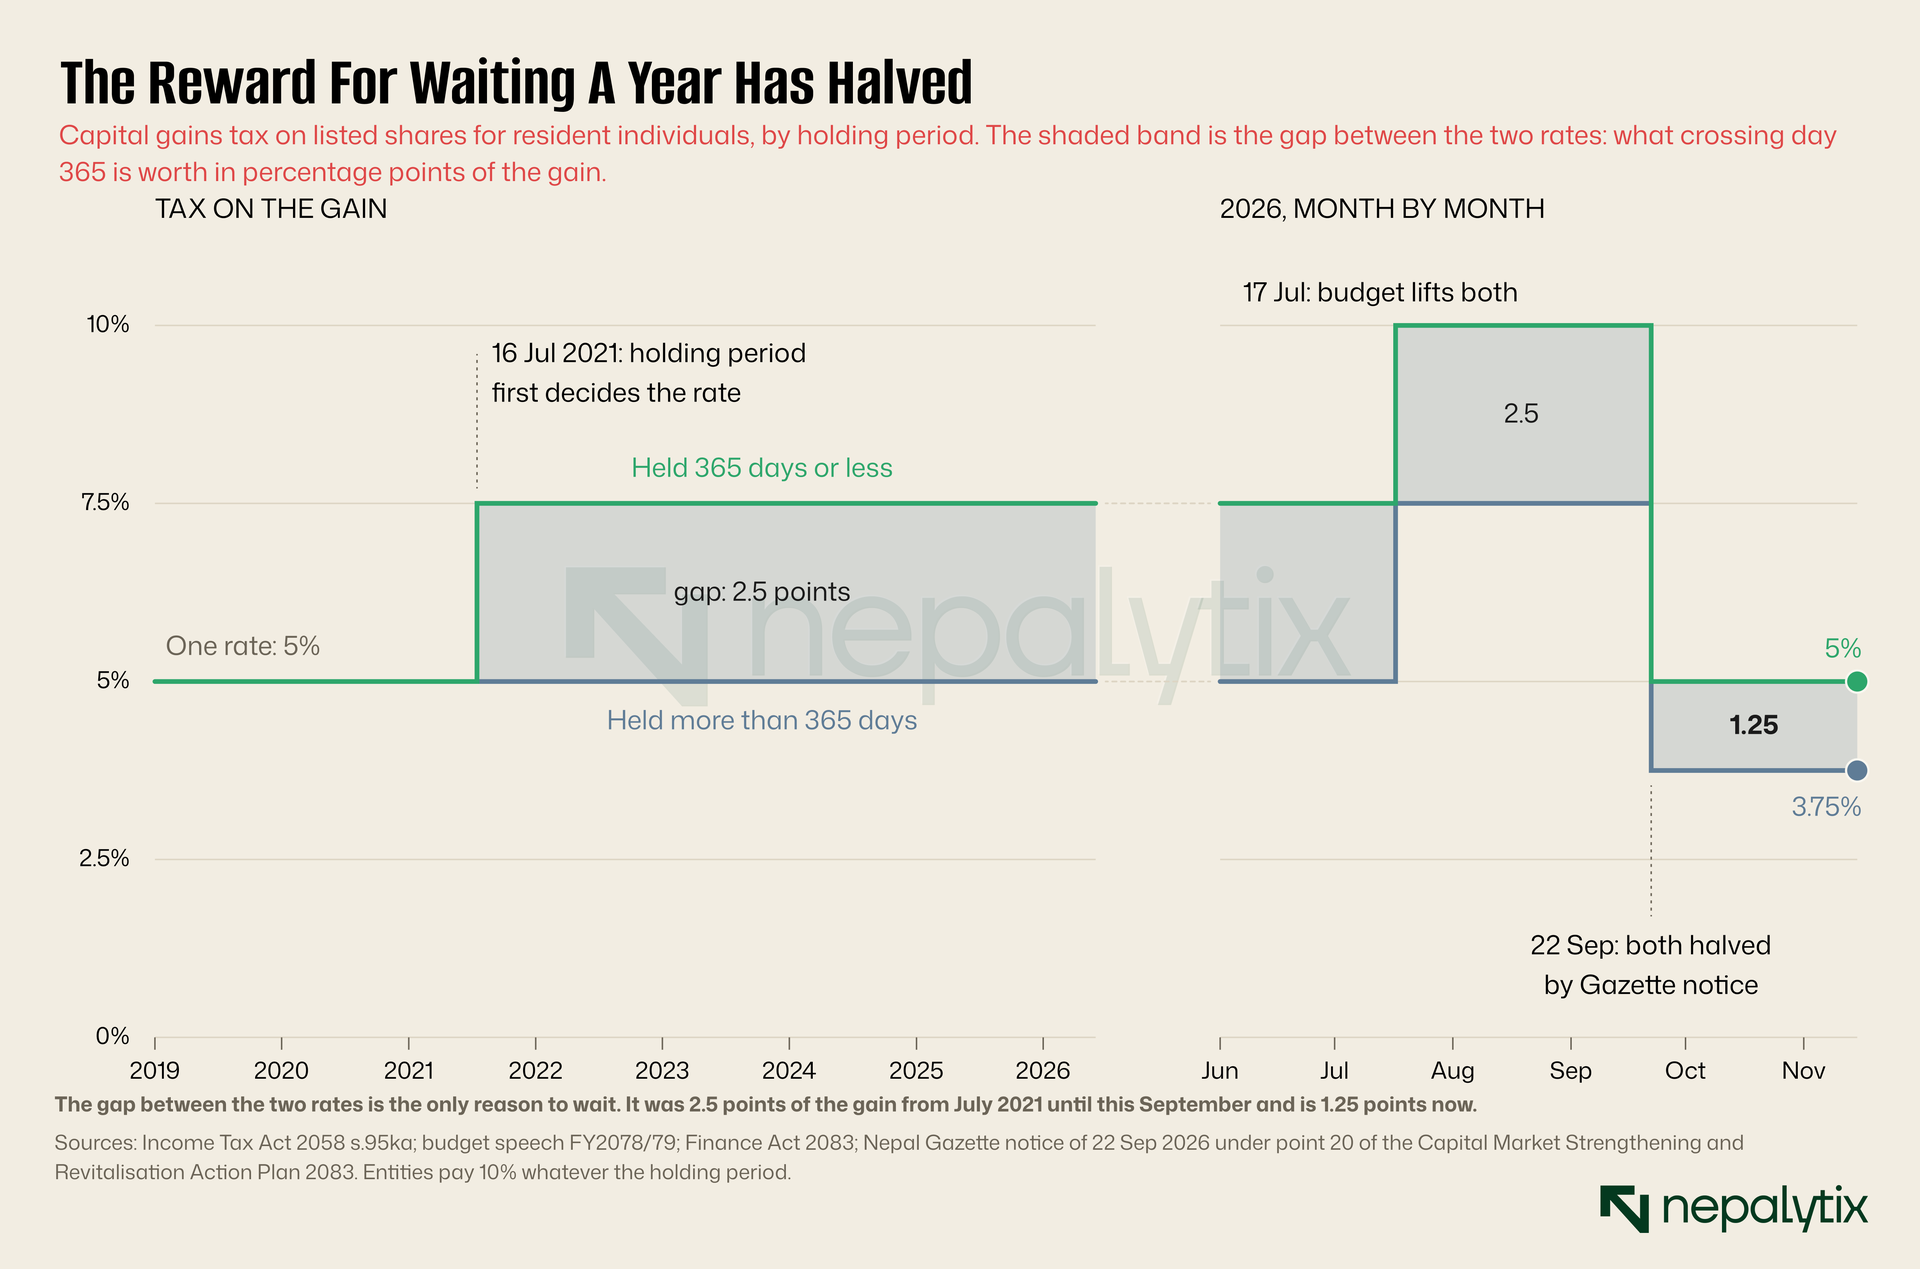
Look at the shaded band in chart above instead of the lines. The band is the gap between the two rates and the gap is the whole of the incentive to wait. For five years it was 2.5 percentage points of the gain. Through this summer's increase it stayed at 2.5. Since September it has been 1.25. The September cut was reported correctly as a tax cut for everyone. It was also a quiet halving of the reward for crossing the line. The folk rule about waiting for the year was formed when the line was worth twice what it is worth today.
For comparison, India taxes short-term gains on listed shares at 20% and long-term gains at 12.5%. That is a gap of 7.5 points, six times Nepal's. An Indian investor near the one-year mark has a real decision to make. A Nepali investor has a much smaller one.
How the days are counted
Three details of the mechanics matter before any arithmetic.
First, the days are calendar days. When the split was introduced in 2021, the guidance was that every day counts from the day of purchase, trading day or not. Saturdays count. Dashain counts. So the line arrives on a date you can read off a calendar and the first sale that qualifies for the lower rate is one made when the holding period shows more than 365. We call that day 366 throughout.
Second, the system counts for you, and its count is the one that matters. MeroShare's "My Purchase Source" section lists each of your purchases in a share with the number of days held. Shares bought on different dates carry different counts. If you bought 100 shares in January and another 100 in June, a sale in February of the following year can be part long-term and part short-term. Read the holding days off the screen before you sell. Do not rely on your memory of when you bought.
Third, the gain is measured against your weighted average cost, the figure MeroShare holds for each share you own and not against the price of the particular lot you think you are selling. Bonus shares pull that average down because they add shares to the count while adding little or nothing to the amount you paid. A holder who has received two or three bonus issues can have a recorded cost far below the price they remember paying, and so a much larger taxable gain than they expect. This matters for our question because the value of the lower rate rises with the size of the gain.
What the line is worth
The saving from waiting is 1.25% of the gain. That sentence is where most people stop and it is why the line feels more valuable than it is. You do not own a gain. You own a position, and the gain is only part of it.
Take a holder who bought 500 shares at Rs 400 and watches them trade at Rs 520. The position is worth Rs 260,000. The gain is Rs 60,000. Sold today, the tax is 5% of that, Rs 3,000. Sold after day 365 at the same price, the tax is Rs 2,250. Waiting saves Rs 750.
Rs 750 on a holding of Rs 260,000 is 0.29%. Put differently: if the share slips from Rs 520 to Rs 518.44 while this holder waits, the entire saving is gone. A fall of Rs 1.56 a share.
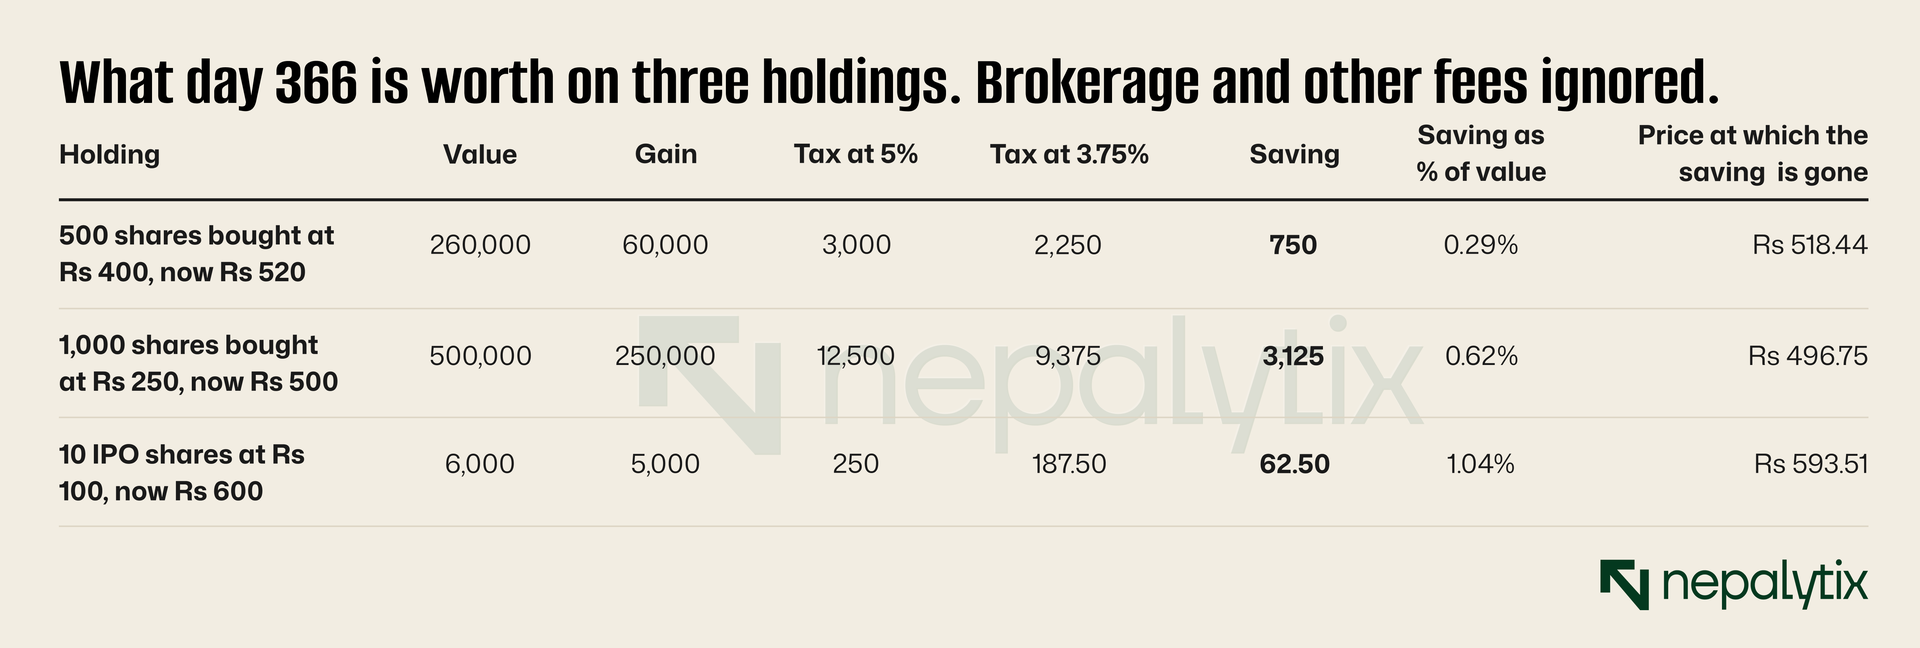
The table shows why the size of the gain matters and why it stops mattering. The bigger the gain as a share of the position, the more the lower rate is worth. But there is a ceiling. Even if your cost were zero and the whole position were gain, the saving could not exceed 1.25% of the position and a fall of 1.30% would cancel it. The third row, an IPO allottee whose share trades at six times its issue price is already close to that ceiling. The saving there is Rs 62.50.
Now set that against how NEPSE shares actually move. Across 246 ordinary shares since July 2021, the median daily move in a share's closing price, up or down is 1.21%. For the Rs 520 share that is Rs 6.29 in a day, four times the Rs 1.56 that erases a year-end tax saving.
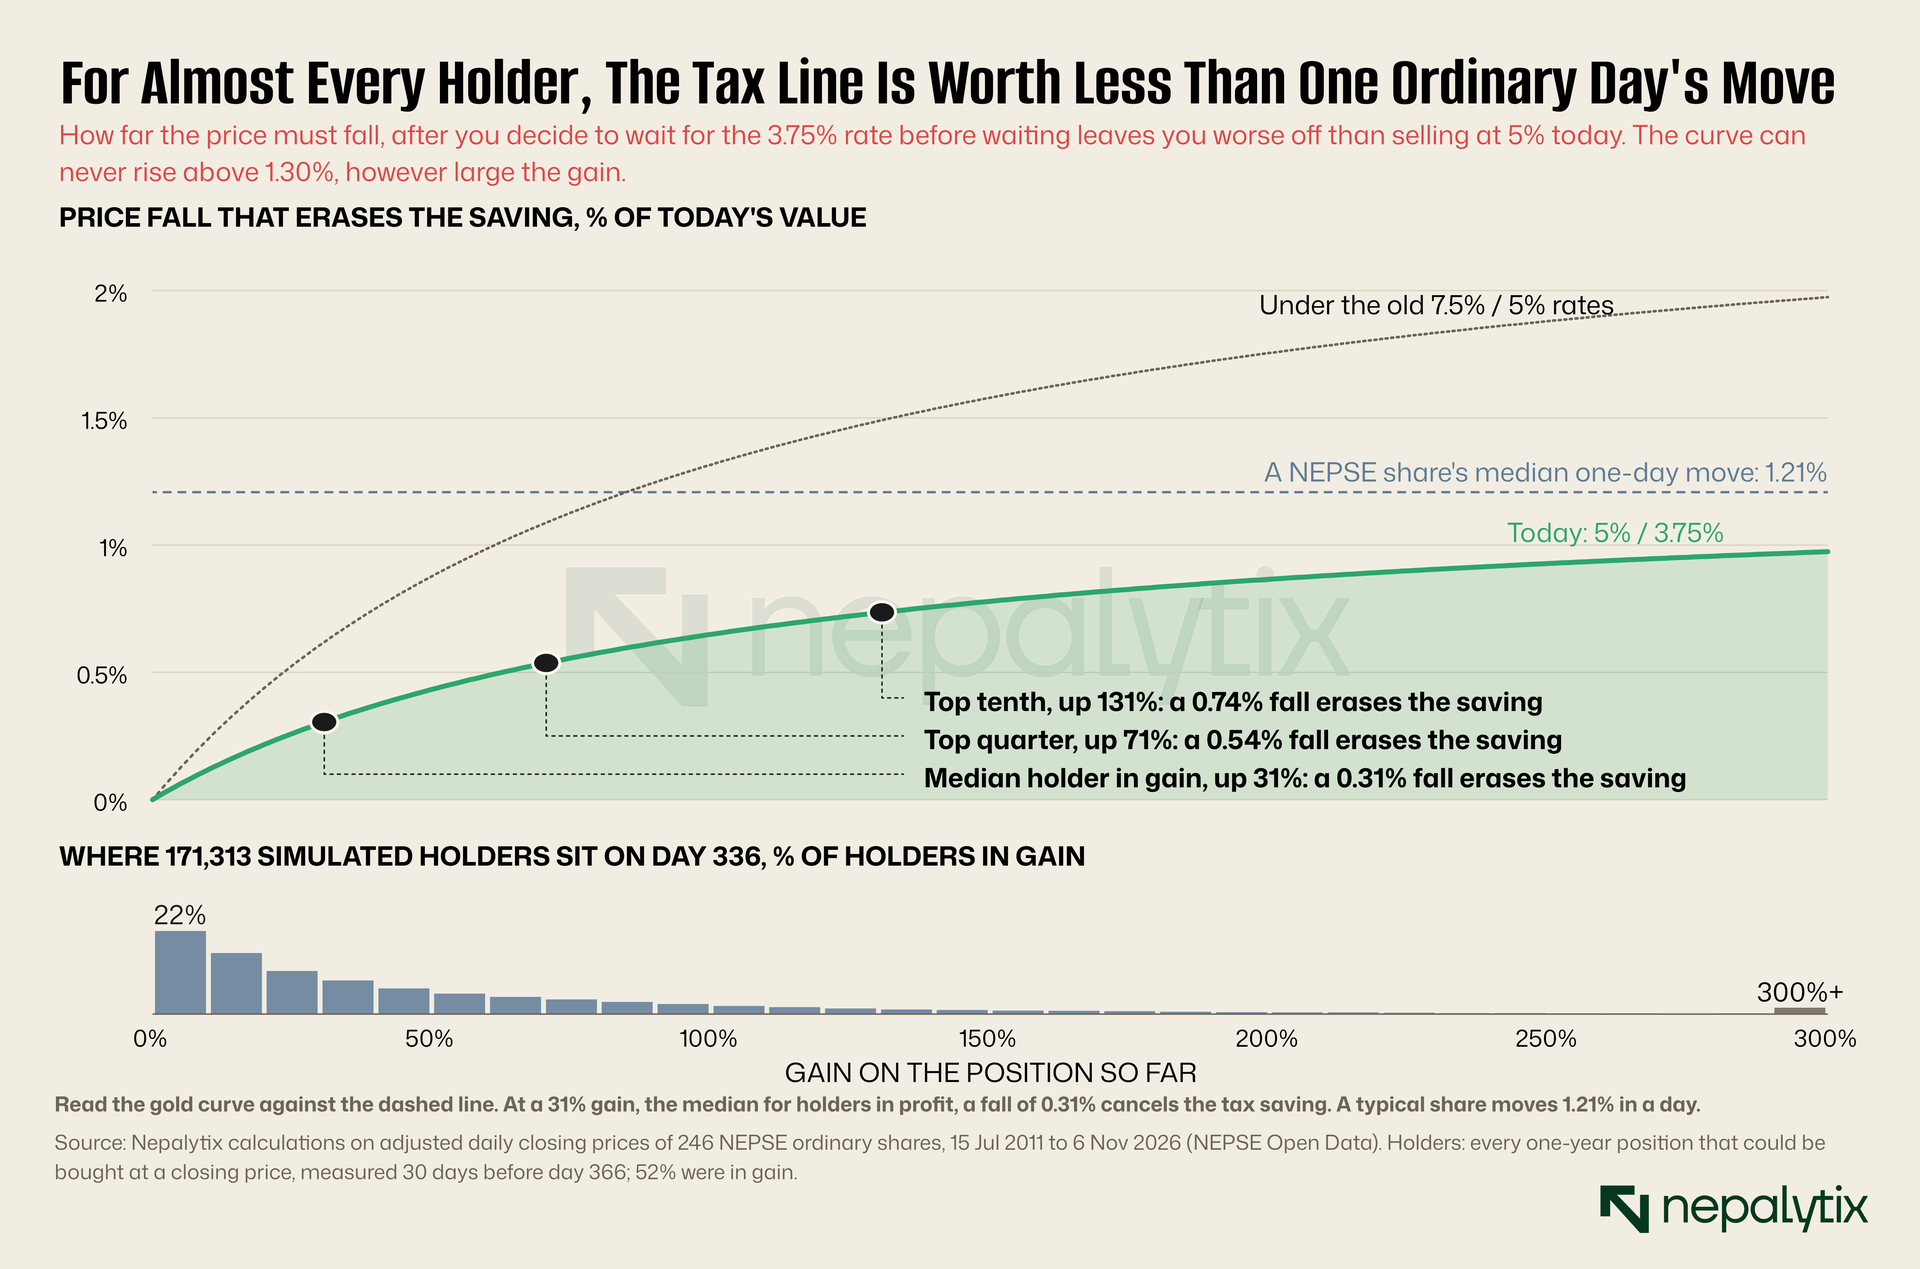
Chart 2 puts the two on one scale. The green curve is the fall that wipes out the saving at every size of gain. The dashed blue line is one ordinary day. The curve stays under the line across the whole chart. It crosses only when the gain reaches about 1,360%, which is to say for almost nobody.
The bars at the bottom show where holders really sit. We built every one-year position that could have been bought at a closing price over fifteen years, 328,915 of them, and looked at each one 30 days before its day 366. Just over half, 52%, were in profit. The other 48% were under water and had no gains tax to think about at all. Among those in profit, the median gain was 31%. A quarter were up more than 71% and a tenth more than 131%. For the median holder the saving is 0.29% of the position. For three holders in four it is under half a percent. For one in two hundred it is more than 1%.
There is a second cost that never appears in the tax arithmetic: time. The holder in our example who sells today has about Rs 257,000 in hand a month earlier than the holder who waits. At the roughly 3.3% that commercial banks were paying on deposits in the middle of this year, a month's interest on that sum is about Rs 700. The tax saving was Rs 750. An ordinary savings account very nearly pays for the tax.
What the price does while you wait
A small certain saving would still be worth collecting if nothing else happened while you waited. Something else always happens. The share keeps trading.
For every simulated holder in profit, we measured the change in price between the day of decision and the first trading session after day 365. We did this for waits of one day up to 120 days.
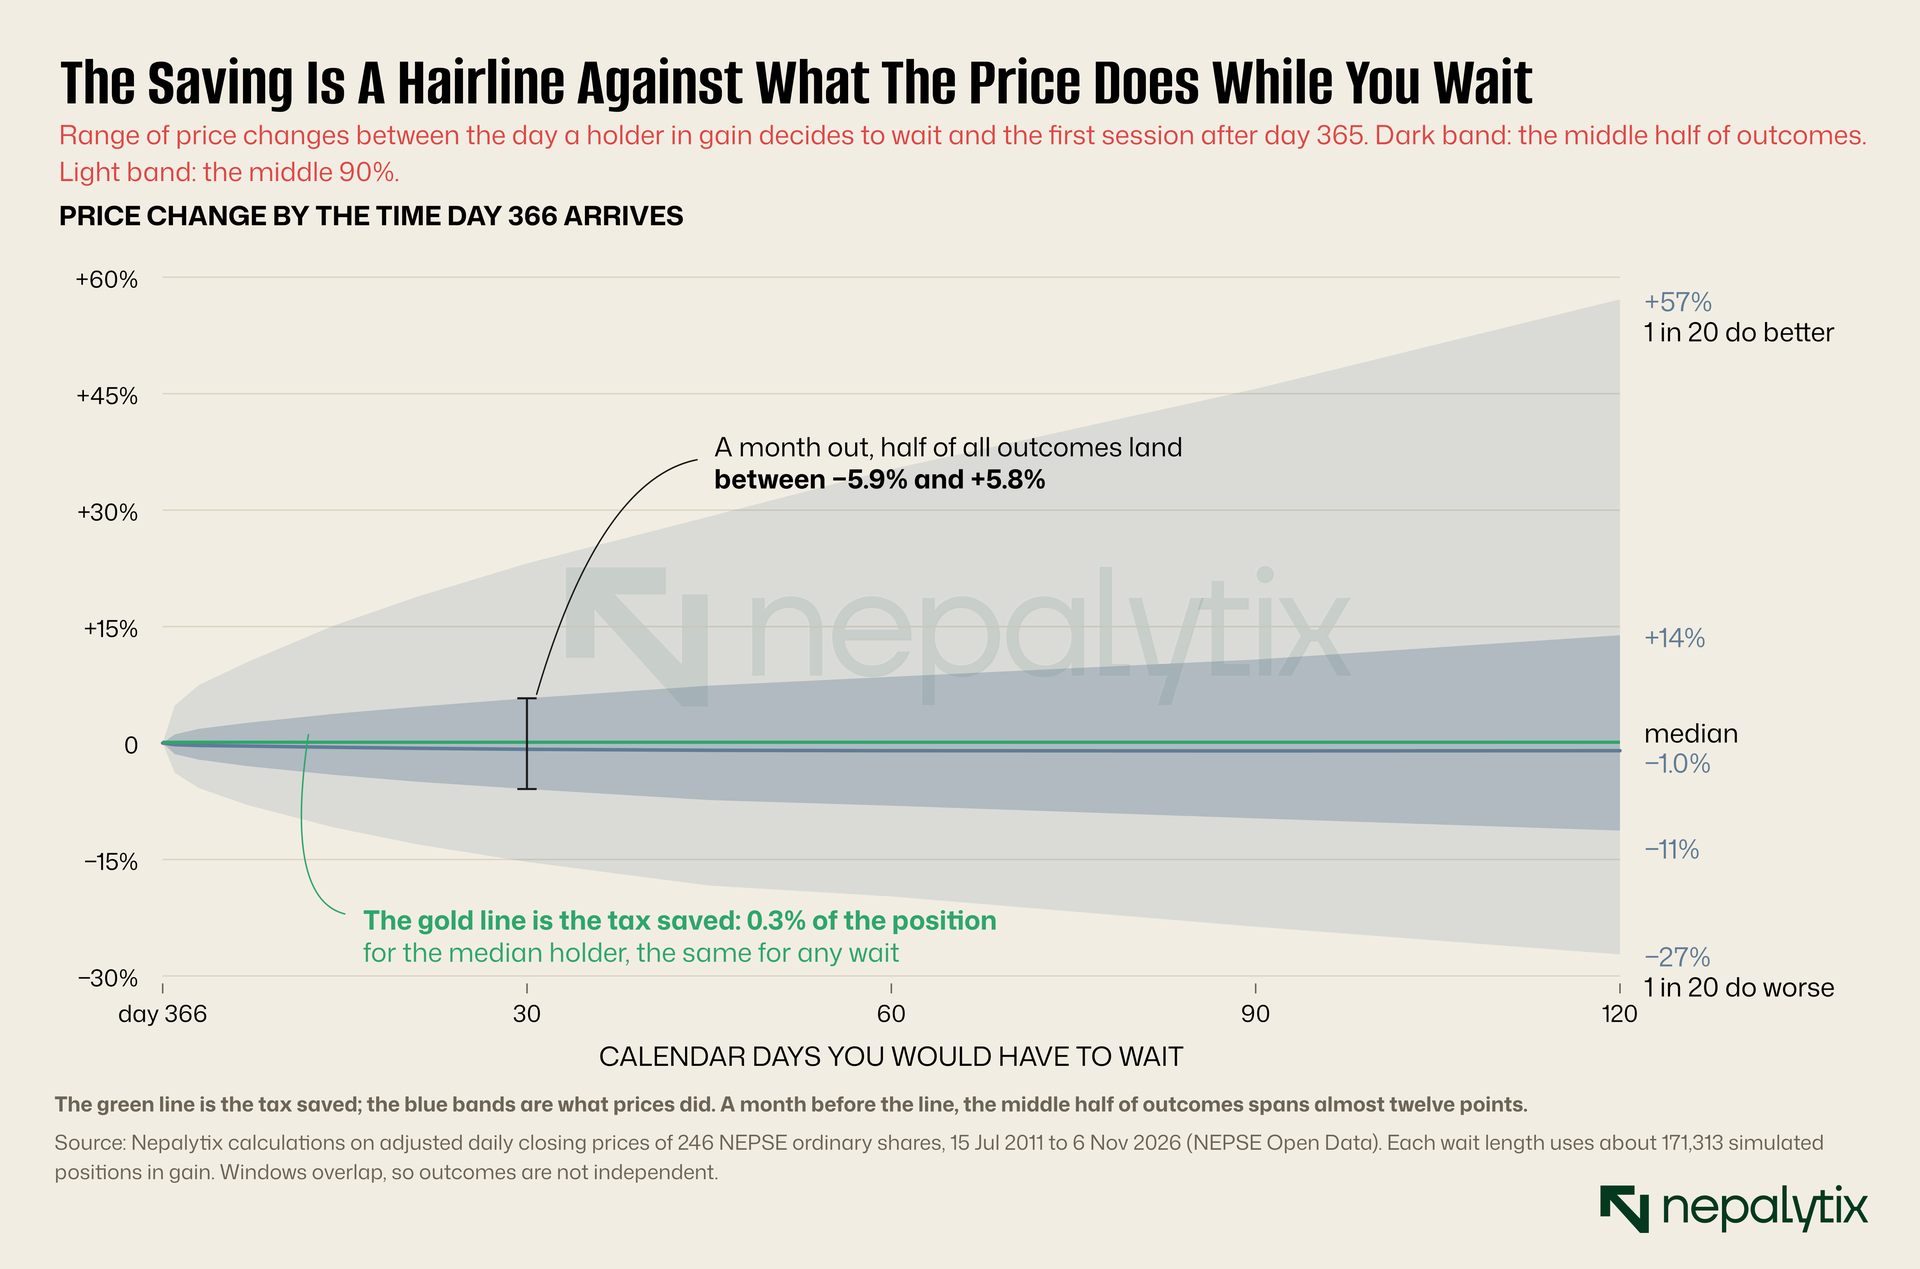
The green line in Chart 3 is the tax saving for the median holder, drawn to the same scale as everything else. It is there. You have to look for it. Around it is what the price did. A month from the line, half of all outcomes fell between a loss of 5.9% and a gain of 5.8%. One holder in twenty lost more than 15% and one in twenty gained more than 23%. Four months from the line, the middle half of outcomes ran from −11% to +14% and the outer twentieths were beyond −27% and +57%.
The typical move over that final month, in either direction was 5.9% of the position. The typical tax saving was 0.29%. The price risk a holder takes on to collect the saving is twenty times the saving.
Notice also where the middle of the fan sits. The median outcome is slightly below zero at every horizon: −0.8% over the last month, −1.0% over four months. That is not something peculiar to shares that have gone up. It is how NEPSE shares behave in general. Over any month in our data, the typical share fell more often than it rose: only 44.5% of all one-month windows ended higher. The average change over the same windows was positive, +0.7%, because the minority of large gains outweigh the majority of small losses. A few shares do very well and most drift. A holder who waits is buying a ticket in that distribution, and the tax saving is a small discount on the ticket.
The odds
So does waiting pay? We compared two versions of each holder. One sells on the decision day and pays 5%. The other waits for day 366 and pays 3.75% on whatever gain is left, or nothing if the gain has gone. Then we counted how often the second ended with more money.
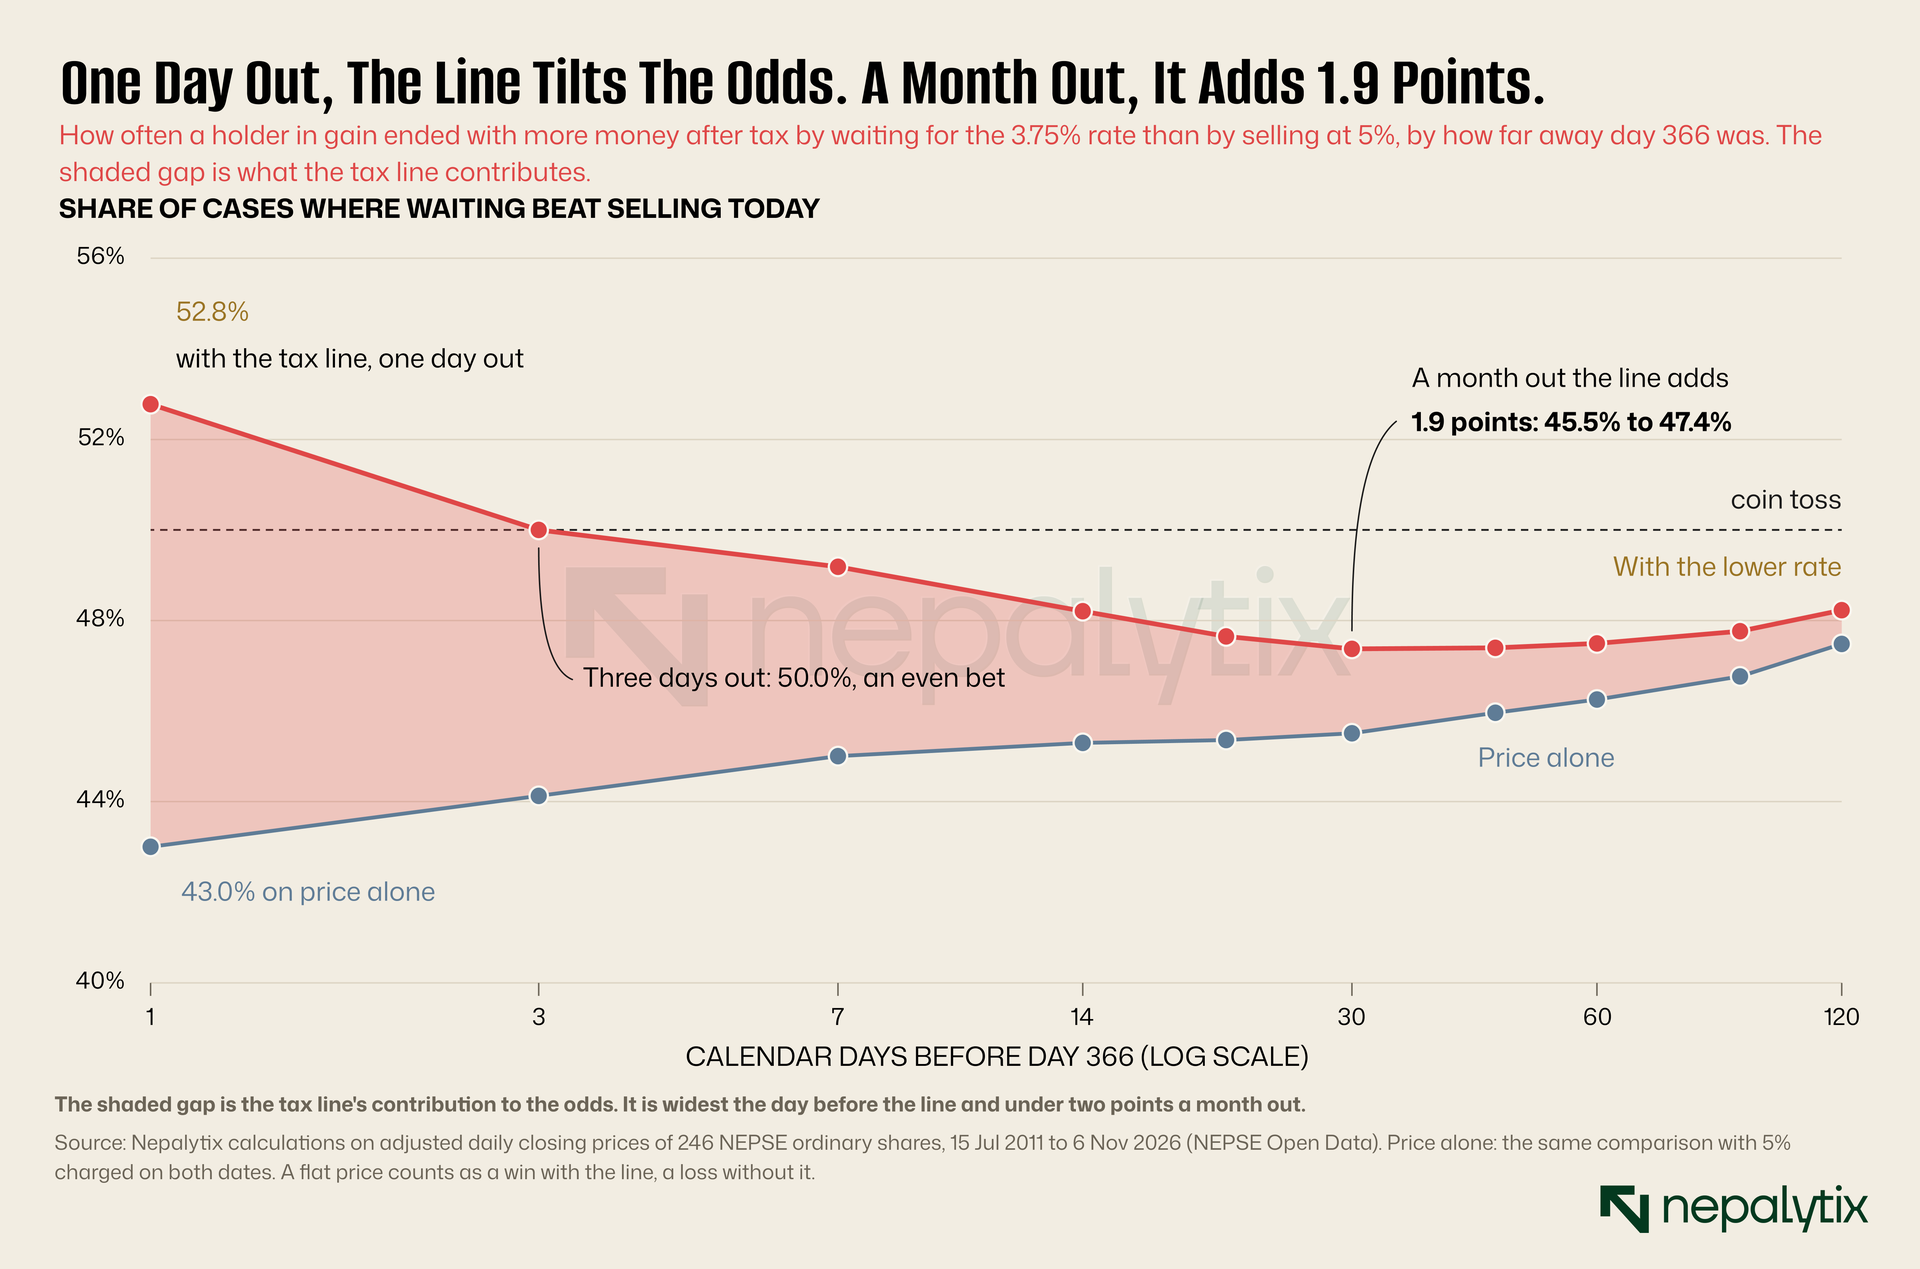
One day from the line, waiting wins 52.8% of the time. That is the tax line at its most powerful. On price alone, a single day is slightly more likely to be down than up and waiting would win only 43.0% of the time. The lower rate turns enough small losses into small wins to add almost ten points.
The effect fades fast. Three days out, waiting wins exactly half the time. A week out, 49.2%. A month out, 47.4% against 45.5% on price alone. The line is still helping, but by 1.9 points and the holder who waits a month is worse off after tax in 52.6% of cases. By four months the line adds less than a point.
Under the old rates the same test gives the line 3.4 points at one month instead of 1.9. The halving in Chart 1 shows up here as a halving of the edge.
Two things have to be said about that 47.4% because it would be easy to read it as "waiting loses".
The first is that the average outcome of waiting is positive. Averaged over all holders, the one who waited a month ended up 1.26% of the position better off than the one who sold about 0.3 points of that from tax and the rest from the market's long upward drift. The median holder ended 0.5% worse off. Both figures are true. A few large winners carry the average and most holders are not among them.
The second is that the tax saving is real in every single case. Whatever the price does, the holder who crosses the line pays a quarter less tax on whatever gain remains. Waiting is never made worse by the tax. It is made better by a small, fixed amount and that amount is too small to change the result very often.
Put the two together and the right reading is this. Whether waiting works out depends almost entirely on what the share does. The line moves the odds by a couple of points. If you would be happy to own the share for another month at today's price, the lower rate is a modest bonus for doing what you were going to do anyway. If you want out and the only thing keeping you in is the calendar, you are taking a 6% risk to collect 0.3%.
The year, not the tax
If the line barely moves the odds, what does? The market you happen to be in.
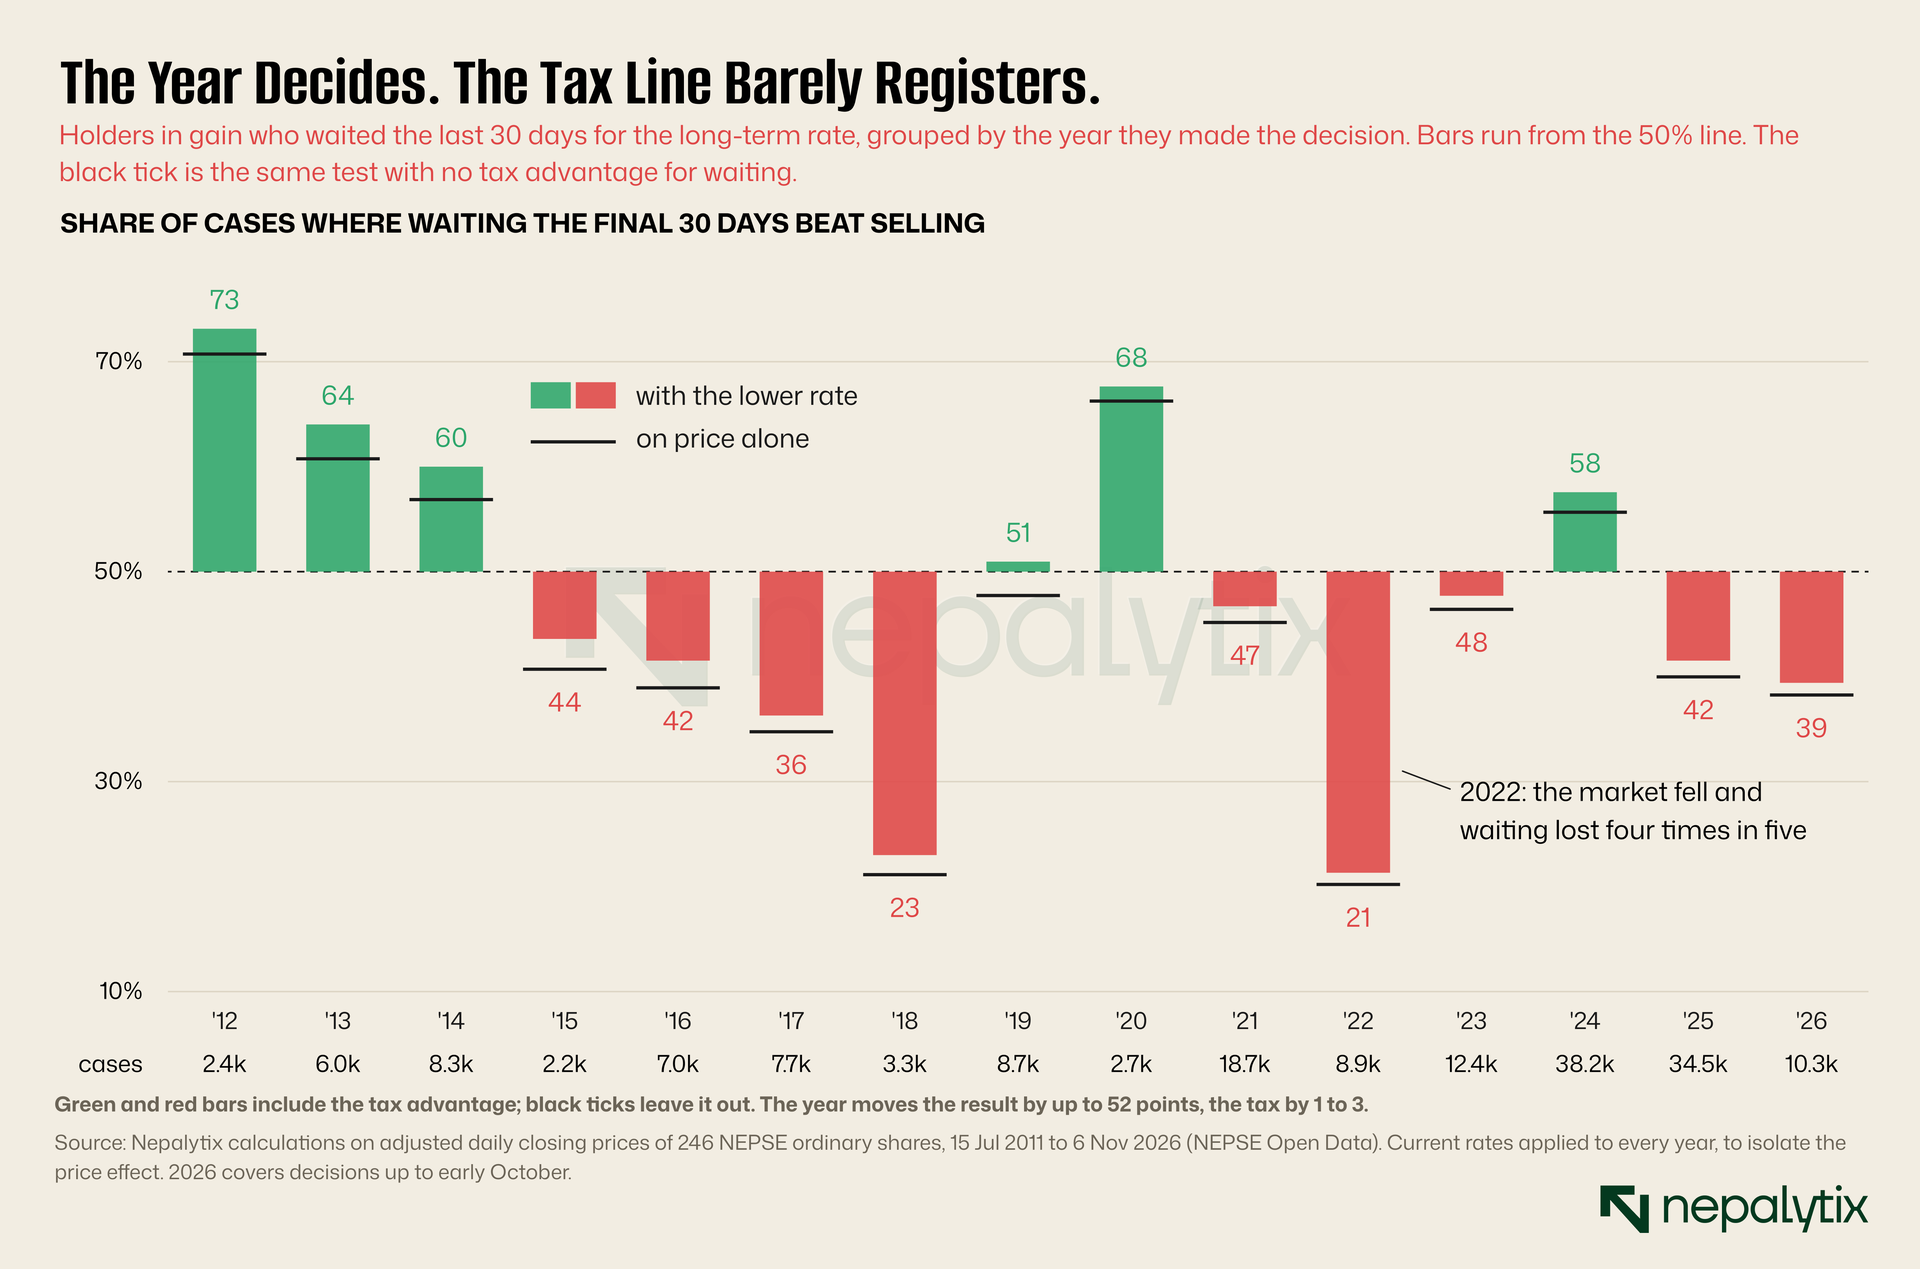
Chart 5 repeats the one-month test separately for each year. In 2012, when the market was climbing out of a long slump, waiting the last month beat selling 73% of the time. In 2020 it was 68%. In 2018 it was 23%, and in 2022, as the index gave back the gains of the pandemic boom, 21%. The spread from best year to worst is 52 points.
The black ticks show the same test with the tax advantage removed. In every year the tick sits just below the end of the bar. The difference between them, the contribution of the tax line, ranges from 1.1 points to 3.3 points. Only once, in 2019, was that enough to carry the result across the 50% line from 47.7% to 51.0%. In the other fourteen years the lower rate left a winning bet winning and a losing bet losing.
This is the cleanest way to see what the 365-day rule is. It is a small, steady nudge applied to a decision whose outcome is decided elsewhere. A holder who waited in 2022 because of the tax line lost money four times in five and the tax break softened the loss by a fraction. A holder who waited in 2024 mostly did well and would have done nearly as well with no tax break at all.
The rule that would matter more
The same action plan that cut the rates contains a second promise, in the same numbered point, that has had far less attention. It says the government will study and arrange for losses on listed shares to be set against gains on listed shares within the same income year with the netting done inside the trading and settlement system so that tax falls only on the net gain.
That is not how it works today. Today each profitable sale is taxed on its own. A loss on another share, sold the same week reduces your wealth and does nothing to your tax. An investor who makes Rs 100,000 on one share and loses Rs 100,000 on another has made nothing and pays Rs 5,000.
How much would netting be worth? We cannot see real portfolios so here is an illustration from the same simulated holdings: equal-sized positions, each held for a year and a day, grouped by the fiscal year in which they were sold.
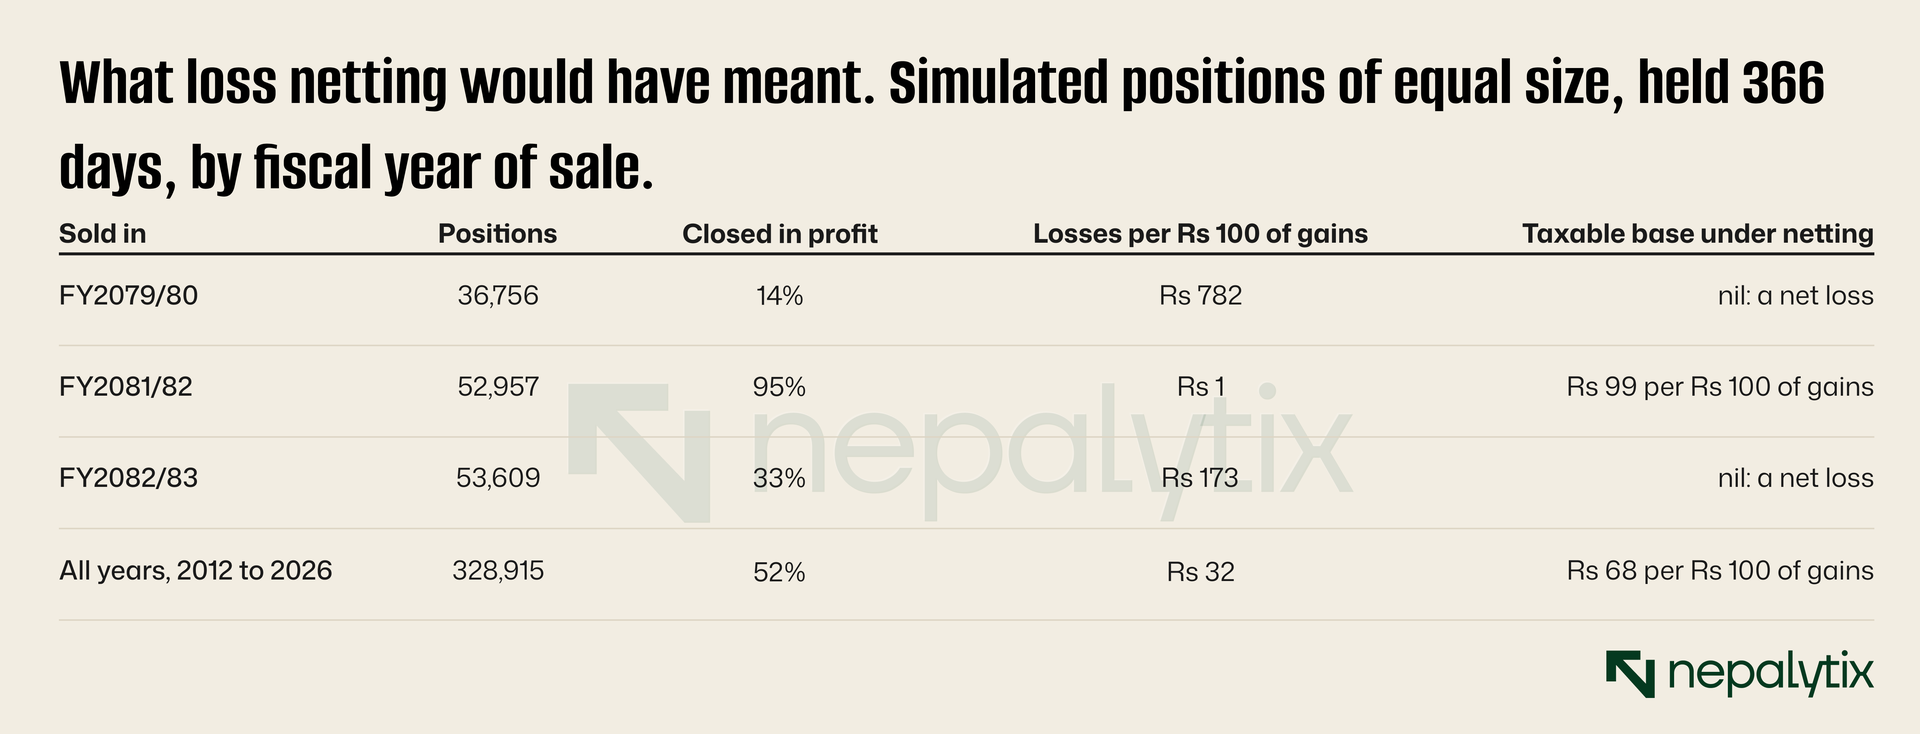
Across all fifteen years, for every Rs 100 of gains there were Rs 32 of losses. A holder with an evenly spread book would, on average, have seen the taxable base shrink by about a third under netting. The 365-day line takes a quarter off the tax and only on holdings that cross it. Netting would take a third off the base, on everything.
The averages hide the point, though. In a good year like FY2081/82, almost every one-year position was a winner and netting would have changed nothing. In FY2082/83, the year that ended in July, two positions in three closed at a loss, and losses were Rs 173 for every Rs 100 of gains. An evenly spread holder made a net loss that year and, under today's rules, paid tax anyway on each winner. Netting matters most in exactly the years when investors can least afford the tax.
The plan says "study and arrange". It has no date we could find, and as of this week nothing has changed in how settlement computes the tax. Until it does, the practical lesson is narrow: a loss you realise this year will not reduce the tax on a gain you realise this year, so there is no tax reason to sell a loser.
Does a big gain change the answer?
There is one argument for waiting that we have not yet tested. A share that is up 150% in eleven months has momentum, the argument goes. It is more likely to keep rising. And since the tax saving is larger on a large gain, the case for holding on is strongest precisely for the big winners.
The second half is true and we have already measured it. The saving rises with the gain, up to its ceiling of 1.25% of the position. The first half is a claim about prices and the data do not support it.
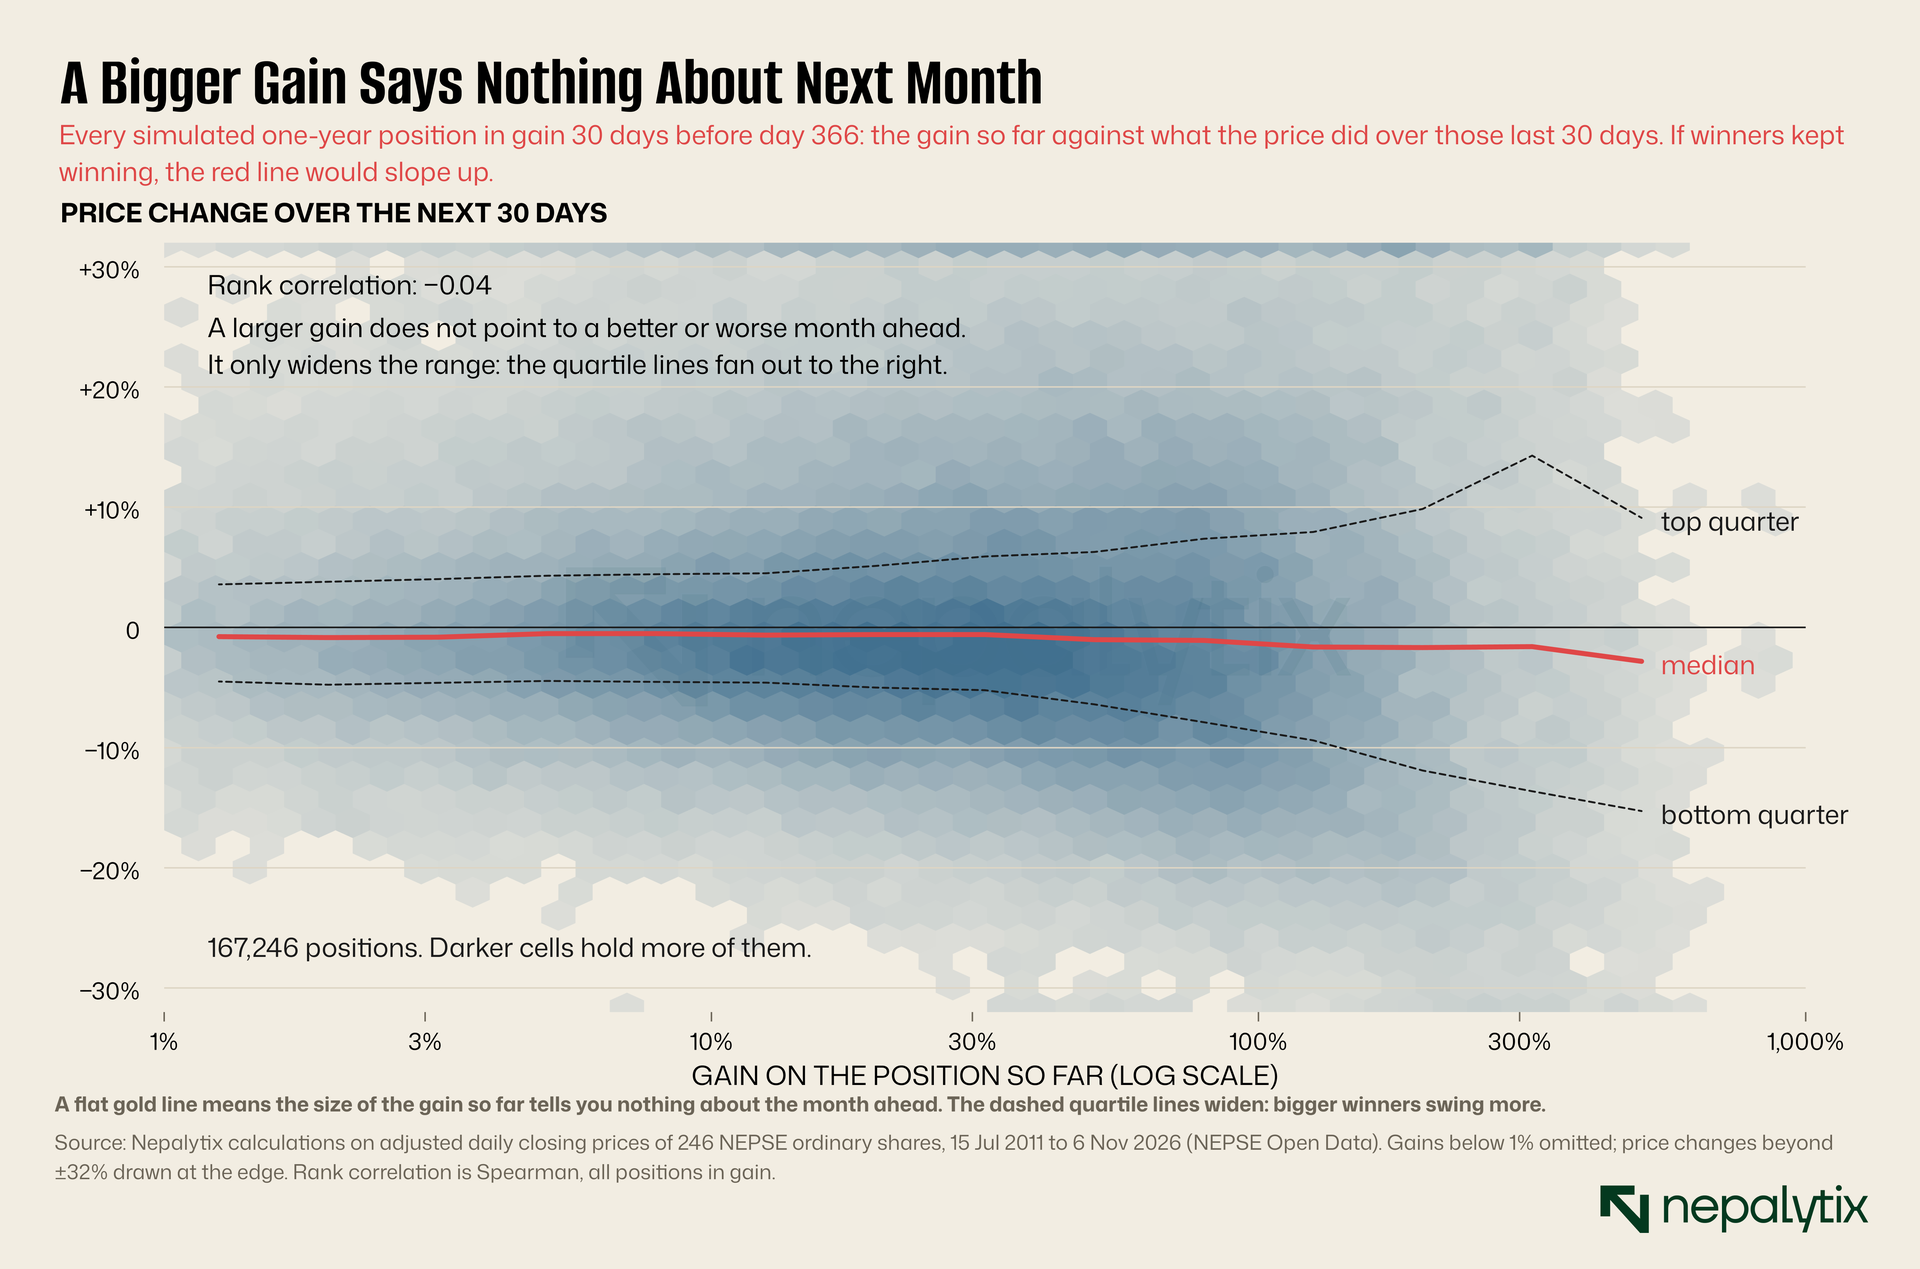
Each cell in Chart 6 collects simulated holders by how much they were up a month before the line and what the share did in that last month. If big winners kept winning, the dark mass would tilt upward to the right and the gold median line would climb. It does not. The rank correlation between the gain so far and the change over the next month is −0.04 which is as good as zero. If anything the median sags: holders up between 0 and 10% saw a median change of −0.6% in the final month and holders up more than 200% saw −2.3%.
What does change with the size of the gain is the spread. For the small winners, the middle half of outcomes ran from −4.5% to +4.1%. For those up more than 200% it ran from −13.6% to +11.9%. Shares that have tripled are volatile shares. So the holder with the biggest gain has the biggest tax saving on offer, about 0.9% of the position and is exposed to price swings three times as wide while waiting for it. The ratio of risk to reward is no better at the top than in the middle.
How to use this
Here is the whole analysis reduced to what you would do with a holding in front of you.
Work out the saving in rupees. Take your gain as MeroShare will measure it, sale value less your recorded average cost and multiply by 1.25%. That is what day 366 is worth. Then divide it by the value of the position. For most holders the answer is between 0.1% and 0.5%. If you know the number, you will not overvalue it.
Count the days on the screen. Check the holding days for each purchase lot in MeroShare. If the lot you care about is within a day or two of the line and you have no urgent reason to sell, wait. That is the one range in which the odds are on your side, and the price risk over a single session is small. Selling on day 365 by accident is the one clear mistake in this whole subject.
Beyond a week, ignore the line. Ask instead whether you would buy this share today, at this price, for the period in question. If yes, hold, and take the lower rate as a small bonus when it comes. If no, sell, and pay the extra 1.25% of the gain as the price of getting out when you wanted to. In our data a holder who waited a month against their own judgment was taking a typical swing of 6% in either direction to save a third of one percent.
Remember what the money could do instead. Proceeds from a sale today earn interest, or go into a share you prefer. A month of deposit interest at current rates is roughly the size of the tax saving on a typical gain. Any better use of the money beats it.
Do not let the line stop you taking a profit in a falling market. The year-by-year record is blunt about this. In the bad years, waiting for the line lost most of the time and the tax break recovered a sliver of the loss.
Check your recorded cost before you sell anything. The tax is computed on the cost MeroShare holds. If you have bonus shares, or purchases that were never recorded properly, the figure may be wrong in either direction. A wrong cost will move your tax by far more than the gap between 5% and 3.75%.
What we cannot see
Everything above is built on simulated holders and it is worth saying why. The real answer exists. Every sale of a listed share by an individual passes through one settlement system which records the holding period and the tax taken. CDS and Clearing knows how many sales crossed day 365 last month and how many fell short by a week. It knows whether selling bunches up just after the line. What is published is one number, the total gains tax collected. In the first two months of this fiscal year that total fell 54% from the Rs 2.76 billion of a year earlier, even though the rates had just been raised.
A split of that total between short-term and long-term sales, month by month, would show whether the 365-day rule changes how Nepalis invest or merely changes what they pay. The rule was introduced in 2021 to reward long-term holding. Five years on, nobody outside the settlement system can say whether it has. The number is collected with every trade and required of nobody.
Until it is published, the price record is the best evidence there is. The record says the line is worth a third of one percent to the typical holder, less than a day's trading, and that a month from the line it changes the result of waiting about one time in fifty. Collect it when it is within reach. Do not hold a share for it.
Disclaimer
This report has been prepared by Nepalytix for informational and educational purposes only and does not constitute investment advice, an offer, or a solicitation to buy or sell any securities.
The information contained in this report is based on sources believed to be reliable; however, Nepalytix does not guarantee its accuracy, completeness, or timeliness. Opinions, estimates, and projections expressed herein are those of the authors as of the date of publication and are subject to change without notice.
Investing in securities involves risks, including the possible loss of principal. Past performance is not indicative of future results. Readers are advised to conduct their own independent research and consult with a qualified financial advisor before making any investment decisions.
Nepalytix and its contributors may hold positions in the securities discussed in this report at the time of publication or thereafter.
Neither Nepalytix nor any of its affiliates accept any liability for any loss arising from the use of this report or its contents.