How to read a Nepali bank's annual report
Most investors stop at net profit, EPS, and dividend announcements. The real story sits deeper inside a bank's annual report
Quarterly profit numbers tell you almost nothing. Here is what the audited annual report tells you page by page using Nabil Bank's FY 2081/82 report as the worked example.
Every August or September a Nepali commercial bank publishes its annual report and every August or September the financial press reduces it to two sentences. Net profit was up or down by some percentage. EPS was Rs something. The dividend was Rs something else. The headline reads. Nobody opens the actual document. Most readers never see the audited financial statements, never read the auditor's opinion, never look at the notes which is where everything that matters actually sits.
This piece is about how to read that document. Not how to read it perfectly. How to read it well enough to know whether the headline number is telling you the truth.
We are going to walk through Nabil Bank's audited FY 2081/82 report section by section. Nabil's report is a good teaching example because it is one of the cleaner ones in the sector, the bank is large enough that every component matters and the financial statements run to several hundred pages of notes that the headlines never touch. By the time we finish, you should be able to open any commercial bank's annual report and know where to look first, what to compare it against and what a careful reader would notice that a casual one wouldn't.
The audited annual report is the single most important document a listed bank publishes in any given year. Quarterly disclosures are unaudited. Press releases are summaries. The audited annual report is the version that the bank's auditors have signed off on that NRB has reviewed, that the AGM has approved, and that becomes the legally binding record of what the bank actually earned and what it actually owns. If you want to understand a Nepali banks, this is the document.
Start with the income statement, not the headline
Nabil's FY 2081/82 net profit was Rs 7.13 billion, up 15.01 percent from Rs 6.20 billion the year before. That is the number that gets quoted. It is also the number that tells you the least.
The reason it tells you the least is that net profit is the end of a long chain of additions and subtractions, any one of which can move significantly while the others compensate. A bank can have a great year on lending and a terrible year on trading and end up looking exactly the same as a bank that had the opposite outcome. The two banks are running completely different risks. Net profit hides that.
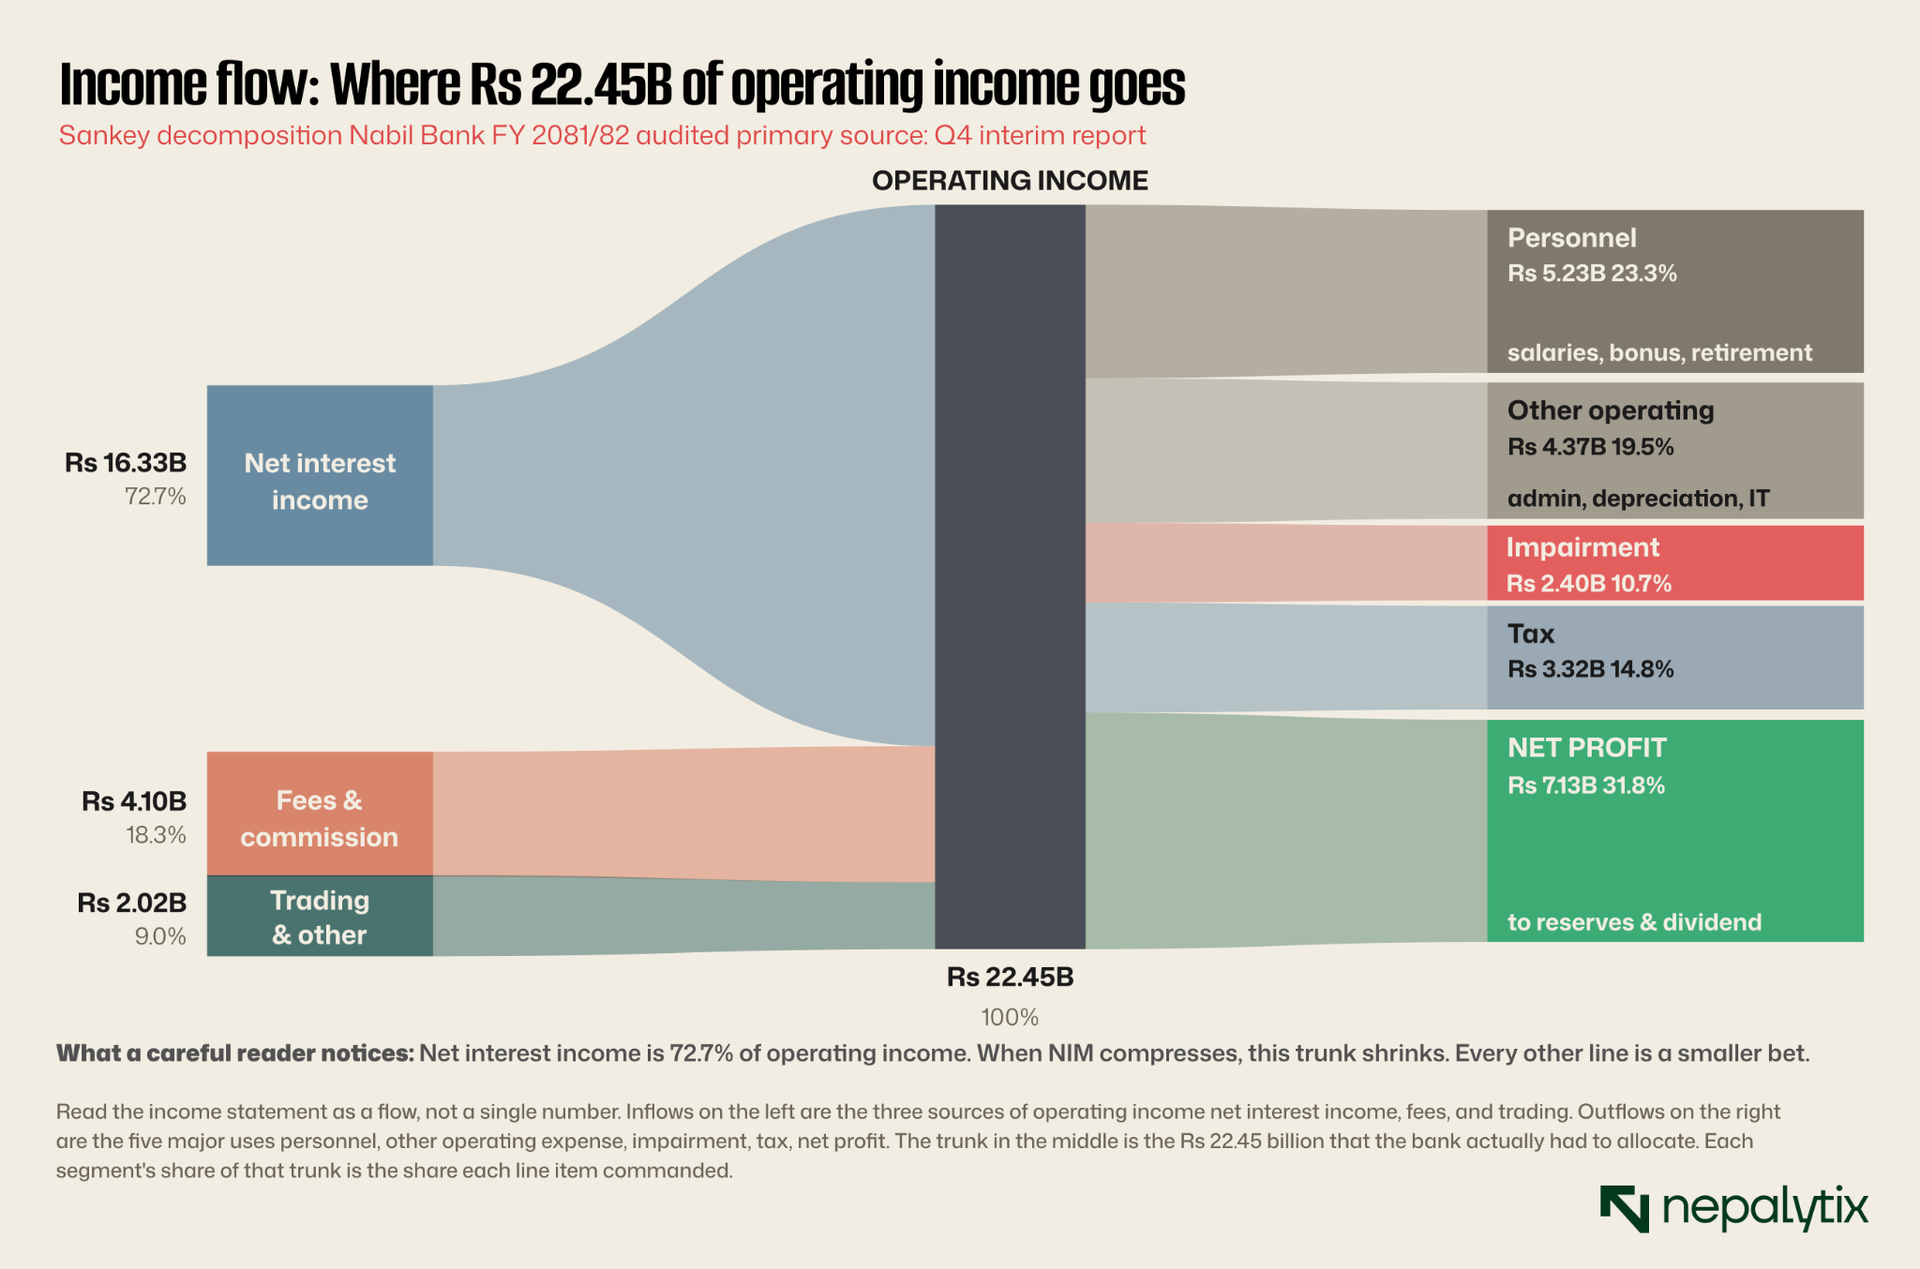
So the first thing to do, before reading any other number is to open the income statement and trace where the profit actually came from. The income statement of a Nepali commercial bank in NFRS format runs roughly like this. Interest income, less interest expense, equals net interest income. Add fee and commission income, less fee and commission expense equals net interest and fee income. Add net trading gains, add other operating income and you have total operating income. Subtract personnel expenses, other operating expenses, depreciation and impairment charges. That gives you operating profit. Subtract tax. That gives you net profit.
Each of those lines is a different bet. Net interest income is the bank's core spread business: what it earns on loans minus what it pays on deposits. Fee income is the recurring service business remittance, trade finance, card fees, ATM fees. Trading gains are typically FX-driven and lumpy. Impairment is where loan losses get recognized. Tax depends on accounting choices.
For Nabil's FY 2081/82, the four numbers a careful reader pulls out first are these: net interest income Rs 16.33 billion (essentially flat year on year), impairment charges Rs 2.40 billion (down 48.30 percent from Rs 4.64 billion the previous year), personnel expenses Rs 5.23 billion (up 12.17 percent), and operating profit Rs 10.85 billion (up 25.44 percent).
Notice the pattern. Net interest income did not grow. But operating profit jumped 25 percent. The difference is impairment :Nabil booked less than half the loan-loss provision it booked the year before. That single line did most of the work. If you read the press headline that net profit was up 15 percent, you would not know that. If you trace the income statement, you cannot miss it.
The provisioning page is where the truth sits
The next thing to do after reading the income statement is to turn straight to the provisioning disclosure. This is the page that tells you whether the bank is recognizing its losses honestly or pushing them into the future. It is also the page that the headline coverage usually skips.
Provisioning means setting aside a portion of profit today to cover loans that may go bad tomorrow. Every commercial bank has to do this. The question is how much, against what assets, and on what basis.
Translation
Impairment charge and loan-loss provision are the same thing as the amount the bank set aside this year to cover expected loan losses. Specific provision is set against loans the bank has already classified as non-performing. General provision is set against the rest of the loan book at NRB's regulatory floor on performing exposures. ECL means Expected Credit Loss, the forward-looking provisioning model under NFRS 9 that the entire sector is currently transitioning to.
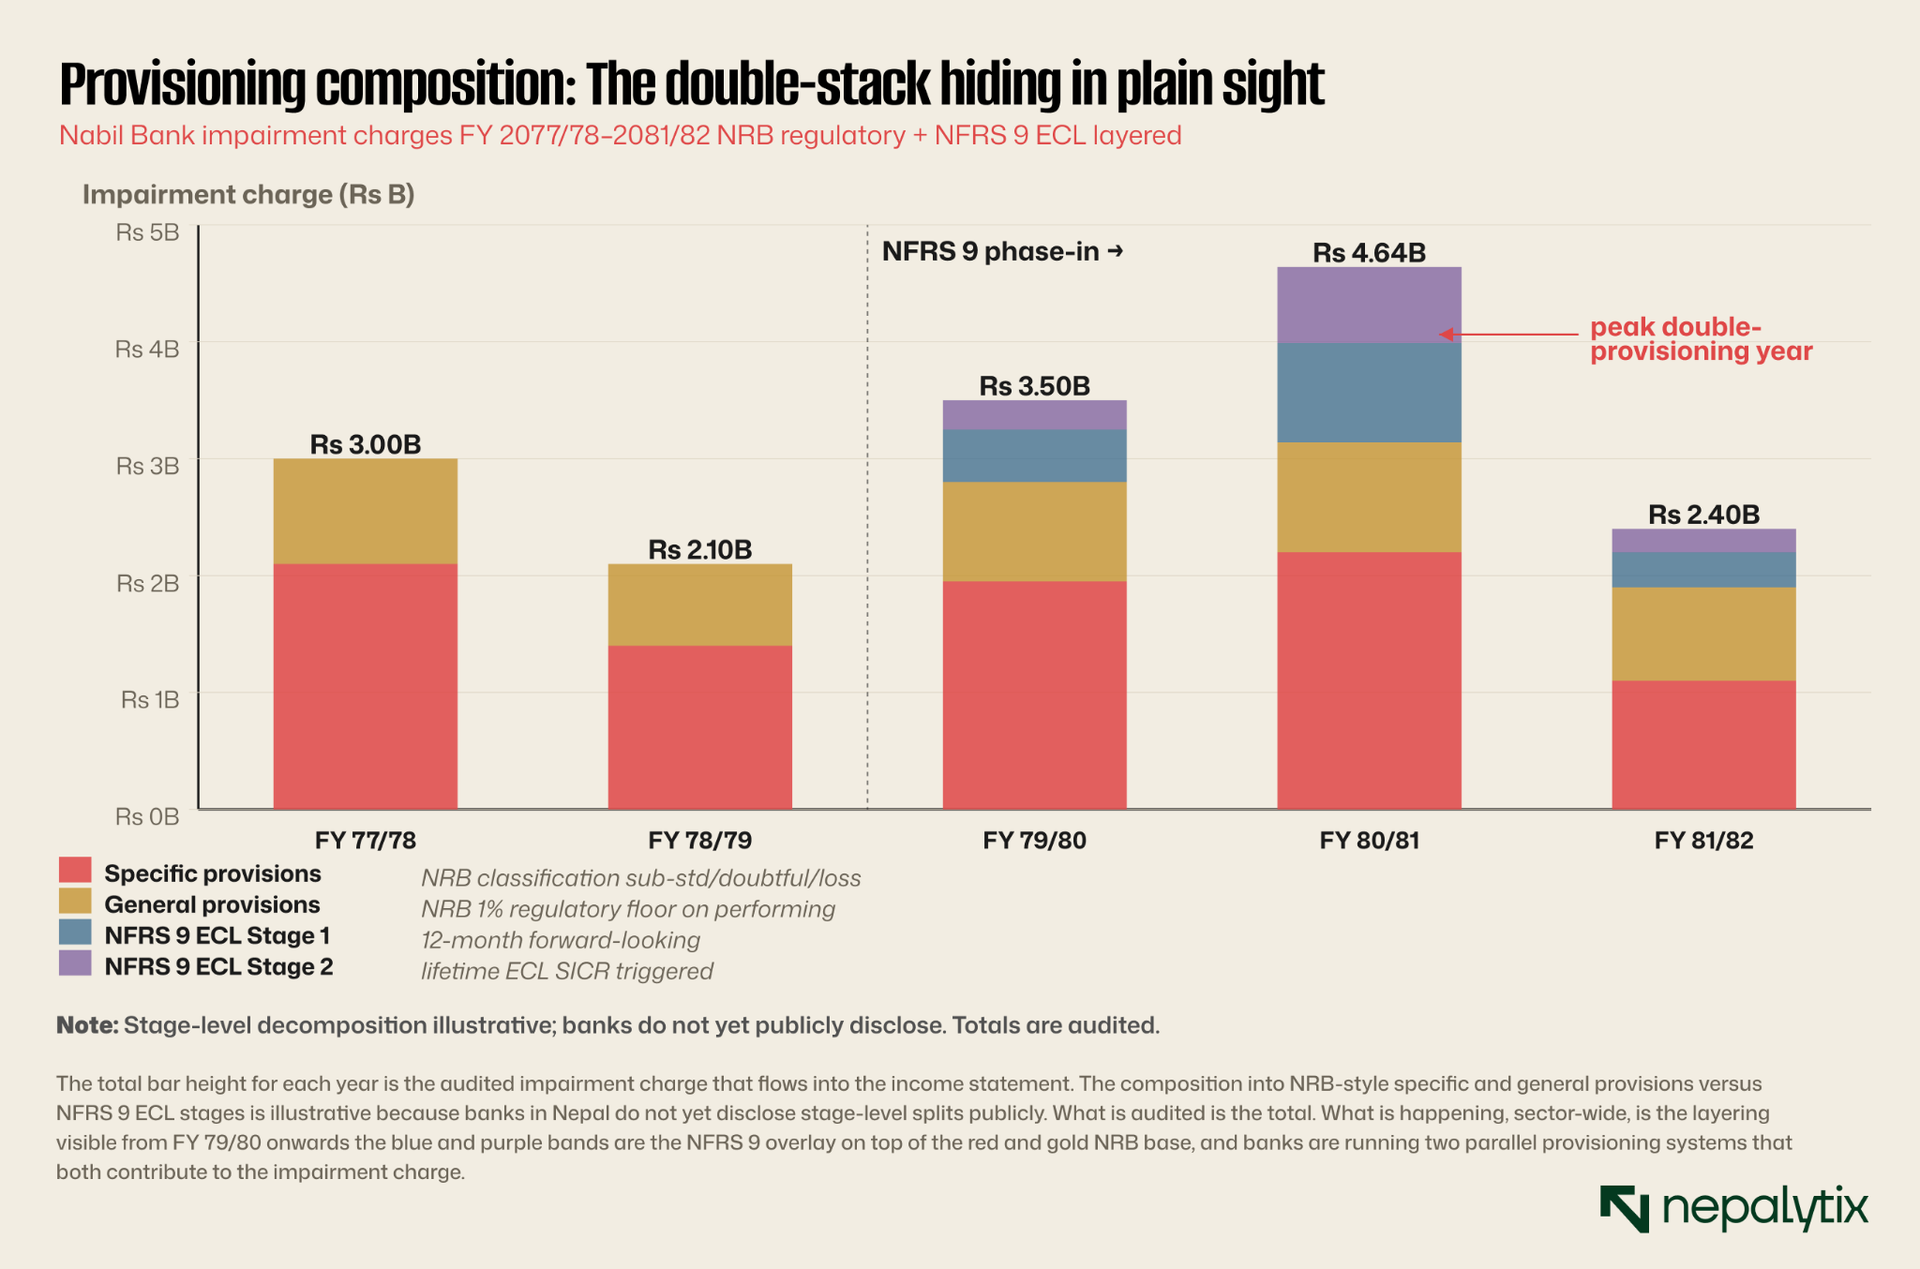
Nepal's banking sector is in the middle of a transition that makes the provisioning page particularly important right now. Until recently, banks provisioned only against loans that had already started to look bad, sub-standard, doubtful, or loss, all defined by how many days a borrower had missed payments. Under NFRS 9, banks now also have to provision against loans that look fine today but might deteriorate tomorrow, based on forward-looking models of credit risk. The result is that banks currently provision twice once under the old NRB classification, and once under the new NFRS 9 expected-credit-loss framework. The industry calls this "double provisioning," and it has been compressing bank capital ratios across the sector for the last two years.
This matters for how you read Nabil's report. Impairment of Rs 2.40 billion is down 48 percent from the prior year. That looks great. But there are two different ways it can be down 48 percent. The first is that the underlying loan book actually improved, more loans are performing, fewer are sliding into trouble. The second is that the bank chose to release provisions it had set aside in prior years, perhaps because the NFRS 9 model now says those provisions are unnecessary. Both look identical on the income statement. Only the notes tell you which it is.
So a careful reader, after seeing the impairment number, turns to the notes typically Note 4.7 (Impairment charge for loans and other losses) and Note 5 (Loans and advances to customers). These notes break the impairment number into its components. They show how much was new provisions, how much was reversals, how much came from specific loan classifications, and how much came from NFRS 9 stage transitions.
What to look for, line by line
When you open the impairment note, the first thing to look at is the split between specific provisions and general provisions. Specific provisions are set against loans that have already been classified as non-performing. If specific provisions go up sharply, it usually means new bad loans were classified during the year. If specific provisions go down sharply, it usually means either loans recovered or were written off and the difference between recovery and write-off matters enormously.
The second thing to look at is the NFRS 9 stage decomposition if the bank discloses it. Most Nepali banks are still building the disclosure habit. Stage 1 is performing loans where the bank books a 12-month forward-looking ECL. Stage 2 is loans that have had a significant increase in credit risk since origination the bank books a lifetime ECL but the loan is not yet non-performing. Stage 3 is non-performing. The migration of loans from Stage 1 to Stage 2 to Stage 3 is what the bank is tracking and what determines the ECL number.
The third thing to look at is the relationship between impairment and NPL movement. If NPLs are improving and impairment is also down, the story is coherent: fewer bad loans, less provisioning. If NPLs are improving but impairment is way down, the question is whether the bank released provisions and that is worth understanding. Nabil's case: NPL improved from 4.45 percent to 4.27 percent, a small move; impairment fell 48 percent, a large move. Some of that 48 percent is probably real improvement; some of it is probably a one-off release. The notes tell you the split.
Capital adequacy the building has three floors
Capital adequacy is the second place where the headline number conceals more than it reveals. Every Nepali commercial bank publishes its Capital Adequacy Ratio(CAR) and Nabil's FY 2081/82 CAR is 11.94 percent, down from 12.24 percent the year before. That number tells you very little on its own.
What you actually want to know is the structure of that capital. Bank regulators around the world, including NRB under the Basel III framework, treat bank capital as a layered structure. The cleanest analogy is a three-storey building.
Translation
CET1 is Common Equity Tier 1, the strongest layer of capital. Paid-up capital, statutory reserves, retained earnings, less deductions. AT1 is Additional Tier 1 perpetual preference shares and similar hybrid instruments that absorb losses without forcing dilution. Tier 2 is the top layer subordinated debentures, general provisions up to a cap. RWA is Risk-Weighted Assets the bank's assets adjusted for risk; loans to riskier borrowers get higher weights. CAR is total capital as a percent of RWA.
The ground floor is CET1. This is paid-up share capital, statutory reserves, retained earnings, less certain deductions. CET1 is the strongest form of capital because it absorbs losses first and never has to be paid back. The middle floor is AT1. This is perpetual preference shares, hybrid instruments that pay a coupon when the bank is profitable and that absorb losses without forcing dilution. The top floor is Tier 2 subordinated debentures, general loan loss provisions up to a regulatory cap. Tier 2 is the weakest form of regulatory capital because it has to be repaid eventually and only absorbs losses in a wind-up scenario.
Under Basel III, the regulator sets minimums for each floor and for the whole building. CET1 has to be at least 4.5 percent of risk-weighted assets. Tier 1 CET1 plus AT1 has to be at least 6 percent. Total capital Tier 1 plus Tier 2 has to be at least 8 percent. On top of that sit two buffers. The Capital Conservation Buffer is fixed at 2.5 percent and has to be filled with CET1. The Countercyclical Capital Buffer is set by NRB based on credit-cycle conditions and currently sits at zero. Adding the conservation buffer brings the effective minimum total CAR to 10.5 percent.
Nabil's CAR of 11.94 percent sits 1.44 percentage points above that 10.5 percent floor. That gap is the cushion. It is what stands between the bank and regulatory restrictions on dividends, on capital actions, on growth. A bank that breaches its capital conservation buffer cannot pay dividends or pay AT1 coupons without regulatory consent. A bank that breaches its minimum CAR is in active regulatory trouble.
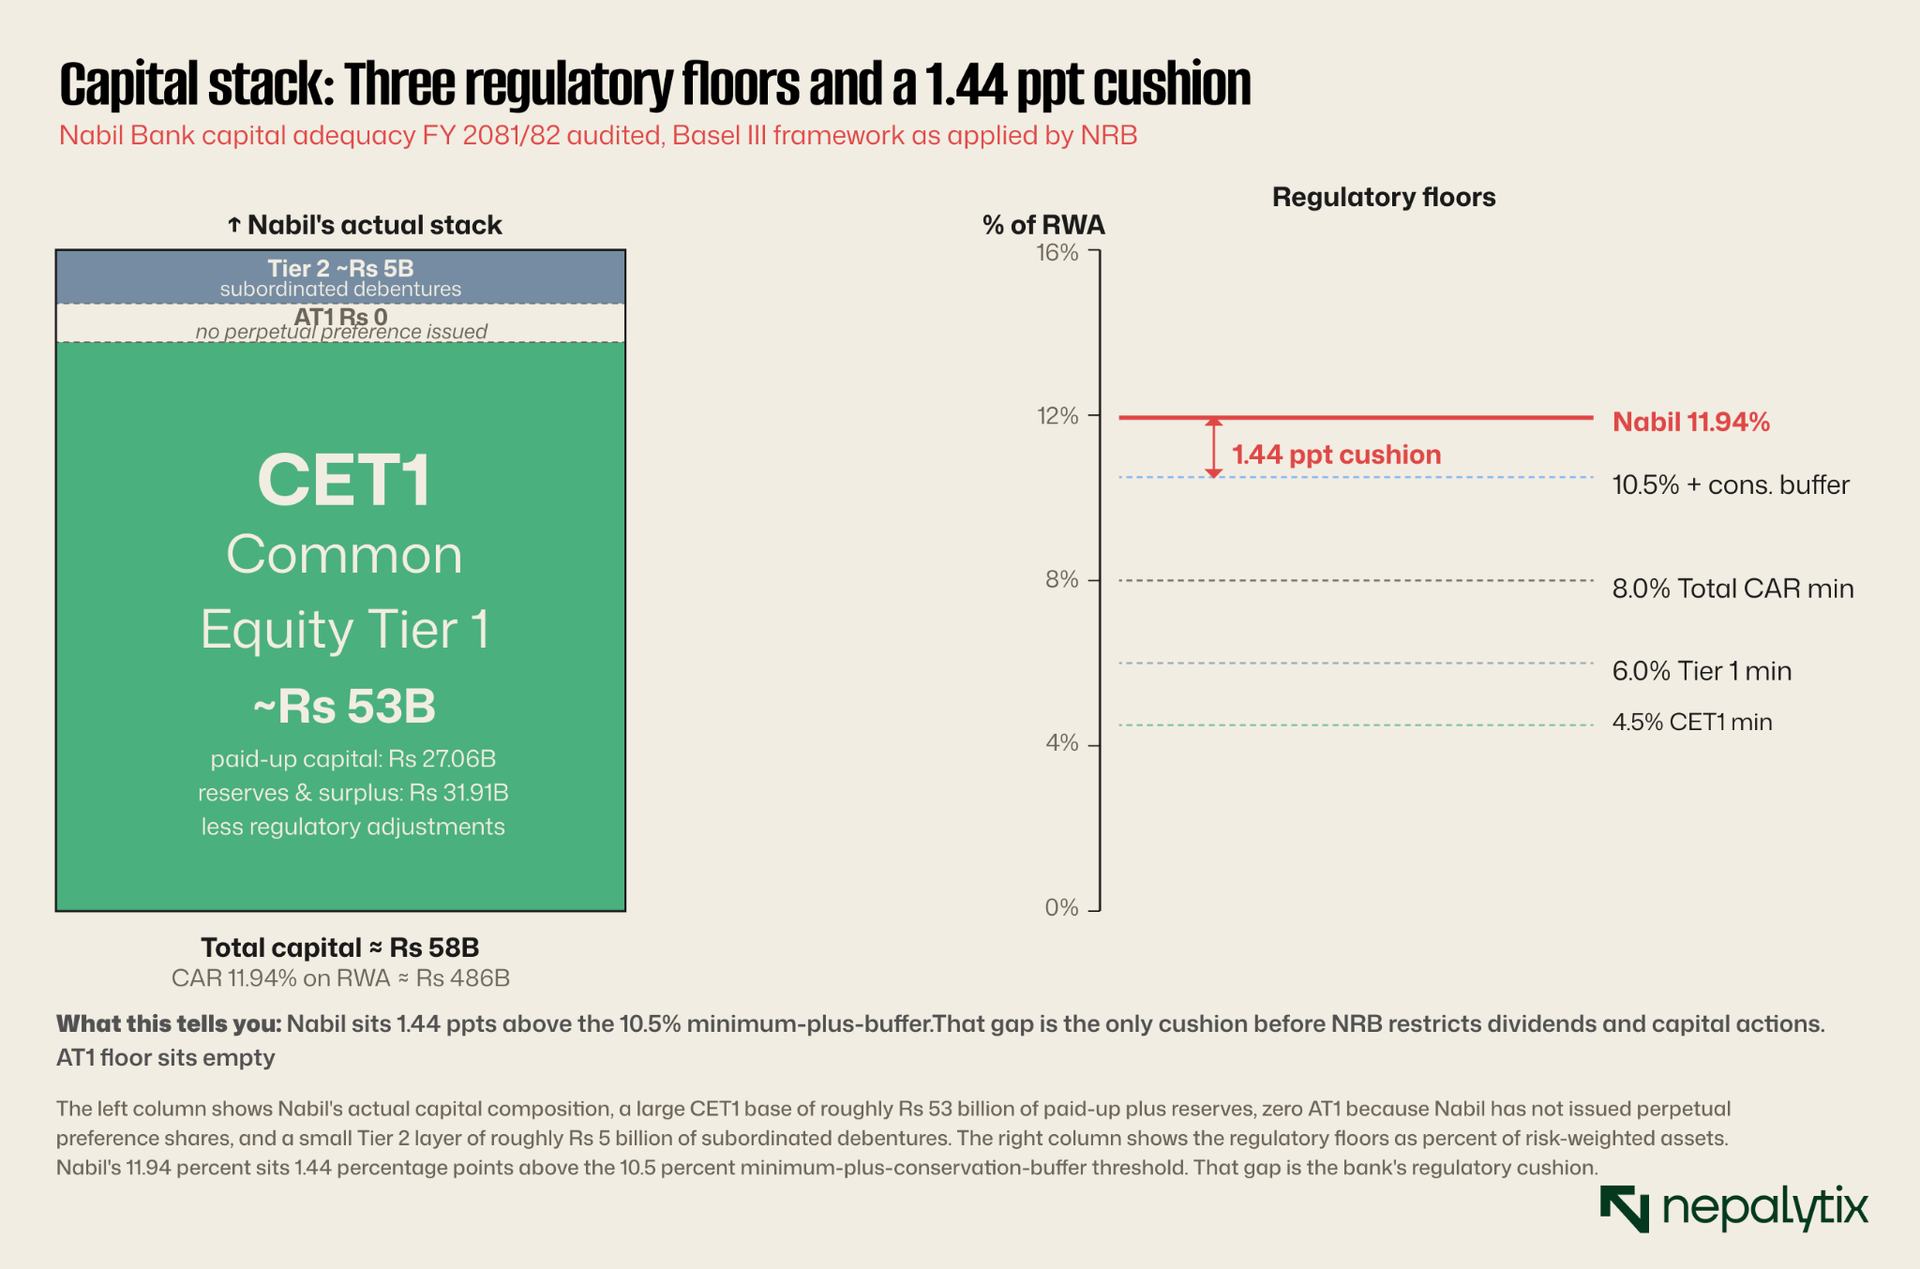
Notice the AT1 gap in Nabil's building. Three commercial banks listed perpetual preference shares in Nepal this quarter Sanima, NMB, and Machhapuchchhre at the same 8.25 percent coupon, all routed through institutional buyers. None of them are Nabil. The reason banks issue AT1 is that it adds Tier 1 capital without diluting common equity. The reason Nabil has not issued AT1 yet is presumably that its CET1 cushion, while thin, is still adequate for current operations. If that cushion compresses further through NFRS 9 transition, through credit growth, through any one-off loss AT1 issuance becomes the obvious next move.
Where 4.41 percent hides what the bank actually pays
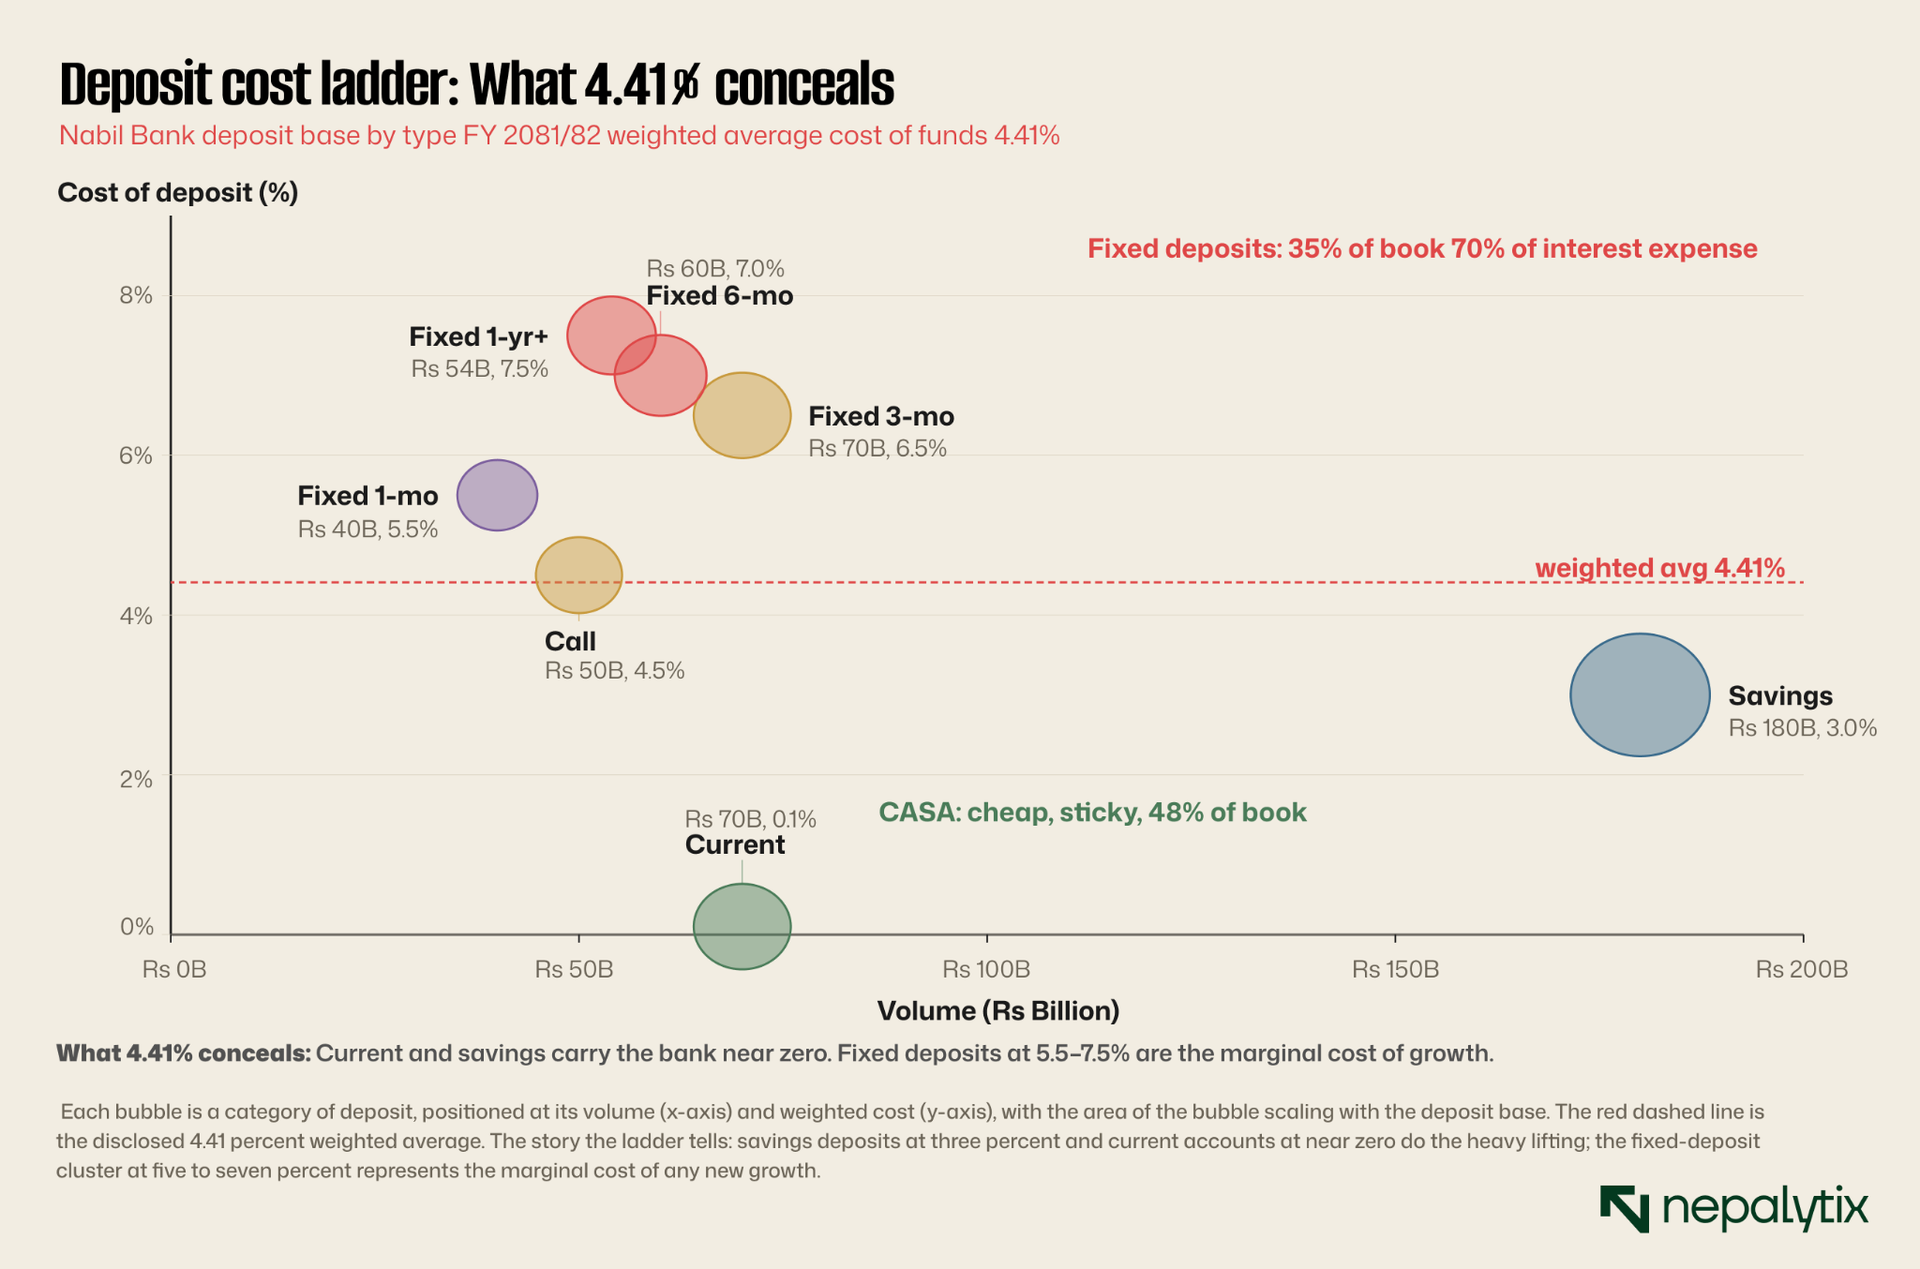
Nabil disclosed its cost of funds at 4.41 percent for FY 2081/82 down sharply from 5.86 percent the year before. That number is the weighted average across the entire deposit base. It is correct. It is also misleading if you read it as a single rate the bank pays its depositors.
What Nabil actually does is run a portfolio of deposits at very different prices. At one end, current accounts (transactional deposits where customers earn essentially nothing) cost the bank close to zero. At the other end, fixed deposits at one year or longer maturity cost the bank seven percent or more. The weighted average is just that, an average across the mix.
The mix matters enormously for the bank's profitability because the gap between deposit cost and lending rate is most of how the bank makes money. If the mix shifts toward more expensive deposits for example because depositors move from savings into fixed deposits chasing higher rates the cost of funds rises even if no individual rate has changed.
The annual report discloses the deposit base in three places. The face of the balance sheet shows the total. The deposits note (typically Note 25 or 26) breaks the total into categories current, savings, call, fixed at various tenors. The interest expense note (typically Note 4.2) shows what the bank paid on each category. A careful reader cross-references the two and computes the weighted average to verify it ties back to the disclosed cost of funds.
Why this matters for what you do with the number
A bank with a low cost of funds is not necessarily a better bank than one with a higher cost of funds. What matters is the spread the gap between what the bank pays on its deposit base and what it earns on its loan book. NRB caps the gap at four percentage points on a rolling basis to prevent banks from gouging. Nabil's net interest margin sits well within that cap, which is why its NII is what it is.
But the composition of the deposit base also tells you about the bank's franchise. A bank that runs a high CASA ratio meaning a high share of current and savings has a stickier, cheaper, lower-cost-of-growth deposit base. That bank can grow its loan book without proportionally raising rates to attract more deposits. A bank that runs a low CASA ratio is dependent on fixed deposits, which are price-sensitive and reprice quickly when rates move. The CASA ratio is one of the cleanest single numbers for distinguishing a strong commercial bank franchise from a weaker one.
For Nabil, the CASA ratio is roughly 48 percent current and savings accounts together account for nearly half the deposit base. The Nepali sector average sits around 35 to 40 percent. Nabil's franchise is good.
The notes are not optional
If you have made it this far in the annual report through the income statement, the impairment disclosures, the capital adequacy section and the deposit base you have read what most readers read. The rest of the document, which is most of the document, is the notes to the financial statements. The notes are where the bank discloses what it is contractually obliged to disclose under NFRS but that does not fit cleanly on the face of the balance sheet or income statement. They are also where most of the analytical content lives.
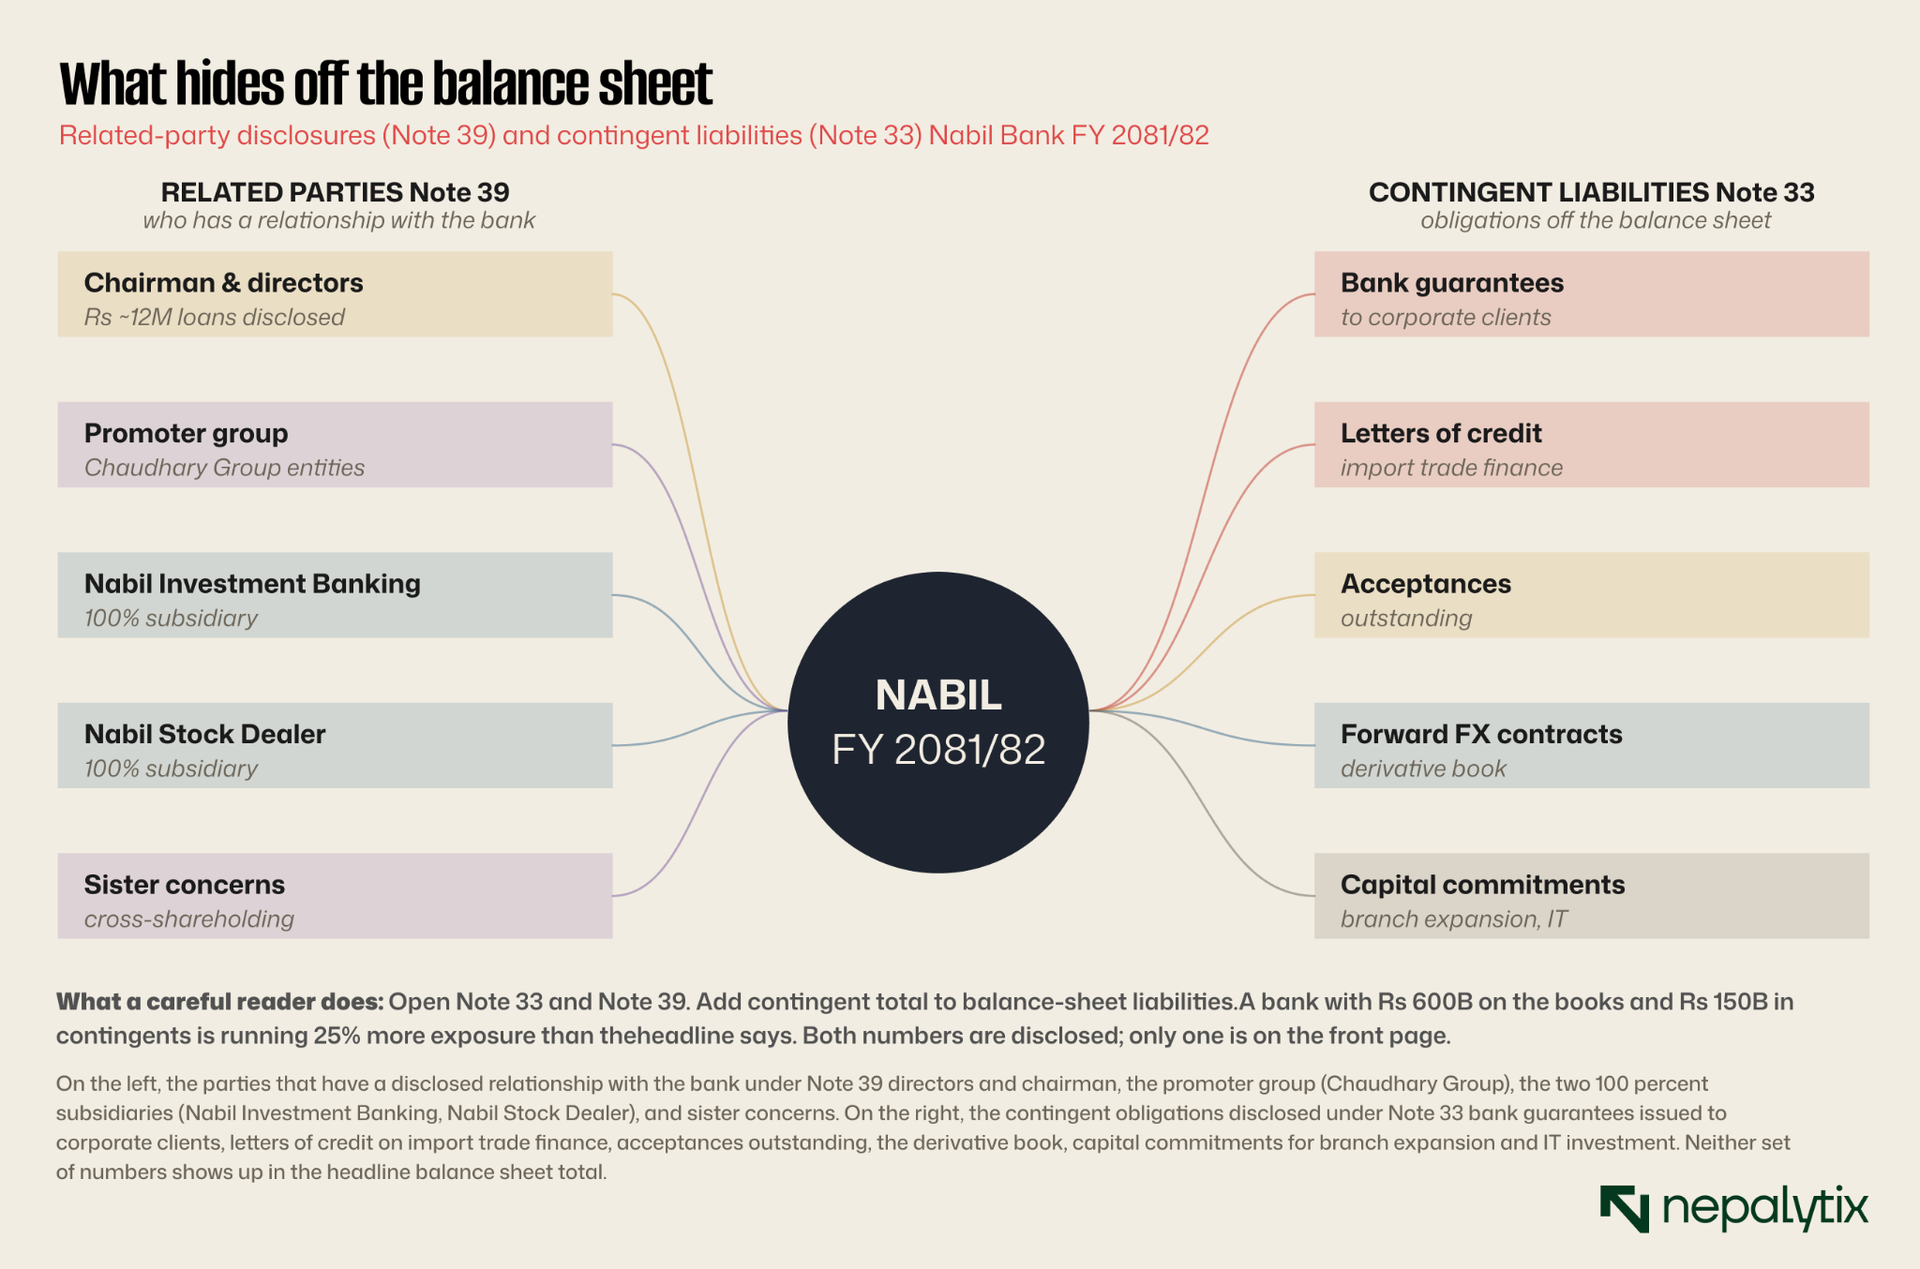
Two notes deserve particular attention. The Related Party Transactions note (typically Note 39 in Nepali commercial bank reports) discloses every transaction between the bank and parties related to its directors, senior management, promoter-group entities, subsidiaries, sister concerns. The Contingent Liabilities note (typically Note 33) discloses obligations the bank has taken on that are not yet on the balance sheet bank guarantees issued to clients, letters of credit, acceptances, derivative positions, capital commitments.
Both notes are routine in form and easy to overlook. Both notes have buried, sector after sector, in disclosed but unread paragraphs, the early warning signs of banks that went on to have problems.
How to actually read the related-party note
The related-party note will list, for each related party or category, the amount of loans outstanding, deposits held, transactions during the year and any unusual exposures. What you are looking for is two things. First, the total exposure to the promoter group relative to the bank's capital base. NRB caps single-party exposure at a percentage of the bank's capital; if related-party loans approach that cap, the bank is concentrating risk inside its own ownership group. Second, the trend year over year. A bank where related-party exposure is growing faster than the rest of the loan book is a bank that is increasingly lending to itself, which is exactly the pattern that has preceded most Nepali banking-sector problems.
How to read the contingent-liabilities note
The contingent-liabilities note lists guarantees, letters of credit, acceptances, undrawn commitments, derivative positions, and disputed tax claims. Each of these is an obligation the bank has accepted but that has not yet crystallized into an actual liability. If a corporate client defaults, the bank's guarantee becomes a real claim. If a counterparty fails on a forward FX contract, the bank wears the loss. These are real exposures.
The simplest test is to add the total contingent liabilities to the total balance-sheet liabilities. If the sum is 15 to 25 percent larger than the headline balance sheet, the bank is running meaningful off-balance-sheet exposure. That is not necessarily bad, large international banks run far higher off-balance-sheet ratios than that. But it tells you that the headline balance sheet is understating the bank's actual obligations, and you should adjust your read of leverage and capital adequacy accordingly.
The auditor's opinion is two paragraphs that matter
The audited financial statements are signed off by an external auditor. The auditor's report sits at the very front of the annual report, before the financial statements themselves, and runs to a few pages. Almost no retail reader reads it. They should.
The most important paragraph in the auditor's report is the opinion paragraph. There are four possible versions. An unqualified opinion means the auditor believes the financial statements present fairly, in all material respects, the financial position of the bank. This is the normal outcome and the one you should expect for a large Nepali commercial bank. A qualified opinion means the auditor agrees with the statements in most respects but flagged specific concerns. A disclaimer of opinion means the auditor was unable to form an opinion, usually because they could not get enough evidence. An adverse opinion means the auditor believes the financial statements do not present the bank's position fairly. The last two are rare and red flags; the third is rare and a serious warning.
The second most important paragraph is the Key Audit Matters section, introduced in the more recent NFRS auditing standards. This section is the auditor explicitly telling you which areas of the financial statements they spent the most time on, found most difficult, or thought most subject to judgment. For a Nepali commercial bank, the Key Audit Matters almost always include impairment of loans, going-concern considerations if relevant, complex valuation of financial instruments, and IT or data quality where systems are limiting. Reading the Key Audit Matters tells you where the bank's accounting is hardest, which is exactly where surprises tend to come from.
What you can now do with this skill
You have walked through the income statement and learned to trace where profit actually comes from. You have walked through the provisioning disclosure and learned to ask whether impairment reductions are real improvement or release. You have walked through the capital adequacy disclosure and learned to see the regulatory building as three floors with explicit floors. You have learned to read the cost of funds as a weighted average that hides a portfolio. You have learned to open the notes particularly the related-party and contingent-liability notes and adjust the headline numbers for what they conceal. You have learned to read the auditor's opinion as a two-paragraph signal about how clean the underlying financials are.
You can now open any Nepali commercial bank's annual report and do the same walk in roughly thirty minutes. You will see, for example, why Standard Chartered Nepal's CAR of 17.82 percent gives it a much wider cushion than Nabil's 11.94 percent. You will see why Everest Bank's NPL of 0.38 percent makes its asset quality unusually clean relative to a sector average of 4.44 percent. You will see why a bank that runs a 30 percent CASA ratio has a fundamentally weaker deposit franchise than one that runs a 50 percent CASA ratio, regardless of which has the higher reported net profit this year.
You will also, probably, notice that the headlines in the financial press rarely reflect any of these distinctions. That is by design headlines are written for readers who will not open the annual report. You are now a reader who does. Welcome to the small group of people who can actually read what the bank is telling them.
A teaching note before you go
The annual report is a primary-source document. Every audited number in this piece comes from Nabil's filings Q4 FY 2081/82 interim financial report and prior-year publications or from NRB regulatory disclosures and peer-bank disclosures via ShareSansar. Where decomposition was illustrative (the provisioning stage-level split, the deposit cost ladder breakdown), this piece flags it explicitly. You should expect the same standard from any analyst writing about a Nepali bank. If the number is presented as fact, it should trace to a disclosure. If it is presented as analysis, that should be made obvious. And one more thing. The first time you do this walk on a bank, it takes an hour. By the fifth bank, it takes twenty minutes. By the tenth, you start spotting differences between banks within ten. The skill compounds. Most retail investors never start because the first time is hard. The handful who do, build a real edge.
Disclaimer
This report has been prepared by Nepalytix for informational and educational purposes only and does not constitute investment advice, an offer, or a solicitation to buy or sell any securities.
The information contained in this report is based on sources believed to be reliable; however, Nepalytix does not guarantee its accuracy, completeness, or timeliness. Opinions, estimates, and projections expressed herein are those of the authors as of the date of publication and are subject to change without notice.
Investing in securities involves risks, including the possible loss of principal. Past performance is not indicative of future results. Readers are advised to conduct their own independent research and consult with a qualified financial advisor before making any investment decisions.
Nepalytix and its contributors may hold positions in the securities discussed in this report at the time of publication or thereafter.
Neither Nepalytix nor any of its affiliates accept any liability for any loss arising from the use of this report or its contents.