How to Read a Nepali Insurance Company’s Accounts
Nepal’s insurers sold more insurance but made far less profit last year. Here’s how to read the numbers behind the business.

Nepal's non-life insurers sold 14.81% more insurance last year and earned 39.21% less. Both figures come from the same statements. Understanding how they fit together is most of what there is to know about reading an insurer.
Nepal's fourteen non-life insurers sold 14.81% more insurance last year than the year before. Their combined profit fell 39.21%. Both of those sentences are true, both come from the same set of published statements and if you can explain how they fit together you already know how to read an insurance company's accounts.
If you cannot, this is the piece for you. It is the third thing this publication has run in eight days that ran aground on the same problem: insurance financial statements do not work like anybody else's and almost every ratio a reader carries over from banking or manufacturing gives the wrong answer when applied to them.
We will go through the statement in the order the money moves: premium in, risk out, claims paid, expenses, investment income, profit and at each step name the number that matters and the number that misleads.
One note on where to find any of this. Every listed Nepali insurer publishes an unaudited quarterly statement on its own website and through the portals in a standard format the Insurance Authority prescribes. The fourth-quarter statement covers the full fiscal year and is the one to work from. The audited annual report follows months later and is where the notes actually get useful: the reinsurance detail, the related-party disclosures, the segment splits that the quarterly omits. If you are serious about a company, the quarterly tells you the direction and the annual report tells you whether to believe it.
The top line is not one number, it is four
Open any Nepali insurer's quarterly statement and you will find several figures that all look like revenue. They are not interchangeable and the difference between them is the whole business.
Gross written premium is everything the company agreed to insure in the period, at the price it charged. It is the biggest number and it is the one that appears in press releases. Shikhar Insurance's claim to have collected a record premium in FY2082/83 is a gross written premium claim.
Gross earned premium is the portion of that which relates to risk the company has actually carried so far. If you sell a twelve-month motor policy on the last day of the fiscal year, you have written the premium but earned almost none of it, you still owe eleven months and eleven-twelfths of the money sits on the balance sheet as an unearned premium reserve. A fast-growing insurer will always have written premium well above earned premium which is one reason growth looks better in the year it happens than it deserves to.
Premium ceded is the share handed to reinsurers. The insurer keeps the customer, the paperwork and the claims handling but passes a slice of the risk and a corresponding slice of the premium to someone else. In Nepal a minimum tenth of this must go to a domestic reinsurer under the Insurance Authority's obligatory cession rule.
Net earned premium is what is left: earned, minus ceded. This is the only one of the four that represents revenue the company is genuinely at risk on, and it is the denominator for almost every ratio worth computing.
The distance between gross written premium and net earned premium can be very large. An insurer that writes a great deal of business and cedes most of it is closer to a distribution business than an underwriter, it earns commission for placing risk rather than profit for carrying it. Neither model is wrong. But a reader who compares one company's gross written premium to another's net earned premium is comparing two different things and will reach a confident wrong conclusion.
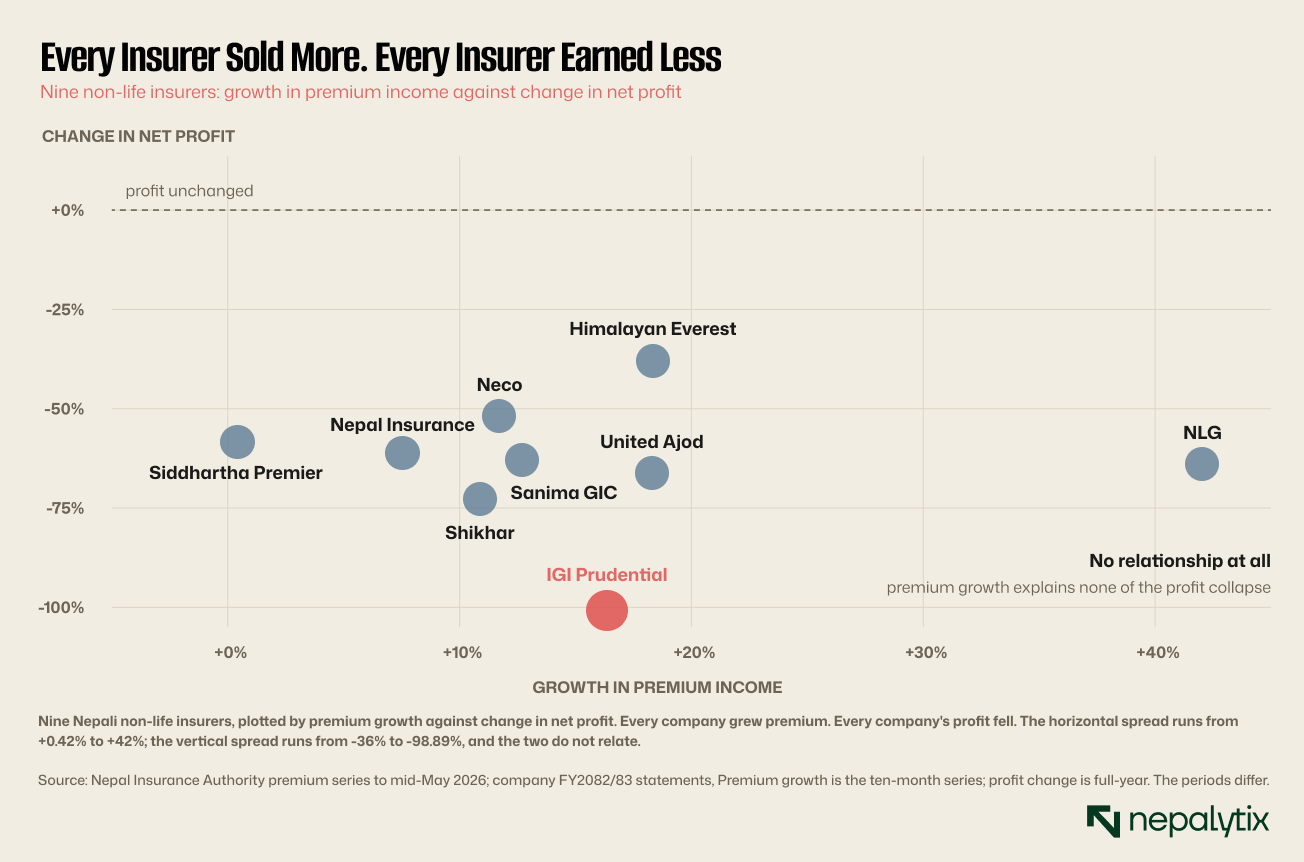
NLG Insurance grew premium 42.04%, the fastest in the sector and its profit fell 62.31%. Siddhartha Premier grew premium 0.42%, effectively not at all and its profit fell 56.75%. If premium growth explained profit, those two would sit at opposite ends of the vertical axis. They sit within six percentage points of each other.
Whatever happened to Nepali insurers in FY2082/83 happened below the top line.
Why insurance accounts are built backwards
Before the ratios, one structural point because it explains why everything that follows is awkward.
In almost every other business, you know your costs before or around the time you know your revenue. A cement plant buys coal, burns it, sells cement and can compute the margin on the sale within days. An insurer does the opposite. It sets the price first, at the moment the policy is written and discovers the cost afterwards, sometimes years afterwards when claims are reported and settled.
That inversion has three consequences you will meet on every page of the statement.
The cost of goods sold is an estimate. Net claims incurred is not a measured number. It is the sum of what has been paid plus a judgement about what is still owed. Two identically: performing insurers can report different profits purely because one reserved more conservatively than the other.
Profit is provisional for years. A fiscal year's underwriting result is revised as its claims settle. In mature markets this is made visible through a claims development table which shows how each year's original reserve estimate has moved over subsequent years. Nepali insurers do not publish one.
Cash arrives before the liability. Premium comes in at the start; claims go out later. The money in between is real, is invested and earns a return. That float is why an insurance company can be a poor underwriter and a profitable business at the same time.
Keep those three in mind and the rest of this piece is bookkeeping.
The claims ratio and why it moves without warning
The claims ratio sometimes the loss ratio is net claims incurred divided by net earned premium. It answers the only question that matters about underwriting: of every hundred rupees of risk the company kept, how many did it pay out?
Two words in that definition do a great deal of work.
Net means after reinsurance recoveries. A gross claims figure without the recoveries beside it is close to meaningless, and this is the single most common error in Nepali coverage of insurance results. When it was reported that the sector paid Rs 19.80 billion of claims in the first nine months of FY2082/83, up 19.91%, the report noted explicitly that the figure excluded amounts receivable from reinsurers. That caveat is the difference between a number you can use and one you cannot.
Incurred means claims relating to the period, not claims paid in the period. An insurer must estimate what it owes on accidents that have happened but have not yet been reported, and on reported claims not yet settled. Those estimates, the outstanding claims reserve and the reserve for claims incurred but not reported are the largest judgement in the accounts. An insurer that under-reserves reports higher profit now and pays for it later.
This is where a year like FY2082/83 comes from. Nepali insurers absorbed claims from the Bhadra 23–24, 2082 protest losses and from flood and landslide events. Those events did not change premium at all, the policies were already written and priced. They changed the claims side and they changed it after the pricing decision had been made.
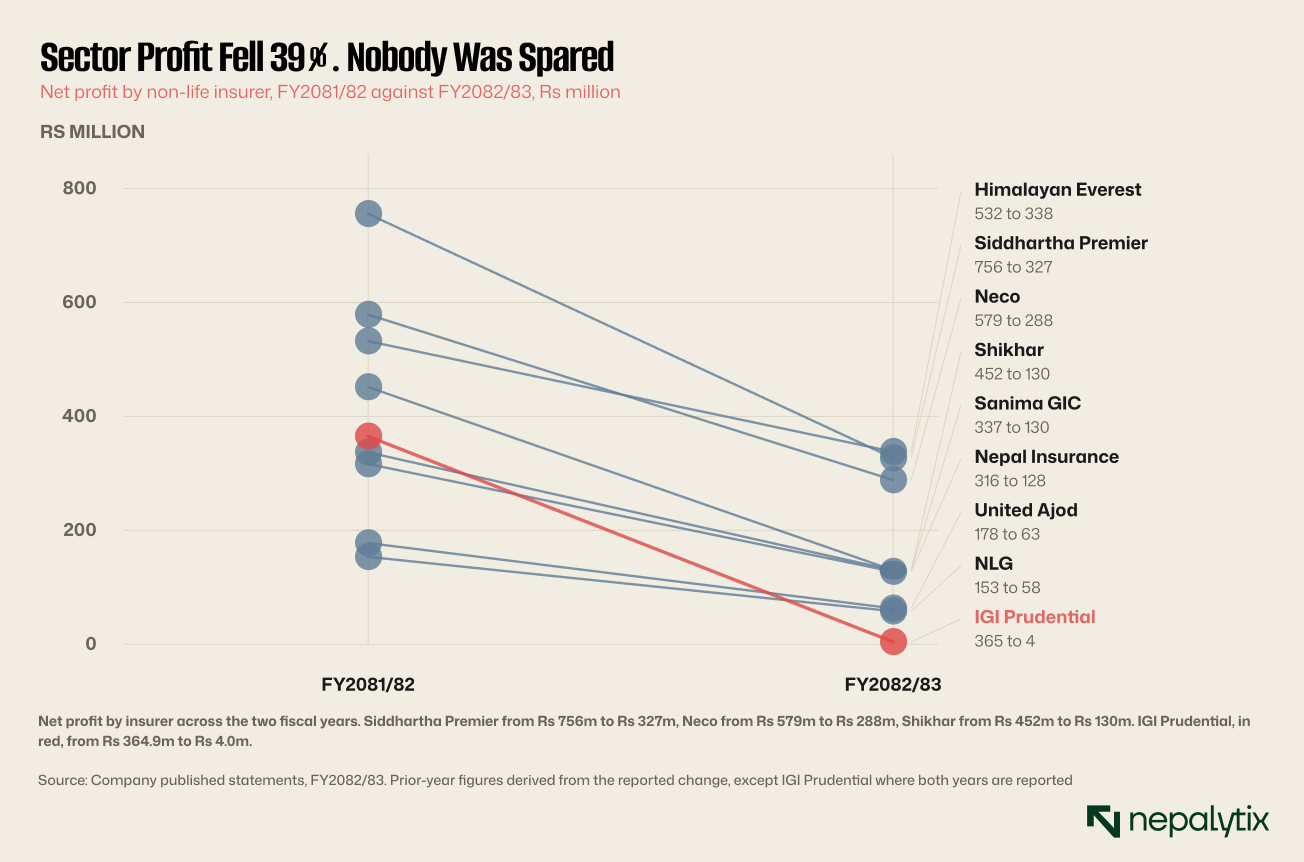
IGI Prudential is the case worth studying because a 98.89% fall in profit on premium income that grew 16.36% cannot be a revenue story. Something on the claims or reserving side consumed almost the entire result. The quarterly statement will not tell you which because Nepali insurers do not publish a claims development triangle, the table that shows how each year's reserve estimate has been revised as claims settled. Without it, an outside reader cannot distinguish an unlucky year from a year of catching up on past optimism.
There is a second reason claims ratios move without warning, and it is specific to how Nepali insurers are structured. Catastrophe losses are not evenly spread across a book. A company writing property and engineering risk in a hill district carries exposure that a motor-heavy insurer simply does not have and the accounts will look identical in a quiet year. The difference only appears when there is an event which is precisely when the reader most wants to have known in advance.
This is what reinsurance is supposed to fix and in principle it does. A well-structured programme caps the insurer's loss from any single event at its retention with everything above that recovered from reinsurers. The catch is that a reader cannot see the retention. It is not in the published statements. So when a flood removes fourteen power projects from the grid, an outside analyst can identify which insurers plausibly wrote that business but cannot say what any of them stands to lose.
The expense ratio has a legal ceiling
The expense ratio is management expenses over gross earned premium and unusually for a financial metric in Nepal it comes with a regulatory limit: the Insurance Authority caps it at 30%. Companies disclose their compliance in the notes. Nepal Insurance Company reported a management expense ratio of 24.41% in a recent statement alongside the express observation that this is within the limit.
Read that ratio against the cap and against peers but read it against gross earned premium rather than net because that is how the rule is written. A company close to 30% is a company with no room to invest in distribution or systems without breaching a directive.
The combined ratio is the number to learn
Add the claims ratio to the expense ratio and you have the combined ratio. It is the closest thing insurance has to a single measure of whether the underwriting works.
Below 100%, the company made money on the insurance itself. Above 100%, it paid out and spent more than it took in and any profit it reports came from somewhere else. Himalayan Reinsurance was described as running a combined ratio around 90% through FY2080/81 and FY2081/82 which is a genuinely good number and means roughly ten paisa of underwriting profit on every rupee of premium retained.
Most Nepali non-life insurers do not publish a combined ratio directly. You can construct it from the claims and expense lines but the components must be on consistent bases, net claims against net earned premium, management expenses against gross earned premium as the directive requires and mixing the denominators produces a number that looks like a combined ratio and is not one. When you build it yourself say which denominators you used.
One practical note on building the combined ratio yourself. Because the expense denominator the regulator requires is gross earned premium while the claims denominator that makes economic sense is net earned premium, the two components of a Nepali combined ratio sit on different bases unless you deliberately align them. There is no single right answer. State which convention you used, keep it constant across companies and do not compare your figure to one published by someone who did it the other way.
Where the profit actually comes from
Here is the fact that reframes everything above. For most Nepali insurers, in most years, investment income exceeds underwriting profit.
An insurer collects premium today and pays claims later. In between it holds the money, and in Nepal it holds a great deal of it in fixed deposits with commercial banks. That float earns interest, and the interest lands in the profit and loss account alongside the underwriting result.
The practical consequence is that a Nepali insurer's reported profit is substantially a function of deposit rates. When rates fall, investment income falls and a company that was scraping an underwriting profit finds the cushion gone. Deposit rates in Nepal have fallen sharply, the cost of funds at one development bank we examined last week went from 5.01% to 3.54% in a single year. What is good news for a bank's borrowers is a squeeze on every insurer's investment line.
So the one-page test for any Nepali insurer is this: find the underwriting result and the investment income separately and see which one is carrying the company. If it is investment income, you are not looking at an insurance business so much as a leveraged bond fund with a licence and a claims department. That is not necessarily a bad thing to own. It is a completely different thing to own than what the annual report describes.
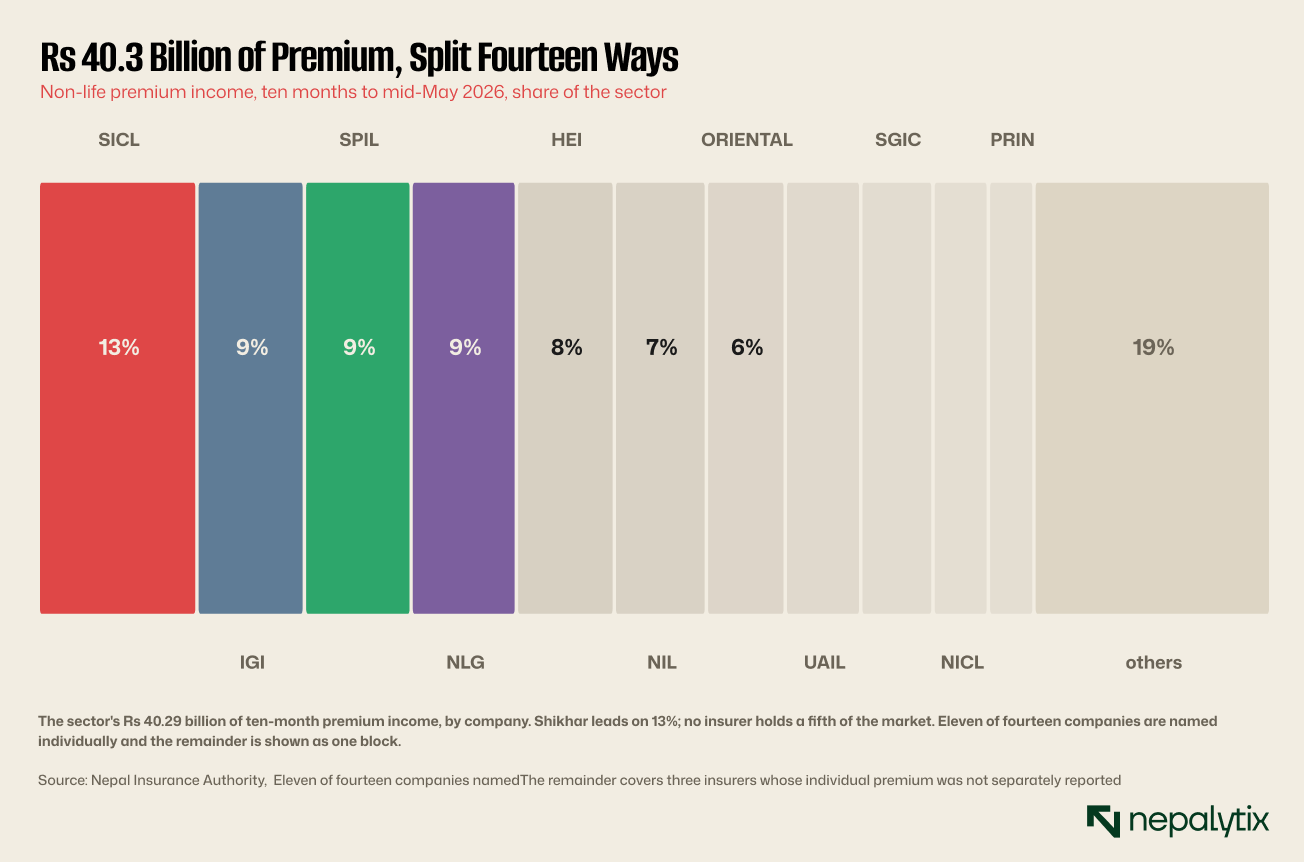
The above figure is context rather than analysis but it matters for how you read any single company. This is a fragmented market. Even after the consolidation that took twenty non-life insurers down to fourteen, the largest holds about an eighth of it. Fragmentation in insurance usually means price competition and price competition in a market where the regulator caps expenses and mandates cession means the pressure comes out somewhere usually in underwriting discipline.
The float has a second effect worth understanding, because it changes what growth means. An insurer that grows premium quickly collects cash quickly. That cash is invested immediately and starts earning, while the claims it will eventually pay arrive over the following years. Rapid growth therefore flatters current profit and defers the reckoning, the opposite of most businesses where growth consumes cash up front.
This is why an insurer growing at 42% a year deserves more scrutiny rather than less. NLG grew premium 42.04% in FY2082/83. That could be excellent underwriting winning share or it could be a company writing risk others declined at prices they would not accept. The accounts in year one look the same either way. The difference emerges in the claims ratio two and three years later which is exactly when nobody is looking.
The disclosures nobody reads which are the best ones
Three items sit in the notes rather than the headline tables and all three tell you more than the profit figure.
Outstanding claims. The number of claims reported but not settled. It is a count, not a rupee figure and it is a direct measure of how fast the company actually pays.
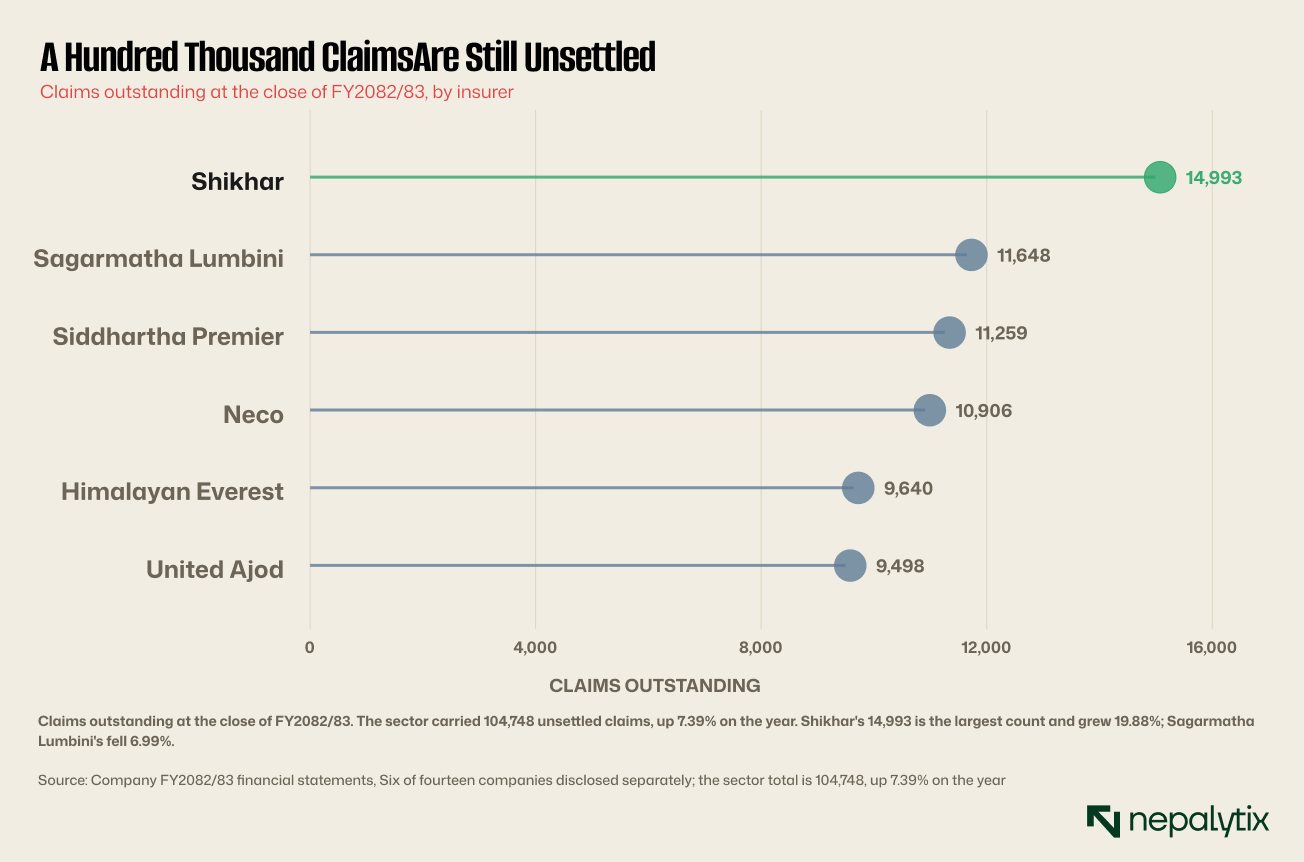
Read that chart with care because it is the kind that invites a wrong conclusion. Shikhar has the most unsettled claims and it is also the largest insurer by premium and among the largest by policy count. A backlog needs a denominator. What is informative is the direction: Shikhar's grew 19.88% while Sagarmatha Lumbini's fell 6.99%, in the same year, in the same market, facing the same catastrophe events.
The reinsurance note. Every Nepali insurer states, in a standard paragraph, that its reinsurance arrangement is adequate and that globally trusted reinsurers were chosen. It is boilerplate and the absence of detail is the point: you cannot tell from a Nepali insurer's published accounts who its reinsurers are, what the retention limit is, or whether the programme has a catastrophe layer. For a country that just lost 754 megawatts of hydropower to a flood, that is a significant hole in what shareholders can see.
The catastrophe reserve. A separate line in equity, built up over time. It is not a war chest, a large loss is met from the whole balance sheet and from reinsurance recoveries, not from an earmarked reserve but it is the only catastrophe-specific figure in the accounts and it is worth watching over several years.
A fourth disclosure deserves a mention because its absence is now consequential. Nepali insurers do not publish a solvency ratio in the quarterly statement, though the Authority monitors one. Solvency available capital against required capital where the requirement scales with the risk written is the measure of whether a company can absorb a bad year at all. For a sector that has just had a bad year and is facing a catastrophe of unknown size, it is striking that the single number designed to answer "can they take it?" is not something a shareholder can look up.
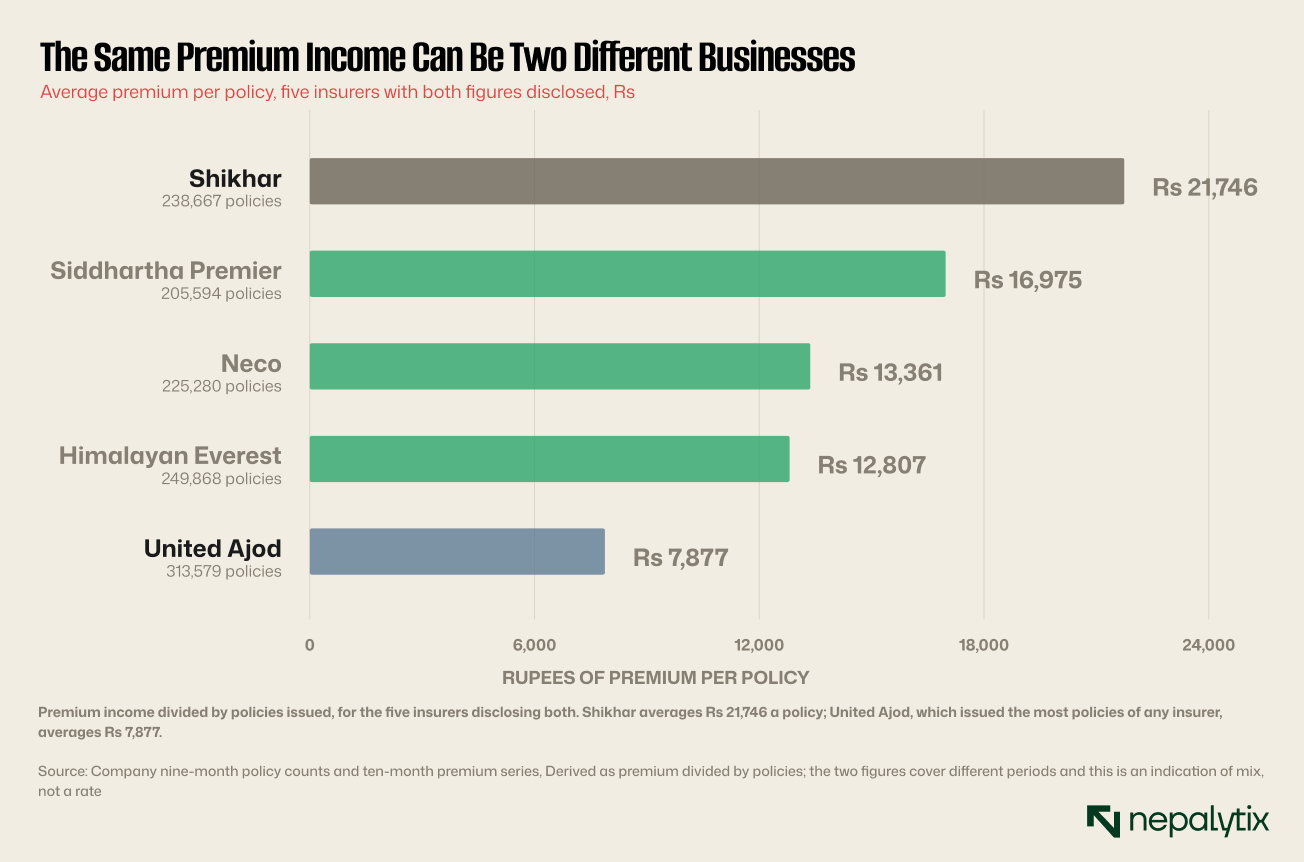
United Ajod issued 313,579 policies in nine months, more than any other Nepali non-life insurer and collected Rs 2.47 billion. Shikhar issued 238,667 and collected Rs 5.19 billion. Divide one by the other and Shikhar's average policy is 2.8 times the size of United Ajod's.
These are different businesses wearing the same licence. A book of many small policies: motor, micro, travel has predictable, high-frequency, low-severity claims and heavy administrative cost. A book of fewer, larger policies property, engineering, marine has lumpy claims, lower administration and far more exposure to a single event. The flood in Rasuwa will barely touch a micro-motor book. It could dominate a year for an engineering underwriter.
Nothing in the premium line distinguishes them. You have to divide.
Life insurers are a different animal again
Everything above concerns non-life insurance: motor, property, engineering, marine, travel, micro. Nepal's life insurers file statements that look superficially similar and work differently in ways worth flagging, since the two are frequently discussed together.
A life policy runs for decades rather than a year so the unearned premium concept is replaced by a life fund, a reserve calculated by an actuary against the policies in force. The size of that fund and the assumptions behind it, dominate the balance sheet. Where a non-life insurer's largest judgement is claims reserving, a life insurer's is actuarial valuation and the reader has even less visibility into it.
Bonus and surplus distribution work differently too: a life insurer's profit is divided between policyholders and shareholders under a formula so headline net profit is not what the company earned but what was allocated to one of two claimants on it.
The practical implication is that the ratios in this piece do not transfer. A combined ratio computed on a life insurer is a meaningless number. If you take one thing from this section, take that.
The checklist
Working through a Nepali insurer's statement, in order:
One. Find net earned premium, not gross written premium and use it as the denominator for everything on the underwriting side.
Two. Compute the claims ratio on net claims. If the statement gives gross claims without recoveries, you cannot compute it and should say so rather than guess.
Three. Find the management expense ratio and read it against the 30% cap, on gross earned premium as the directive requires.
Four. Build the combined ratio and state your denominators. Above 100 means the underwriting lost money.
Five. Separate investment income from the underwriting result and ask which is carrying the company. Then ask what happens to the answer if deposit rates fall another point.
Six. Divide premium by policies. Two insurers with identical premium income can be running opposite risk books.
Seven. Read the outstanding claims count and its direction, not its level.
Eight. Read the reinsurance note and notice how little it says.
A worked comparison in four lines
Put two companies side by side and the method above does its work quickly.
Siddhartha Premier collected Rs 3.49 billion of premium over ten months, up 0.42%. IGI Prudential collected Rs 3.51 billion, up 16.36%. On the top line they are the same size and IGI is growing far faster. A reader stopping there would prefer IGI.
Siddhartha Premier earned Rs 326.8 million. IGI Prudential earned Rs 4.0 million. On near-identical premium, one produced eighty times the profit of the other.
Siddhartha Premier paid Rs 1.83 billion of claims in nine months, the largest figure in the sector; IGI Prudential paid Rs 1.58 billion. So the company with the higher claims burden produced the higher profit which rules out claims volume as the explanation on its own and points at reserving, expenses, reinsurance structure or investment income none of which the statements separate.
That is as far as the public accounts take you and it is further than the headline number takes anybody. You end knowing that two apparently similar businesses are not similar at all and knowing precisely which disclosure you would need to finish the job.
What this does not let you do
An honest close. Working carefully through a Nepali insurer's published accounts will tell you whether the company underwrote at a profit, how fast it pays claims, and whether its earnings come from insurance or from interest. It will not tell you whether its reserves are adequate because the claims development data is not published. It will not tell you what catastrophe exposure it carries, because the reinsurance programme is not described. And it will not tell you what a flood in Rasuwa costs it because that disclosure does not exist and will not appear before the first-quarter statement in Kartik.
Those three gaps are the reason the sector's 39% profit fall could be read as an unlucky year or as a reserving correction and no reader outside the companies can tell which. When the next set of statements arrives, the useful thing to do is not to look at the profit. It is to look at whether any of those three disclosures has improved.
Disclaimer
This report has been prepared by Nepalytix for informational and educational purposes only and does not constitute investment advice, an offer, or a solicitation to buy or sell any securities.
The information contained in this report is based on sources believed to be reliable; however, Nepalytix does not guarantee its accuracy, completeness, or timeliness. Opinions, estimates, and projections expressed herein are those of the authors as of the date of publication and are subject to change without notice.
Investing in securities involves risks, including the possible loss of principal. Past performance is not indicative of future results. Readers are advised to conduct their own independent research and consult with a qualified financial advisor before making any investment decisions.
Nepalytix and its contributors may hold positions in the securities discussed in this report at the time of publication or thereafter.
Neither Nepalytix nor any of its affiliates accept any liability for any loss arising from the use of this report or its contents.