How to Read a Q4 Unaudited Report
Understanding a Q4 report isn't about reading more numbers. It's about reading the right ones.
Fiscal year 2082/83 closed at Asar end and the fourth-quarter filings have started landing. They are the most widely read and most widely misread documents in Nepal's capital market. Here is what is actually in one.
Every year in late Asar, Nepal's listed companies close their books and for the next six weeks a few pages of PDFs land on company websites and aggregator feeds carrying a headline number that thousands of people will treat as fact. Net profit for the year. Earnings per share. Net worth per share. The figure gets quoted in news reports, plugged into valuation models, and argued about in investor groups.
It is not a fact. It says so on the cover.
The fourth-quarter report is unaudited. That word is not a formality and it is not boilerplate. Between the unaudited Q4 filing and the audited annual report that follows it, real numbers move, sometimes by a rounding error, sometimes by eight per cent, occasionally by enough to change whether a company can pay the dividend its board has already discussed.
Nepal Infrastructure Bank published its Q4 for FY2082/83 on 23 July. Net profit Rs 987.39 million, earnings per share Rs 4.57, down 19.98% on the year. Straightforward enough until you ask what it is down from.
A 19.98% decline off Rs 987.39 million puts the prior year at Rs 1,233 million. The report's own comparative EPS of Rs 5.71, multiplied across NIFRA's 216 million shares, gives the same answer: Rs 1,233 million.
Now go back twelve months and read what NIFRA said about that same fiscal year in its own Q4 unaudited filing. Net profit of Rs 1.14 arba. Rs 1,140 million. Earnings per share Rs 5.30.
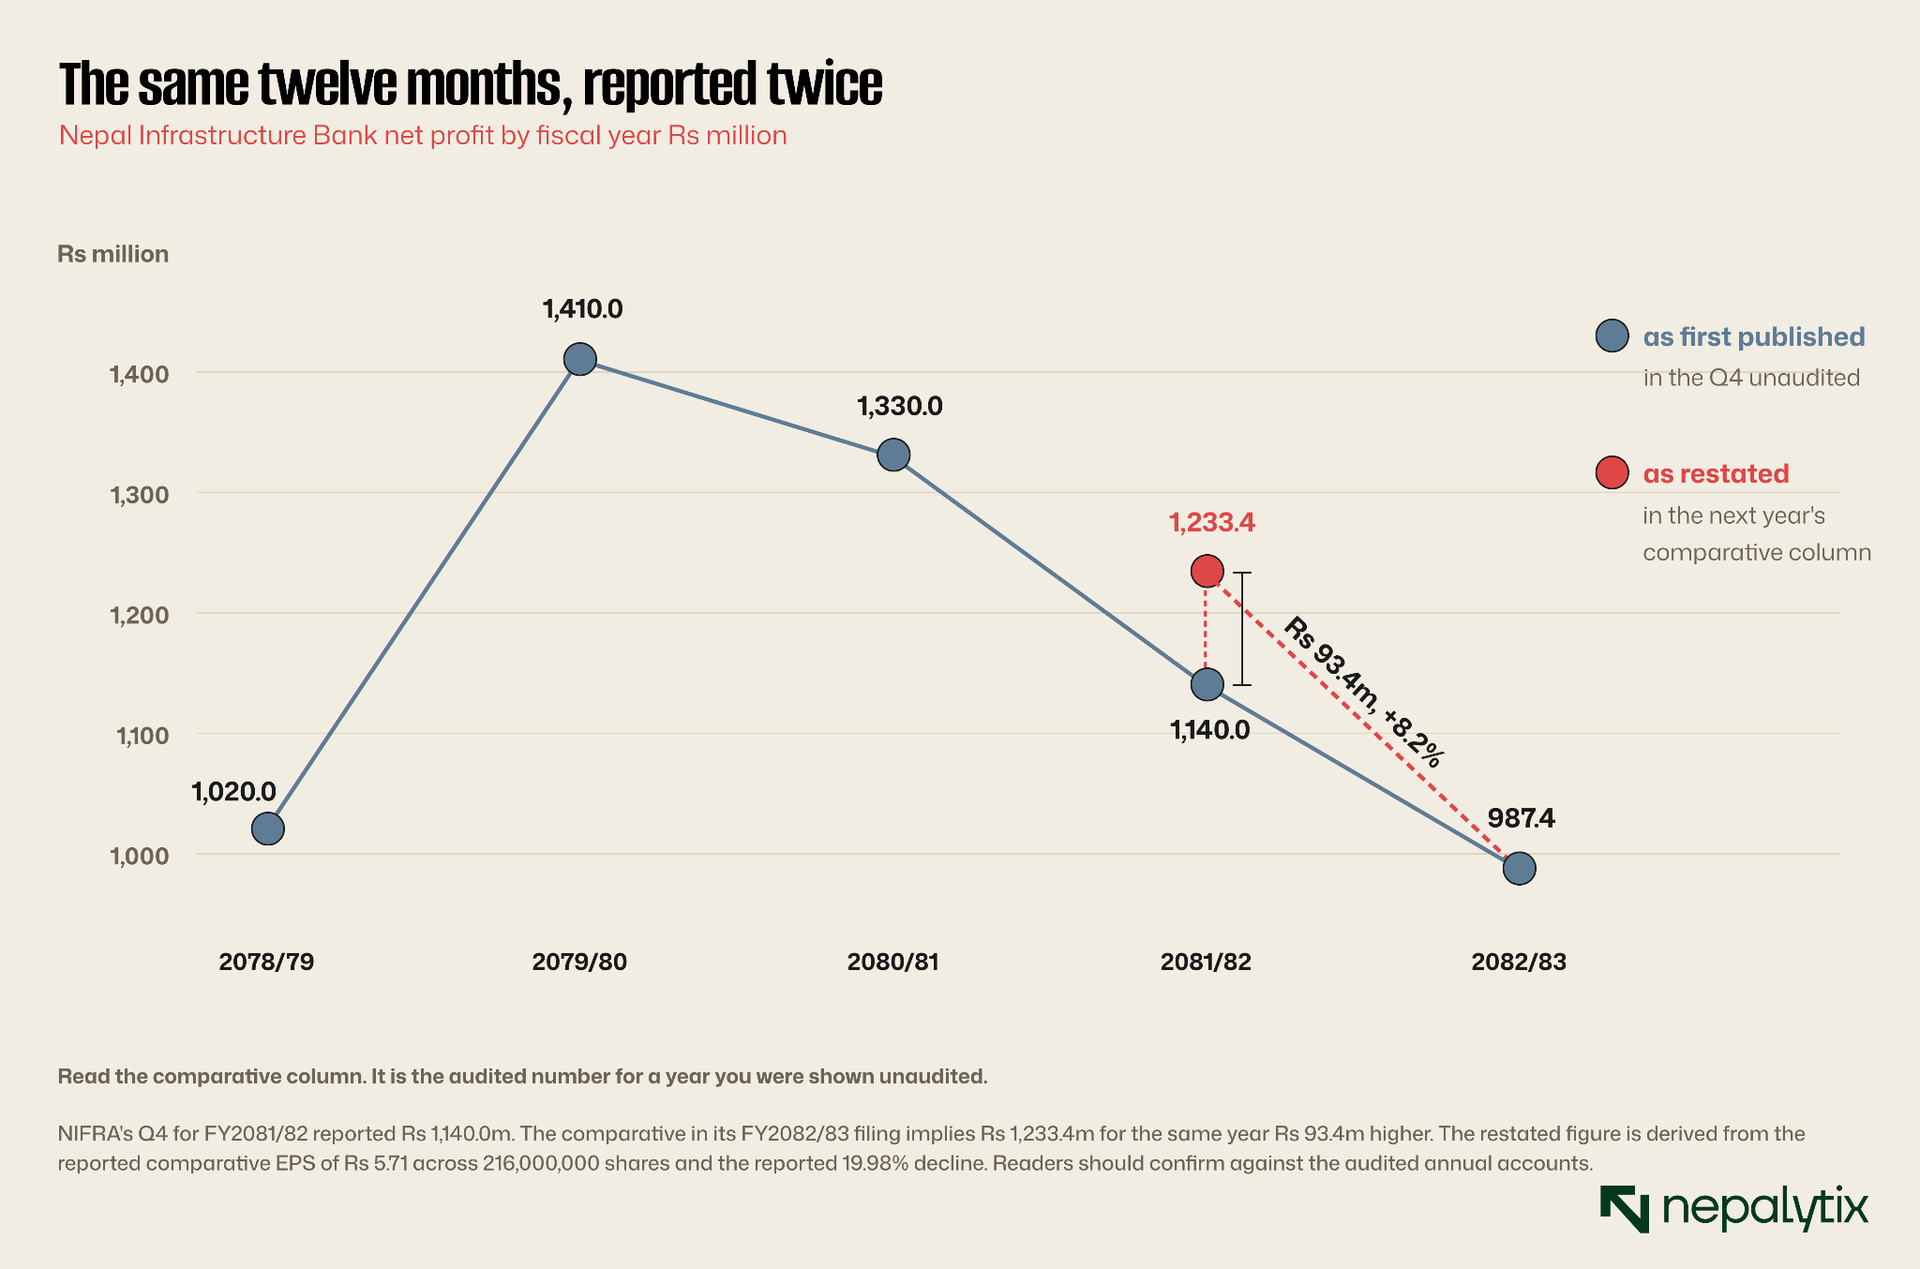
Rs 1,140 million then. Rs 1,233 million now. Same twelve months, 8.2% apart, somewhere between the unaudited print and the auditor's signature.
Nobody hid anything. This is how the system is supposed to work. The unaudited report is management's best estimate against a deadline; the audit is the check. But it means the number you read in Shrawan is a draft and the market prices it as though it were final.
The habit to build
When you open any Q4 report, read the comparative column first, not the current one. That column is the prior year as audited. Compare it against what the company published for that same year in its own Q4 twelve months earlier. The difference is the audit adjustment and it tells you how reliable this company's unaudited estimates have historically been.
A company whose Q4 numbers survive the audit unchanged has earned some trust. One that restates by eight per cent has told you to wait for the audited accounts.
It is worth understanding why the unaudited version exists at all. Regulators require timely disclosure because a market that waits six months for numbers is a market trading on rumour. So companies publish fast, on their own figures and the audit catches up later. The trade-off is deliberate: speed bought at the cost of certainty. Nobody pretends otherwise except the people reading it.
The size of the adjustment also varies systematically. Companies with simple revenue recognition and few estimates: a hydropower producer selling to a single offtaker at a fixed tariff rarely restates much. Companies whose profit depends on judgement, and banks above all, restate more. Loan impairment is an estimate. Deferred tax is an estimate. The value of property seized from a defaulter is an estimate. Every one of those is a place where management and auditor can reasonably disagree.
Most of what follows is about learning to see the seams.
Q4 is the only quarter that lies about its own shape
Every Nepali quarterly report carries the same four columns: this quarter and up to this quarter for the current year and the previous one. Two of those columns are the standalone three months. Two are cumulative, running from Shrawan.
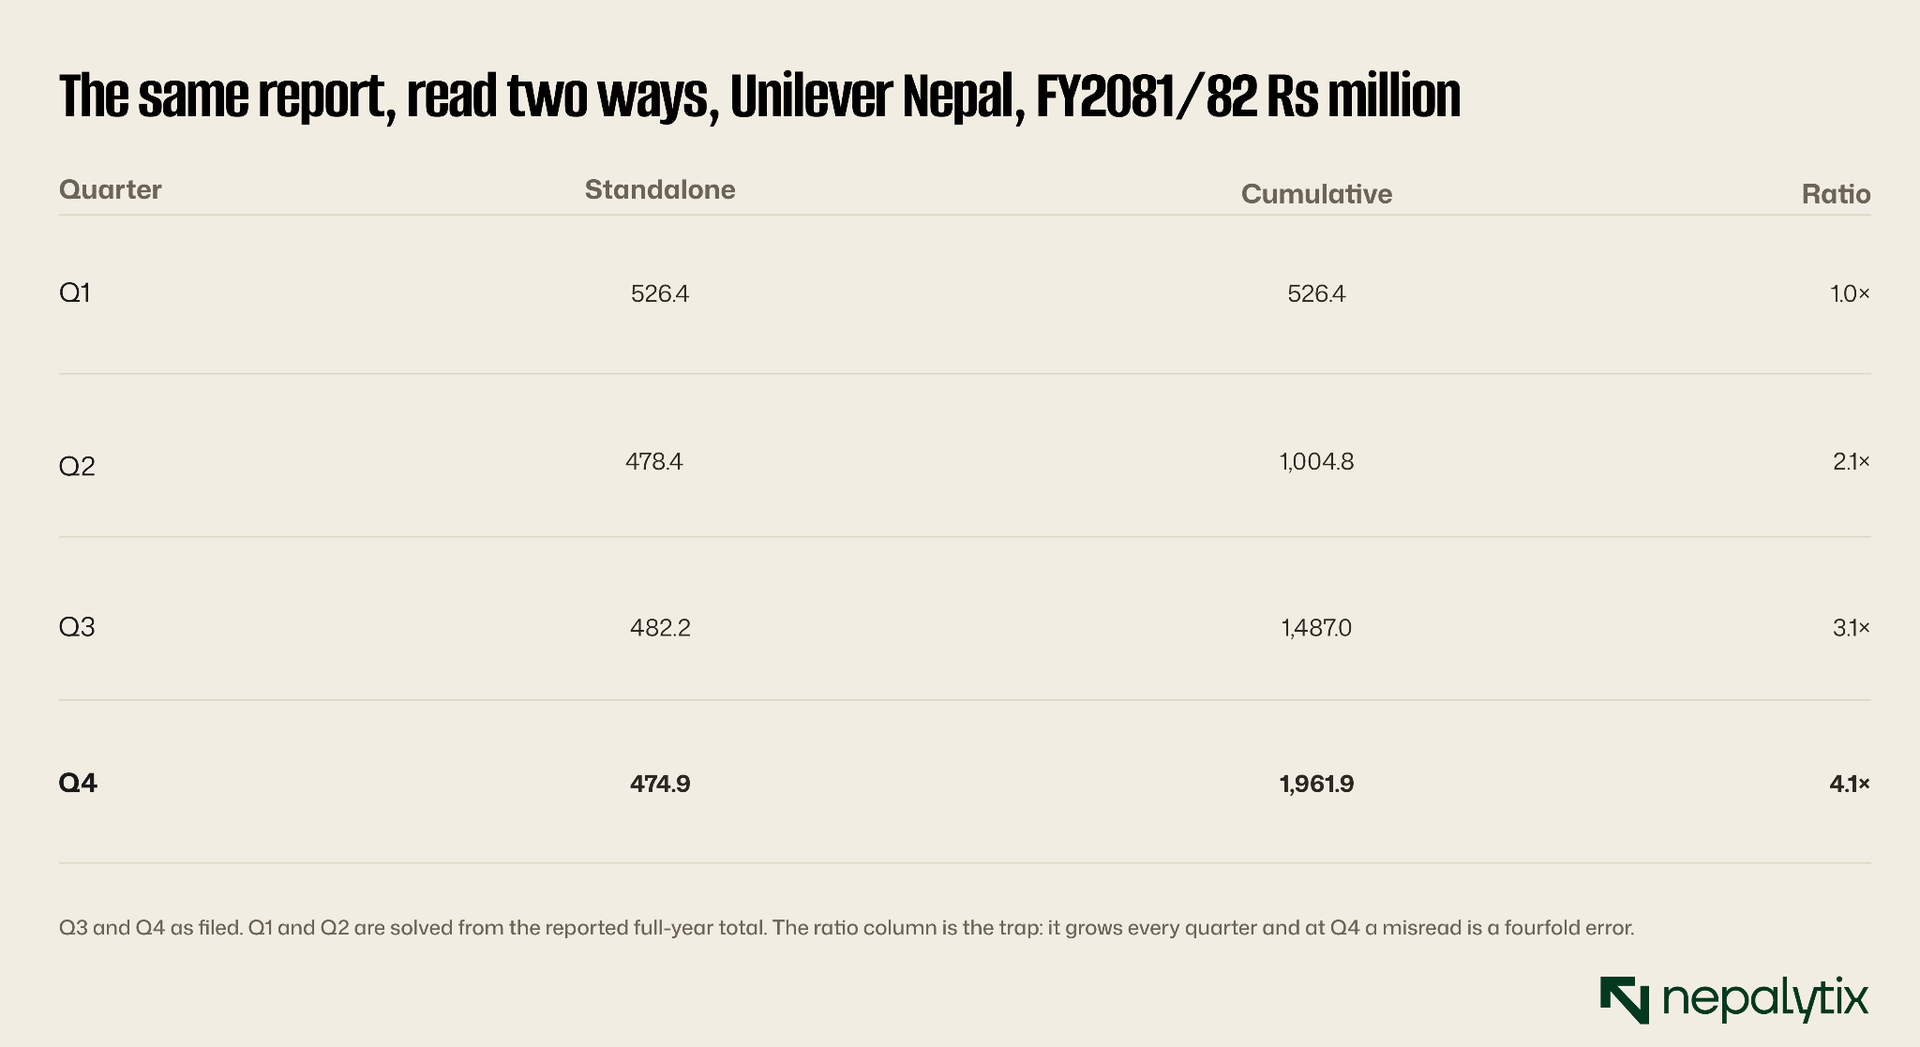
For Q1 the two are identical so nobody notices. By Q2 they differ by roughly half. By Q4 the cumulative column is four times the standalone one and this is where a very large number of published comparisons quietly break.
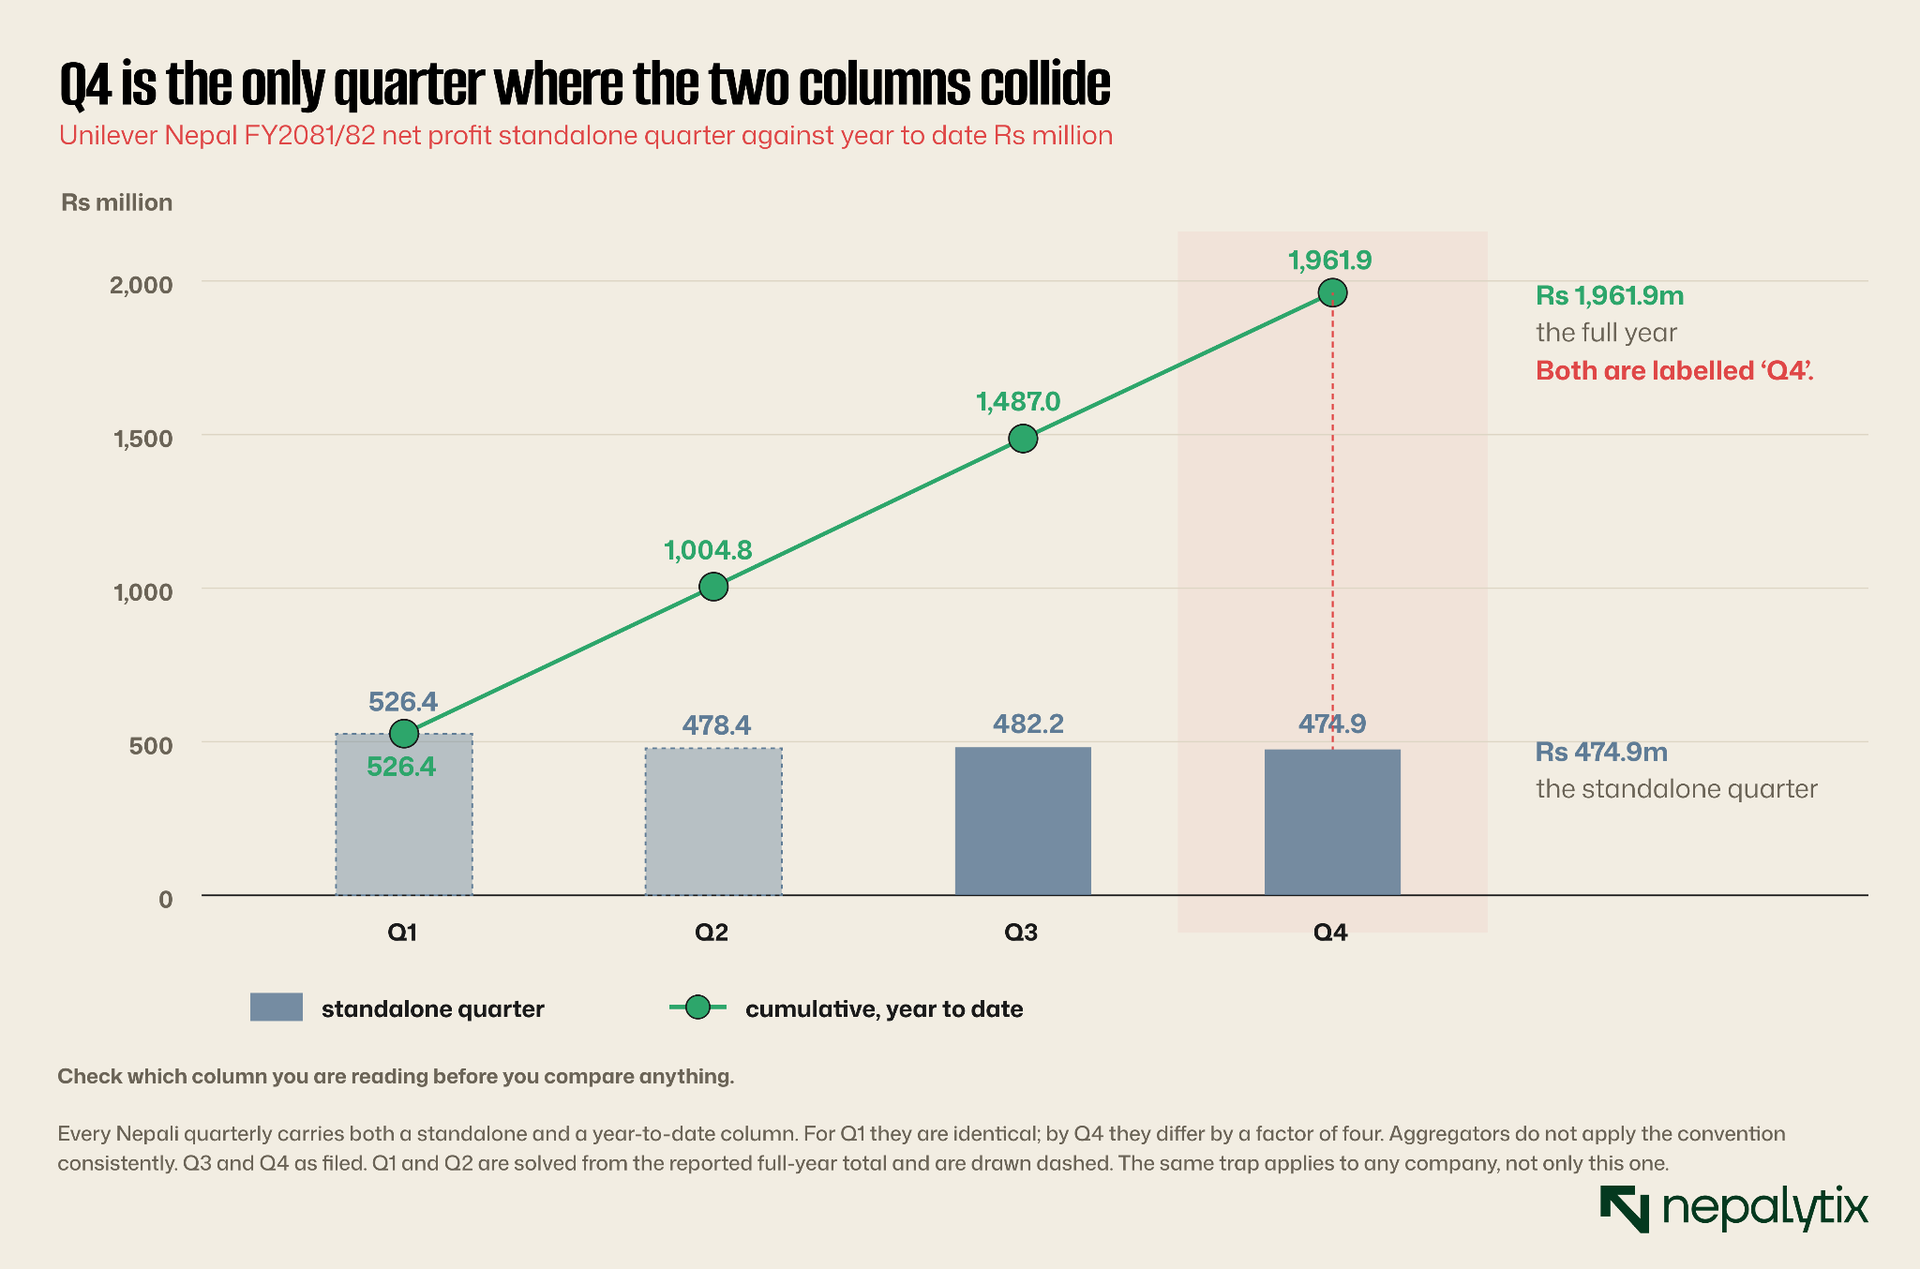
Look at what happens in the fourth column. Unilever Nepal's Q4 filing for FY2081/82 contains a standalone quarterly profit of Rs 474.9 million and a full-year profit of Rs 1,961.9 million. Both are correct. Both are in the same document. Both get described as "Q4".
The aggregators do not handle this consistently. In the widely circulated tables, the Q1 to Q3 figures are pulled from the standalone column and the Q4 figure is pulled from the cumulative one. Follow those tables through a year and you get a company that earned Rs 482.2 million in its third quarter and Rs 1,961.9 million across twelve months which would require a fourth quarter of roughly Rs 1.48 billion from a business that has never earned more than Rs 530 million in any three-month period.
The revenue line settles it immediately. Unilever's Q3 report shows Rs 2.02 billion; the Q4 report shows Rs 8.25 billion. A company turning over roughly Rs 2 billion a quarter does not do Rs 8.25 billion in nine months. The Q3 figure is one quarter.
There is a simple defence and it costs ten seconds. Take the quarter you are reading and check it against the same company's previous quarterly report. If the new figure is smaller than the one three months ago, you are in the standalone column. If it is larger, you are in the cumulative one. Cumulative figures only ever rise through a fiscal year; standalone figures move in both directions. That single test resolves almost every ambiguity you will meet.
If a company's Q4 looks four times bigger than its Q3, you are not looking at growth. You are looking at two different columns.
This matters more than it sounds, because it corrupts the derived figures too. The "annualised EPS" printed alongside these tables is a multiplication of whichever column was taken, quarter times four or nine months times four-thirds. For Q1 through Q3 it is an extrapolation. For Q4 it is the actual number. The same label describes two completely different quantities depending on which quarter you are in.
There is a second derived figure with the same problem, and it catches even careful readers: net worth per share. Some companies report it before deducting the proposed dividend; others report it after. In a year where a company proposes a large distribution, the two versions can differ by a fifth or more, and nothing on the face of the report tells you which convention was used. Unilever Nepal's FY2081/82 Q4 showed net worth per share rising 78% year on year, which no operating business does. The move was almost entirely a change in what the prior-year figure had been measured against.
The defence is arithmetic. Take paid-up capital plus reserves and retained earnings, divide by the share count, and compare that against the printed figure. If they agree, the dividend has not been deducted. If the printed figure is lower, it has. Two minutes of work, and it stops you comparing a pre-dividend number in one year against a post-dividend number in the next.
Net profit is not the number that pays you
Here is the mistake that costs Nepali investors the most money, and it is almost entirely confined to banks and financial institutions.
A bank reports net profit for the year. The number looks healthy. Investors calculate a payout expectation against it, and are then surprised when the board proposes something far smaller. The gap is not conservatism. It is regulation and it is disclosed in the same report usually several pages past where most readers stop.
Nepali banks cannot distribute net profit. Before anything reaches shareholders, 20% of profit goes to the general reserve as a statutory appropriation. Then come the regulatory reserves: amounts set aside against interest accrued but not received, deferred tax assets, non-banking assets taken in settlement of bad loans, and several smaller items. What survives all of that is distributable profit and that is the only pool a dividend can legally come out of.
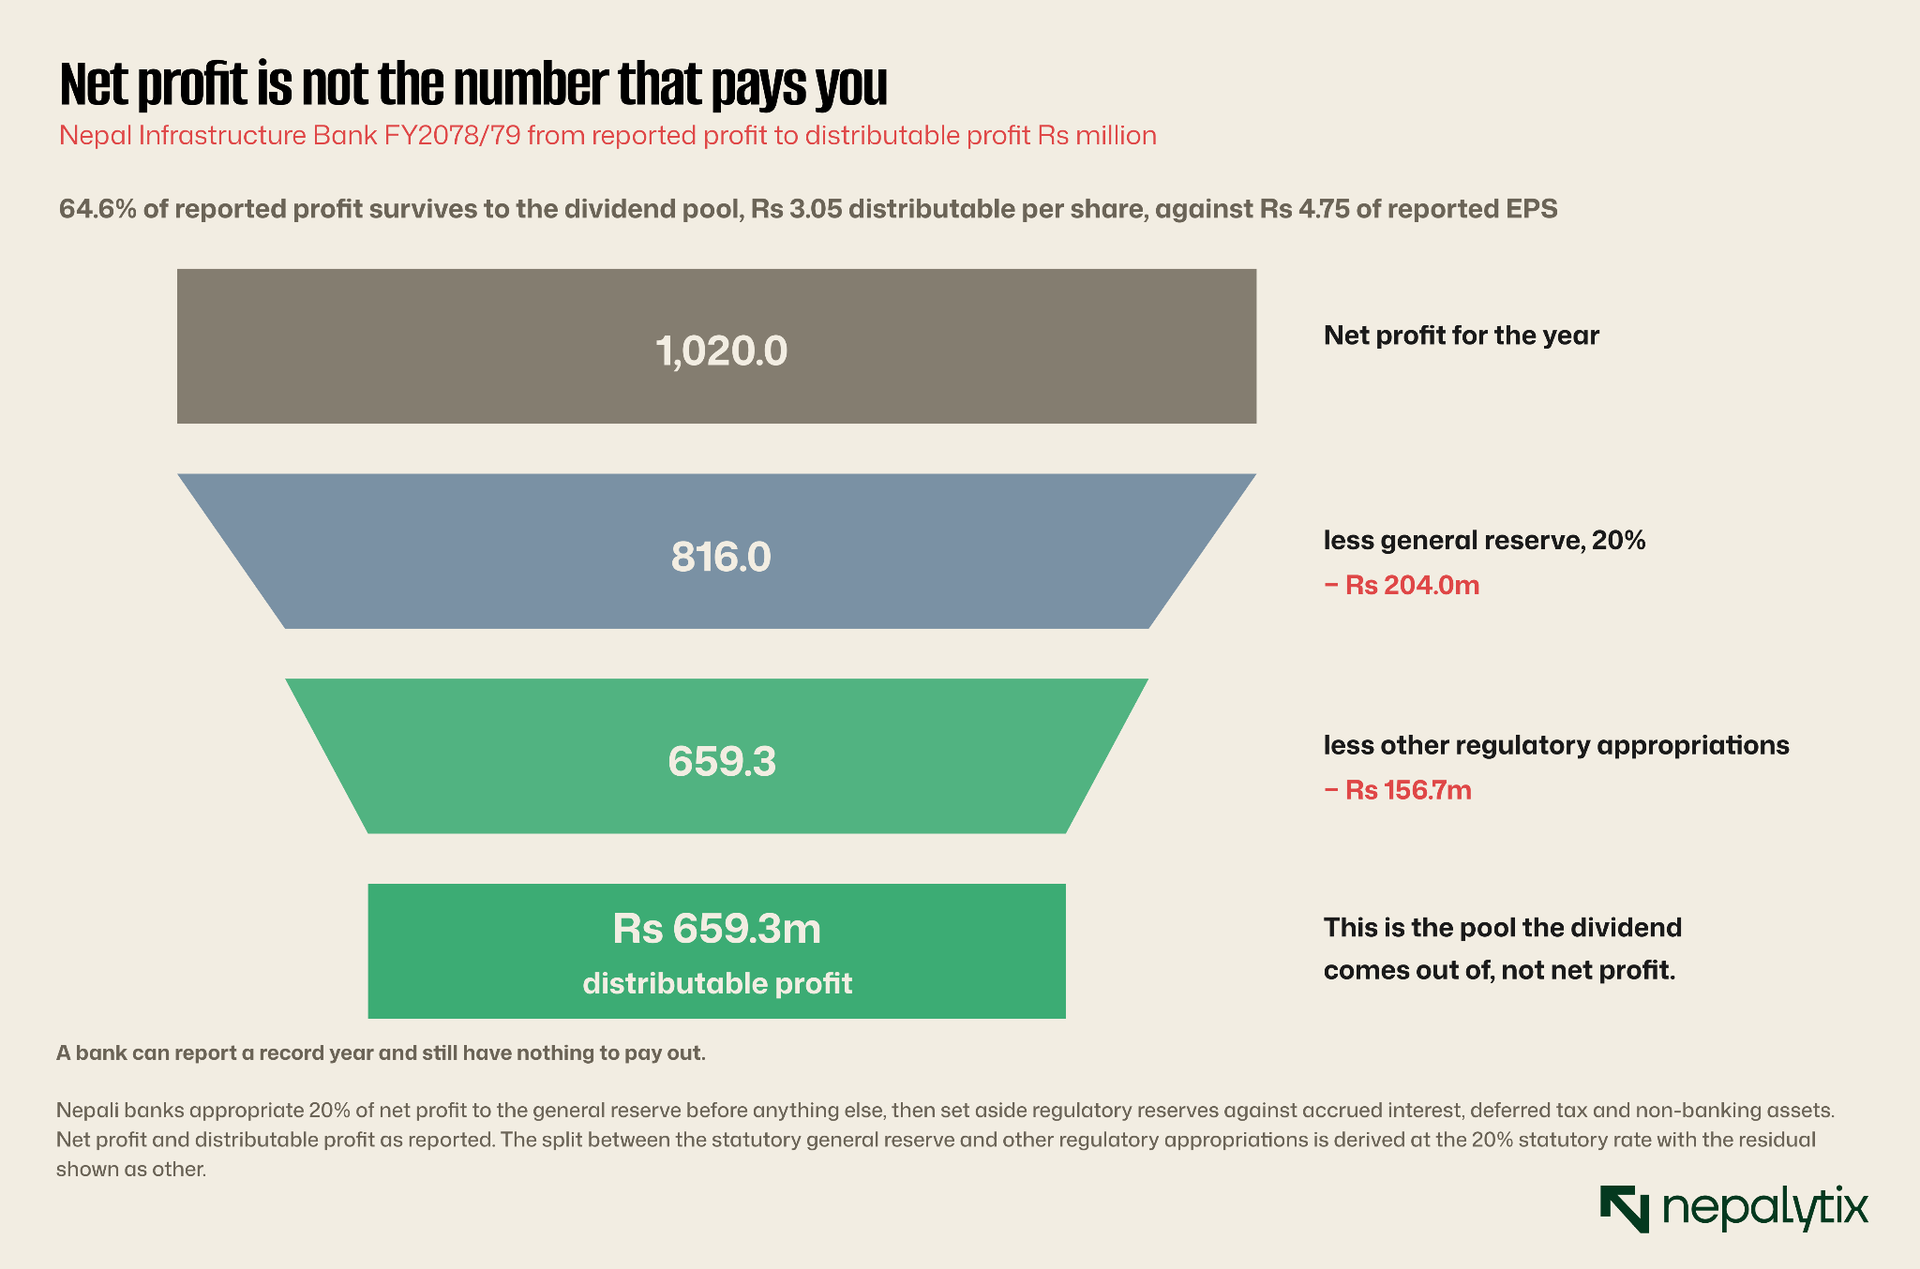
NIFRA in FY2078/79 reported net profit of Rs 1,020 million and distributable profit of Rs 659.3 million. Reported EPS was Rs 4.75. Distributable EPS was Rs 3.05. An investor working off the reported figure would have overestimated the dividend capacity by more than half again.
Two years later the ratio was worse. In FY2080/81 NIFRA reported EPS of Rs 6.16 and distributable EPS of Rs 3.27 only 53% of reported profit reached the distributable pool. Reported earnings had risen; distributable earnings had not kept pace, because the regulatory reserves absorbed the difference.
This is not a NIFRA problem. It is structural and the ratio varies enormously between institutions depending on asset quality. A bank carrying a lot of accrued-but-unreceived interest or holding property it seized from defaulters, will convert a much smaller share of reported profit into distributable profit than a clean lender will. The conversion ratio is therefore one of the more informative numbers in the whole document and almost nobody looks at it.
What to do with it
Find distributable profit in the Q4 report and divide it by net profit. Track that percentage across three or four years for the same bank, then compare it against peers.
A ratio that is stable and high indicates clean earnings. A ratio that is falling while reported profit rises is the single clearest early warning of deteriorating asset quality available in a Nepali bank's public disclosure and it shows up here well before it shows up in the headline NPL figure.
The true-up quarter
There is a reason the fourth quarter is the noisiest three months of any Nepali company's year and it has nothing to do with the business.
Through Q1, Q2 and Q3, management reports against internal estimates. Provisioning assumptions, accruals, depreciation schedules, staff bonus calculations, deferred tax positions all carried at whatever the company judged reasonable at the time. At year end, all of it has to be trued up against reality before the auditor arrives.
The result is that Q4 standalone almost always contains items that belong to the preceding nine months. A provisioning charge that should have been spread across the year lands in one quarter. A tax position gets recalculated. An impairment reversal shows up as pure profit in a three-month window.
NIFRA's FY2081/82 Q4 report showed exactly this: an impairment reversal of Rs 44.2 million in the quarter, against a provisioning charge in the comparable period. That single line swung the quarter, and it says nothing about how the bank traded between Baisakh and Asar.
The practical consequence is that Q4 standalone is close to meaningless as a run-rate. If you want to know what a company earns in a normal quarter, use Q1 through Q3 and treat Q4 as the year's clearing house. If you want to know what the year was worth, use the cumulative column. Do not use Q4 standalone for either purpose, and be sceptical of anyone who annualises it.
Three items produce most of the Q4 noise in Nepal and it is worth knowing them by name. Staff bonus is a statutory share of profit, so it is calculated properly only once the year's profit is known which means a chunk of it can land in the fourth quarter. Deferred tax gets recalculated at year end against the actual position and the adjustment flows straight through the tax line. Impairment is reassessed against the year-end loan book so a bank that under-provided through the year takes the catch-up in Q4 and one that over-provided releases it.
None of the three tells you anything about trading in the fourth quarter. All three land in it. This is why a company can post three quiet quarters and a spectacular or catastrophic fourth one without its underlying business having changed at all and why the financial press writes a surprised paragraph about it every single year.
It also explains why the audit adjustment exists at all. The true-up is management's best attempt under deadline pressure at reconciling twelve months of estimates. The auditor's job is to disagree where warranted and in NIFRA's case that disagreement was worth Rs 93.4 million.
One more consequence worth naming. Because Q1 to Q3 annualised EPS is an extrapolation, it embeds an assumption that the rest of the year looks like the part already reported. For a business with genuine seasonality, a hydropower company through the monsoon, a hotel through the trekking season, a bank booking its staff bonus at year end that assumption is simply wrong and the printed annualised figure will be wrong in a predictable direction. Knowing which direction is most of the edge.
A bank's Q4 and a manufacturer's Q4 are different documents
The format looks identical. The information content is not.
A bank's Q4 report is heavily prescribed by Nepal Rastra Bank and carries a specific set of regulatory disclosures: capital adequacy ratio, non-performing loan ratio, cost of funds, net interest spread, distributable profit. These are the numbers that matter and they are all there. Net profit is almost the least informative figure in a bank's quarterly.
A manufacturer's Q4 has none of that. What it has instead is a balance sheet you can interrogate. Inventories, trade receivables, property and plant. Those three lines against revenue tell you most of what you need.
Unilever Nepal's FY2081/82 Q4 is a good illustration. Revenue rose 0.07%. Trade receivables rose 30.13%. Receivable days went from 48.9 to 63.7 nearly fifteen extra days of credit extended on a flat top line. Nothing in the profit statement flags that. It is visible only if you compute it and it may be the most important thing in the document.
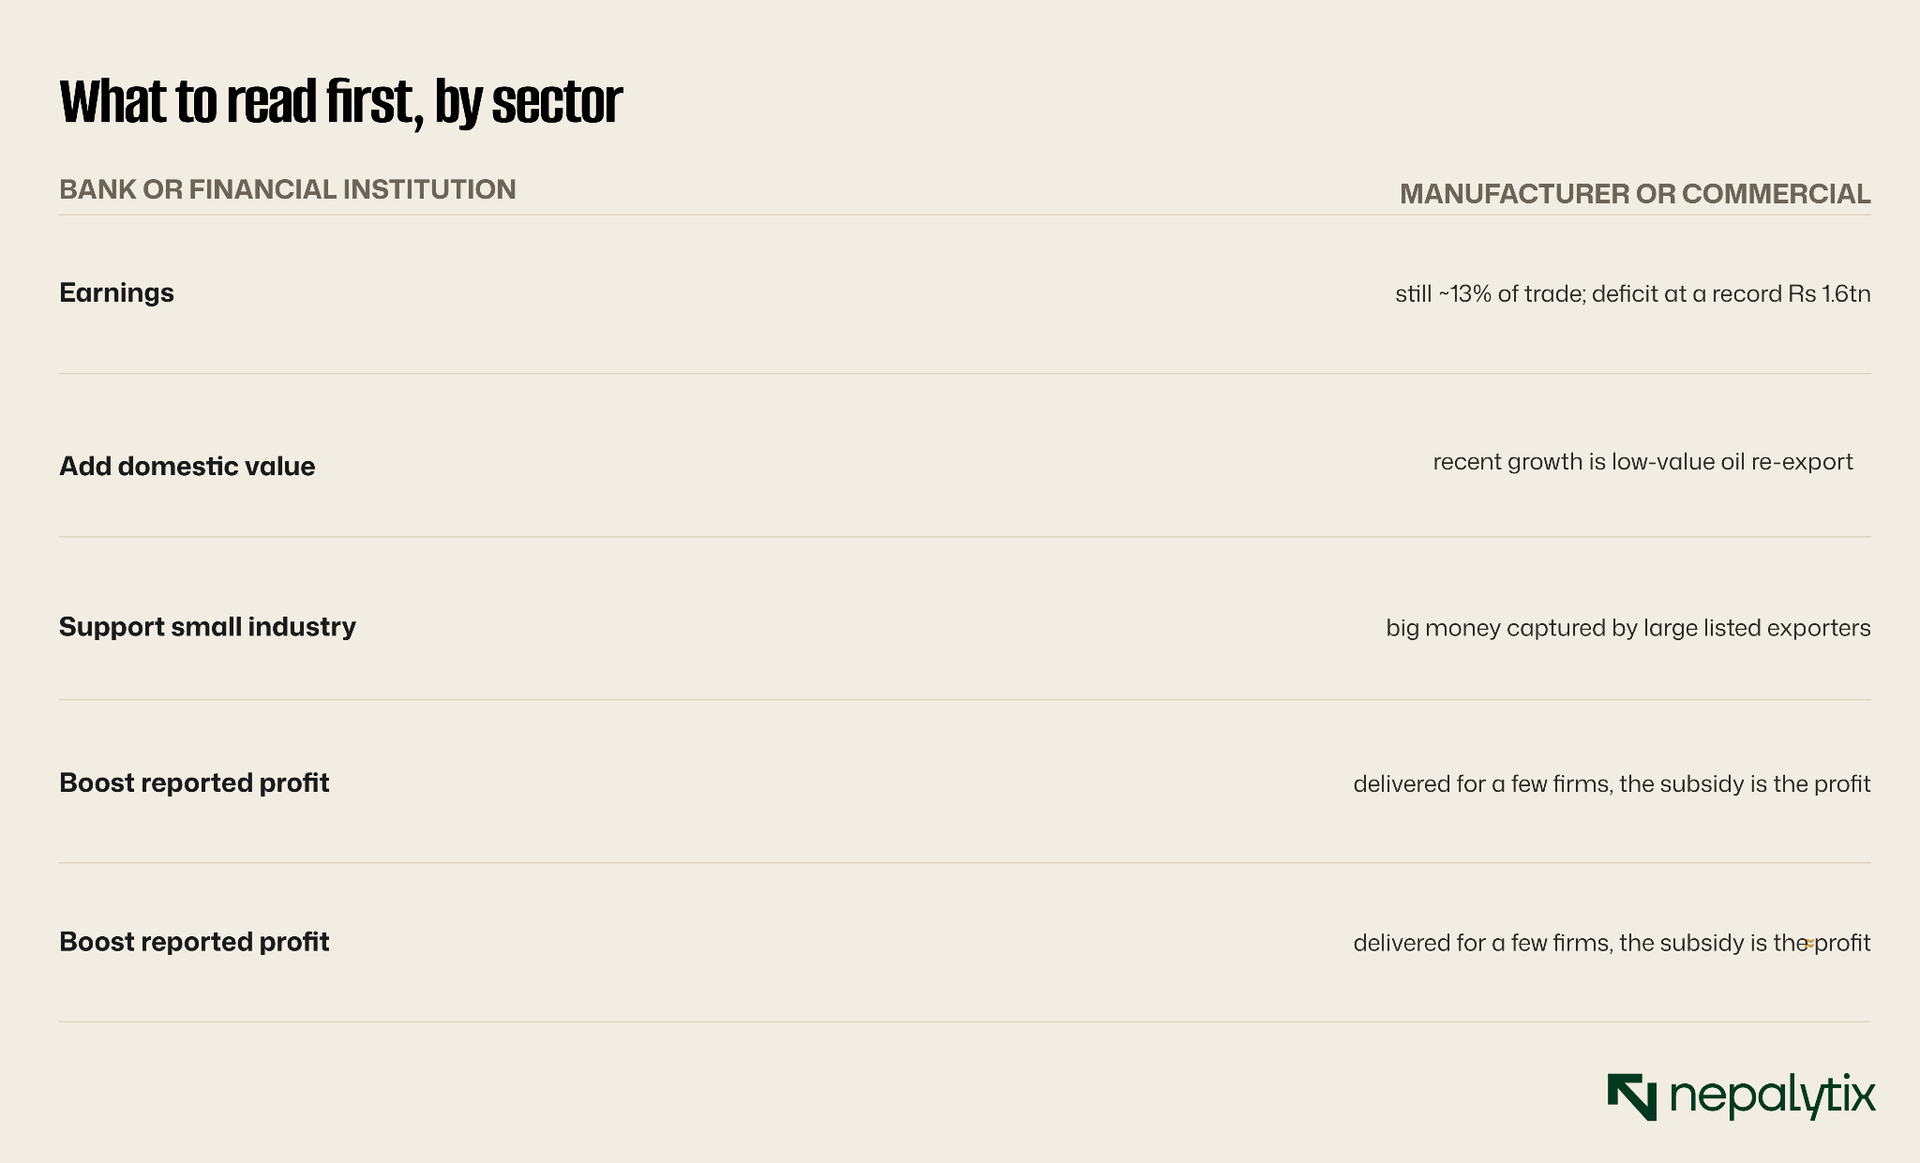
The same discipline applies to any company where the parent sits abroad. A Nepali subsidiary of a foreign group carries charges set outside Nepal royalties, central service fees, technology recharges and those charges are a policy variable not an operating outcome. They can be levied, reduced or waived. In the Q4 report they are invisible, buried inside operating expenses. In the annual report's related-party note they are itemised. If you are analysing a multinational subsidiary, the Q4 report is the beginning of the work rather than the end of it.
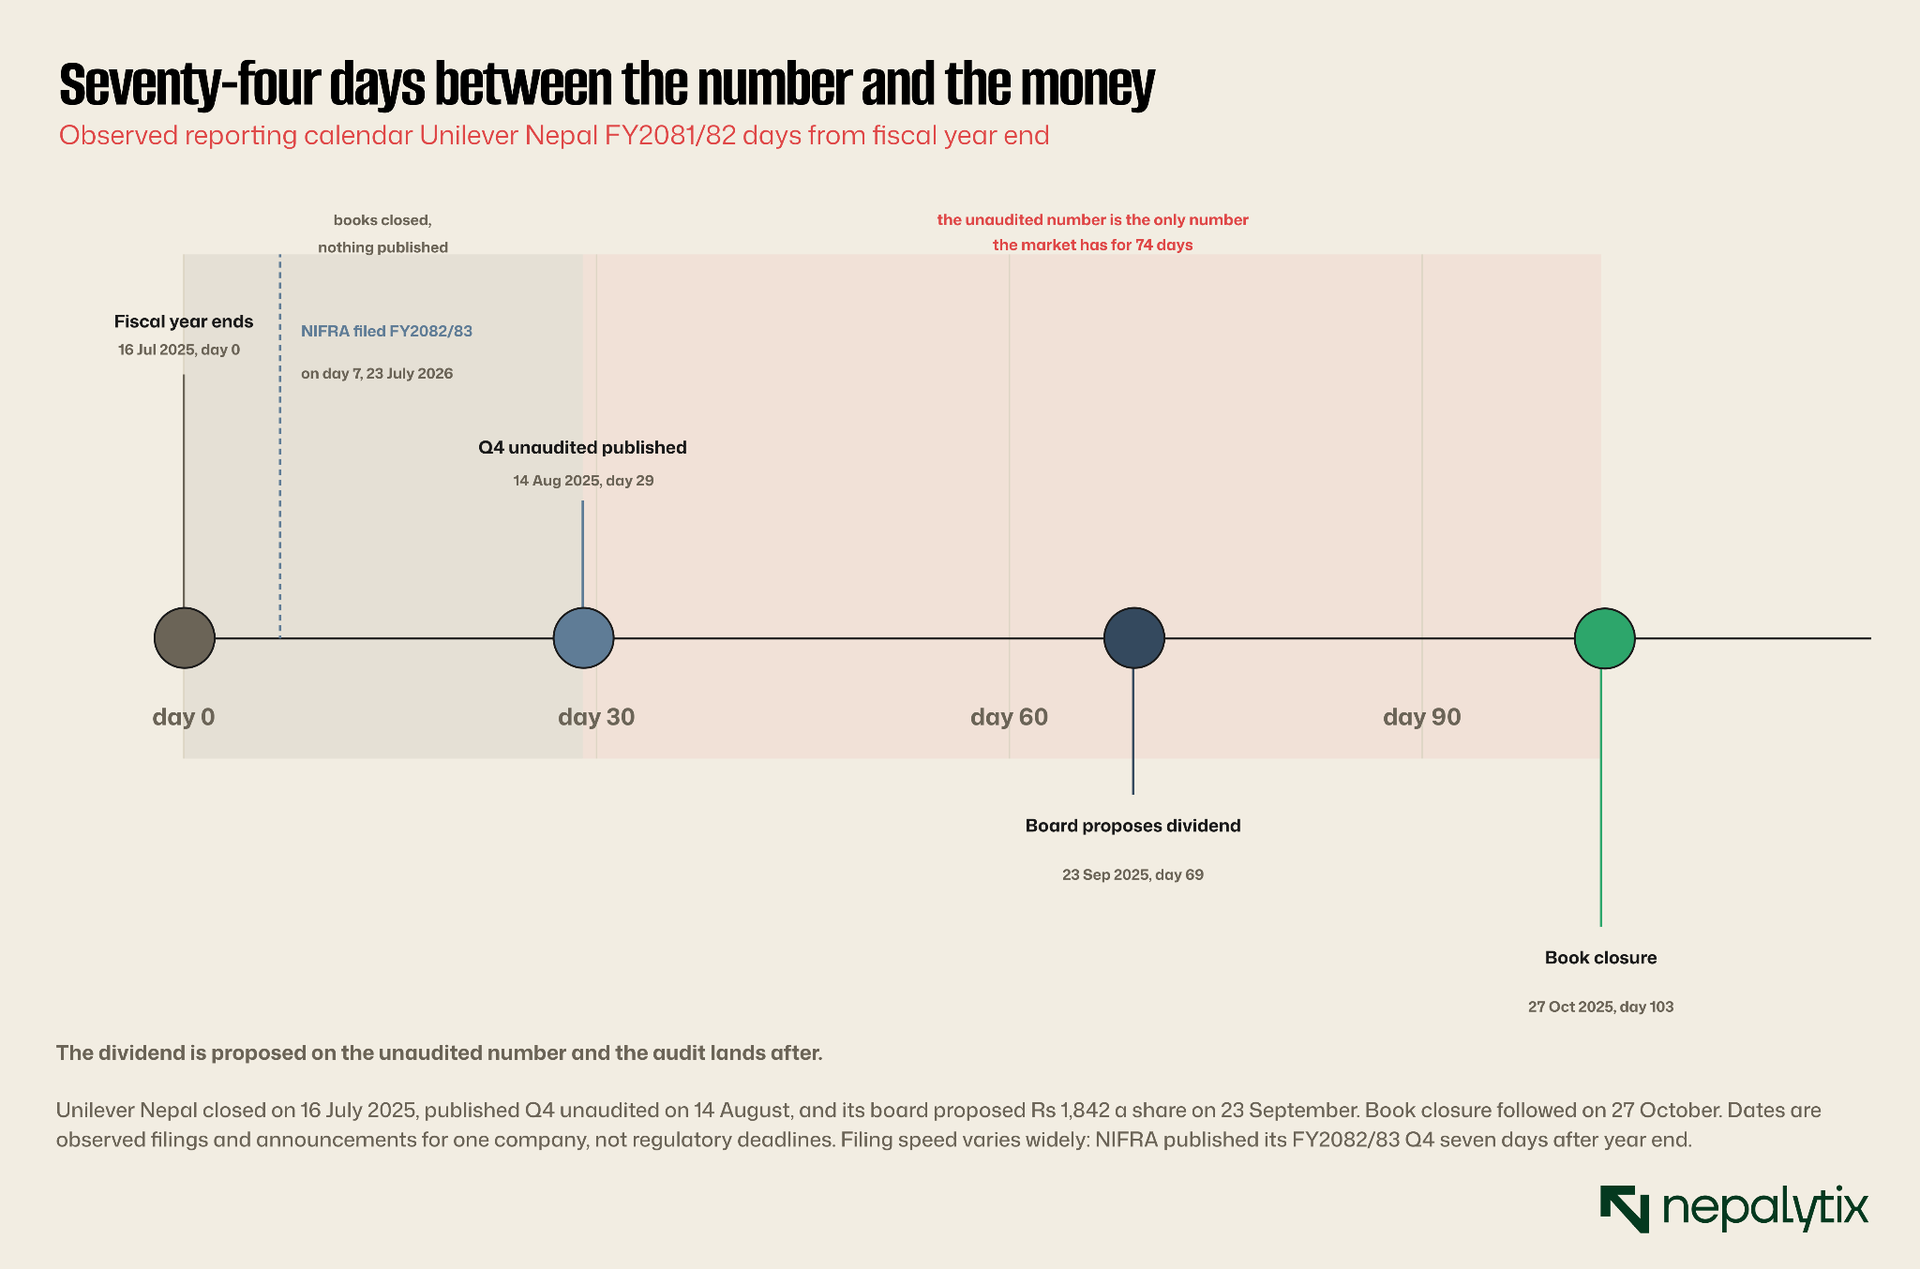
The timeline matters because of what sits inside it. The dividend is proposed on the unaudited number. The board meets, reads the same draft you are reading and commits to a figure and the audited accounts follow afterwards. For seventy-four days between the Q4 filing and book closure, an unaudited estimate is the only number the market has.
That is not an argument for ignoring Q4 reports. It is an argument for reading them as what they are: a well-informed draft, published fast, by people with an incentive for it to look settled.
Finally, know what a Q4 unaudited report does not contain, because the omissions are as informative as the contents.
There is no auditor's opinion which is the whole point. There are no detailed notes to the accounts, the schedules that break out related-party transactions, contingent liabilities, segment results and the composition of other income are in the annual report, not here. The cash flow statement is frequently abbreviated or absent which matters because profit and cash diverge most in exactly the situations you would want to catch. And there is no directors report and no corporate governance disclosure.
The practical effect is that a Q4 unaudited report tells you what happened to profit but very little about how. If a company's other income jumped, the Q4 report will show you that it jumped and not what it consists of. If a manufacturer is paying a large royalty or service charge to its parent, that is a related-party note, and the related-party note is months away. For anything structural, the Q4 report raises the question and the annual report answers it.
The checklist
Everything above, compressed into the order you should actually work through a Q4 report. It takes about fifteen minutes per company once the habit is built.
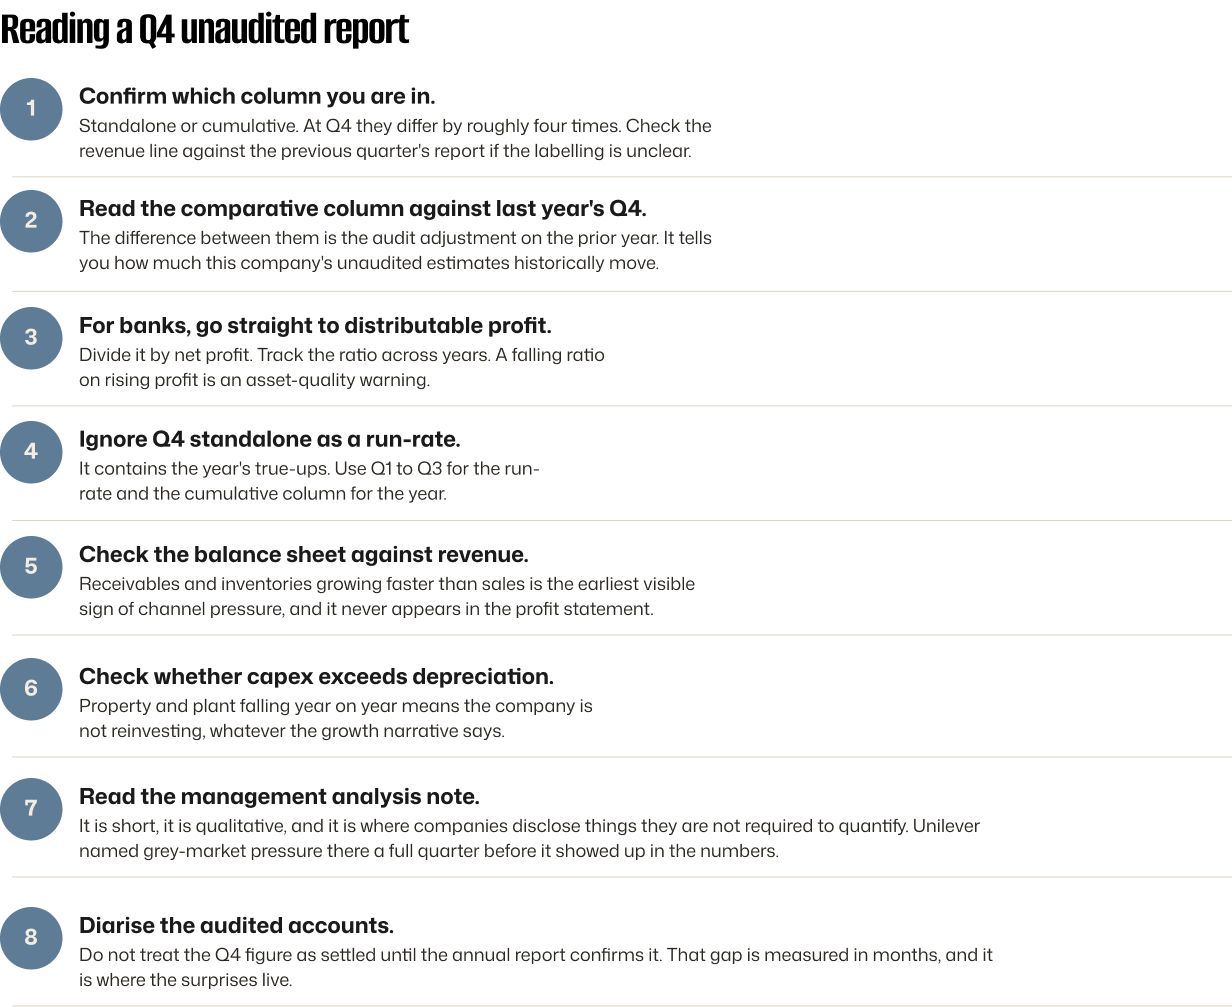
None of this requires a valuation model. It requires reading the document in the right order and knowing which three or four numbers carry the information. Most of the market reads the headline and stops. The gap between the headline and the document is where the work is.
Disclaimer
This report has been prepared by Nepalytix for informational and educational purposes only and does not constitute investment advice, an offer, or a solicitation to buy or sell any securities.
The information contained in this report is based on sources believed to be reliable; however, Nepalytix does not guarantee its accuracy, completeness, or timeliness. Opinions, estimates, and projections expressed herein are those of the authors as of the date of publication and are subject to change without notice.
Investing in securities involves risks, including the possible loss of principal. Past performance is not indicative of future results. Readers are advised to conduct their own independent research and consult with a qualified financial advisor before making any investment decisions.
Nepalytix and its contributors may hold positions in the securities discussed in this report at the time of publication or thereafter.
Neither Nepalytix nor any of its affiliates accept any liability for any loss arising from the use of this report or its contents.