How To Read an Insurance Company
Insurance companies are not banks, and reading them like banks leads to costly mistakes.

Every instinct a banker brings to an insurer's accounts misfires. The capital ratio is the wrong ratio, the profit hides in the wrong line and the biggest number on the balance sheet is a liability. Here's the playbook that actually works on Nepal's listed insurers.
The first thing a banker notices opening an insurance company's accounts for the first time is that none of the instincts transfer. The capital ratio isn't where it should be. The thing called profit arrives from a line that has nothing to do with the core business. The biggest number on the balance sheet is a liability the company hopes never to pay. Everything that makes a bank legible: the loan book, the net interest margin, the cost of funds is either missing or means something else entirely.
That is not a flaw in the reader. It is the nature of the business. A bank takes money in, lends it out and earns the spread. An insurer does something stranger: it sells a promise before it knows what that promise will cost. The premium arrives today; the claim, if it comes at all, arrives months or years later. In between, the insurer holds your money and invests it. That gap between cash collected and cash paid out is the entire game. Learn to read it and the rest of the statement falls into place. Miss it and you will value an insurer like a bank and be wrong every time.
Nepal now has a sector worth reading. After a brutal consolidation, fourteen life insurers, fourteen non-life insurers, a clutch of micro-insurers and two reinsurers are left standing, all under the Nepal Insurance Authority, the regulator that until 2079 was the Beema Samiti. The cull was deliberate. The Insurance Act of 2079 forced paid-up capital up to Rs 5 billion for life insurers and Rs 2.5 billion for non-life collapsing more than twenty non-life companies into fourteen and triggering a wave of mergers that produced names like Himalayan Life, Sanima Reliance and Prabhu Mahalaxmi. Gross premium crossed Rs 227 billion in FY 2081/82 up nearly 15 percent on the year. The sector is large, listed and almost universally misread. Here is how to read it instead.
That consolidation also leaves a practical trap for the reader. Many of today's insurers are two or three years old as legal entities but decades old as businesses, stitched together from predecessors with different reserving conventions, product mixes and book values. A year-on-year comparison that straddles a merger is comparing two different companies; a sudden jump in premium or a discontinuity in reserves can be an accounting artefact of the combination rather than anything operational. Before you trust a trend line on a Nepali insurer, check whether a merger runs through the middle of it.
The inversion: why profit hides in the wrong place
Start with the float because everything else is downstream of it. When you pay a premium, the insurer does not earn it on the spot. It books the cash, sets aside a reserve for the claims it expects, and invests the difference. Multiply that across hundreds of thousands of policyholders and the insurer is sitting on a large, slow-moving pool of other people's money: collected now, payable later invested in the meantime. That pool is the float and the income it throws off is, for most insurers, the difference between a good year and a bad one.
This is also why the largest single liability on an insurer's balance sheet is the reserve for unpaid and future claims, the formal accounting of a promise it hopes never to pay in full. Part of it is for claims already reported and not yet settled; part is an actuarial estimate for claims that have happened but haven't yet been reported, the line the industry calls IBNR. A bank's biggest risk lies in its assets: loans that go bad. An insurer lies in its liabilities: reserves set too low. Under-reserving flatters this year's profit and detonates a future one so the adequacy of reserves is something a careful reader probes rather than takes on faith.
Trace a single rupee of non-life premium through the business and the structure becomes physical.
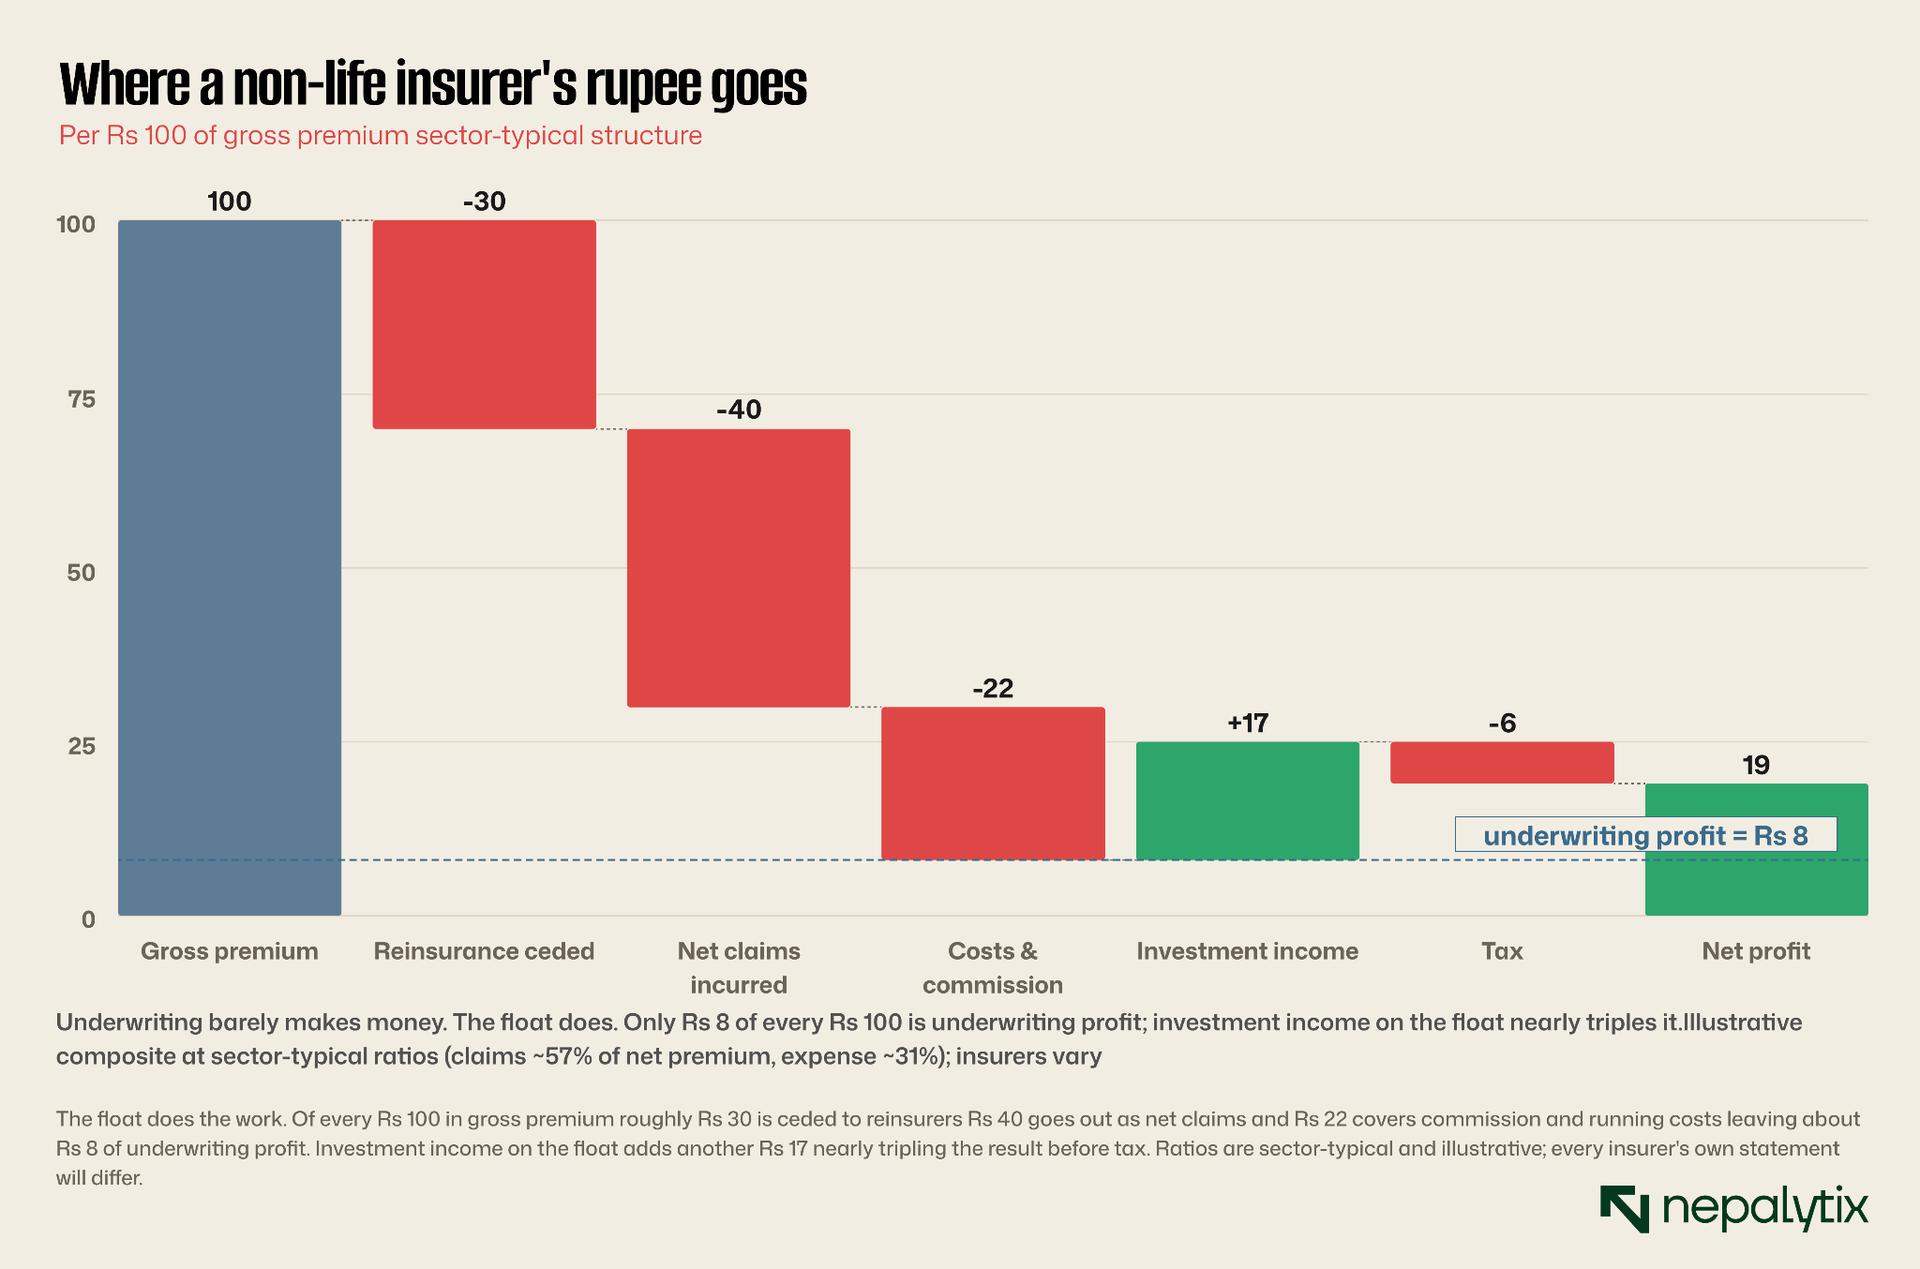
This is the inversion. For a bank, the core business is the profit engine; investment income is a sideline. For an insurer, the core business, underwriting, often barely breaks even and investment income on the float carries the company. The single most useful number you can compute from a non-life insurer's accounts captures exactly this: the combined ratio which is the claims (or loss) ratio plus the expense ratio. Below 100 percent, the company makes money simply by underwriting. Above 100 percent, it is paying out more than it takes in and relying on the float to bail it out. A combined ratio of 105 is not automatically a disaster, since a strong investment book can cover it, but it tells you the underwriting discipline is loose, and in a bad year for markets there is nothing to fall back on.
In Nepal the claims side is volatile in a way the metric makes visible. The sector's outstanding non-life claims jumped past Rs 8 billion in FY 2081/82, a rise of more than 12 percent, with insurers pointing to floods, landslides and unrest, a reminder that a non-life book is a concentrated bet on the country's physical and political weather. One bad monsoon can turn a comfortable combined ratio into a loss. So the first two questions to ask an insurer are not the questions you would ask a bank. Not "how big is the loan book" and "what is the margin," but: does the underwriting make money on its own, and how much of the profit is really just investment income on the float? An insurer living entirely off its float is a bond fund wearing an insurance license.
The reinsurance layer
Notice that of the first Rs 100 nearly a third left the building before any claim was paid, ceded to reinsurers. This is the layer most readers skip and it carries two lessons. The first is why it exists: no Nepali insurer has the balance sheet to absorb a catastrophic year on its own so it buys insurance on its own book, passing a share of both premium and risk up the chain. The more volatile the line (aviation, large property, anything catastrophe-exposed), the more is ceded. A high cession ratio is not weakness; it is prudence, up to a point.
The second is where it goes. A mandatory share of every insurer's business goes to the national reinsurer, Nepal Re, a public-private company with Rs 11.65 billion of paid-up capital and the government as its largest shareholder. Nepal Re also runs the industry pools for motor third-party liability, foreign-employment and aviation. A second, private reinsurer, Himalayan Re, has since entered, and its early results have been rough, which itself tells you something: reinsuring a small, catastrophe-prone market is hard, and the economics of a second player are unproven. For the reader, the cession line is a risk to weigh, not a number to ignore. An insurer too dependent on reinsurance is renting someone else's balance sheet; one too thinly reinsured is exposed the year the flood comes.
Solvency, not CAR
The capital ratio you are looking for is not the Basel CAR. Insurers run on a solvency ratio available solvency margin divided by the minimum the regulator requires. The Nepal Insurance Authority sets the floor at 1.3 for non-life insurers, and a higher bar for life. A ratio of 1.0 means the company has exactly the cushion required; below that, it is technically impaired. The logic is the bank's CAR turned toward a different risk: not "can it absorb loan losses" but "can it pay claims even if they all come at once." Pull the non-life sector's solvency ratios and a peculiar picture emerges.
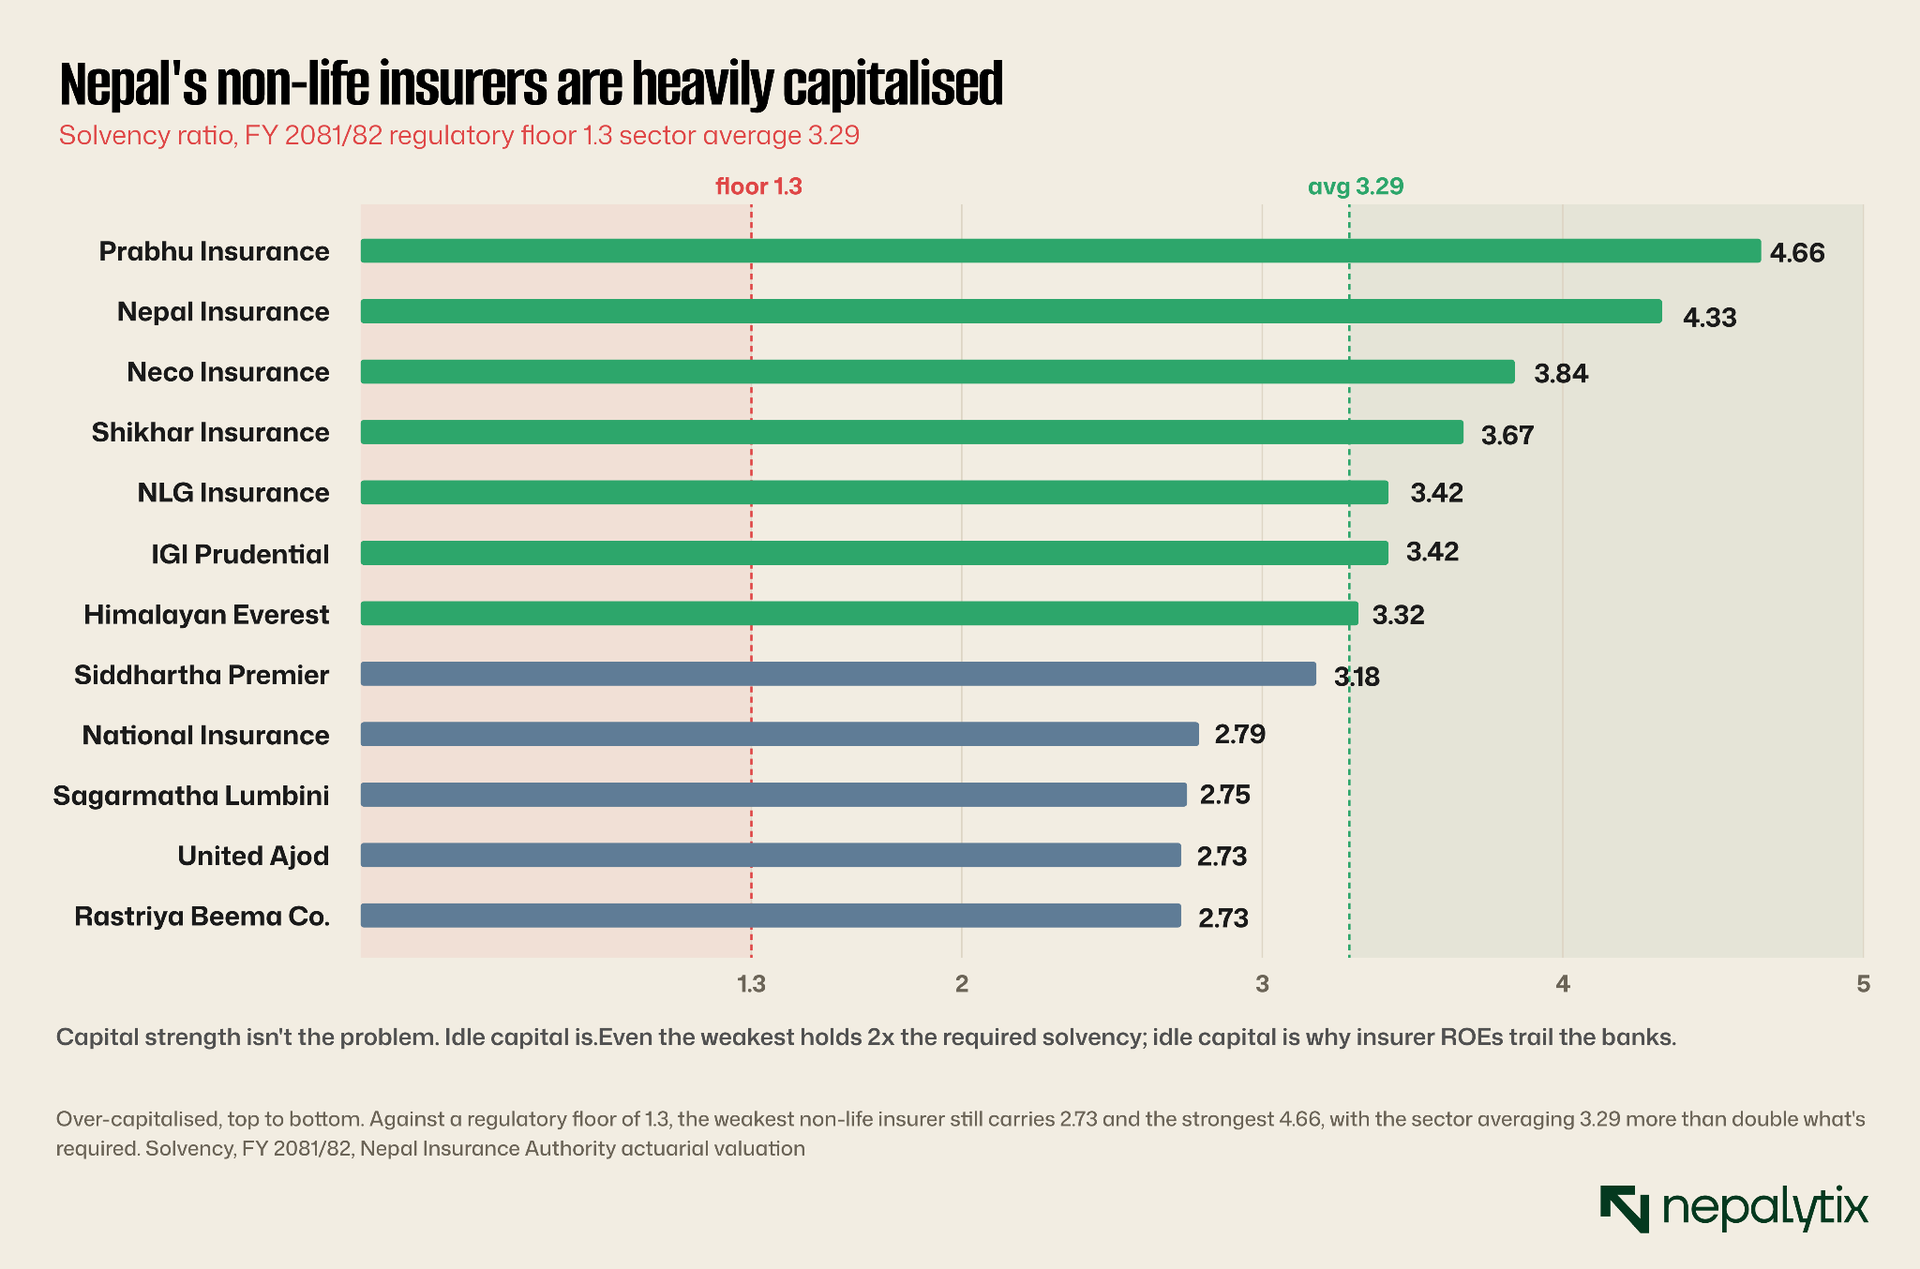
But read it correctly. The headline that every insurer sits well above the floor sounds like unambiguous good news and for a policyholder it is. For an investor it is more double-edged. Capital held against claims that may never come is capital not being put to work. A solvency ratio of 3.29 against a 1.3 requirement means the average non-life insurer carries more than twice the cushion it needs and that idle capital is a large part of why insurer returns on equity sit below the banks'. When you see a fortress solvency ratio, the next question is whether management has a plan to deploy the surplus, through growth, dividends or buybacks, or whether it is simply sitting there, dragging the return down. "Safe" and "rewarding" are not the same reading.
The flip side matters more. Because everyone is so far above the floor, the rare insurer drifting toward it is sending a real signal: rising liabilities, claims running ahead of reserves, or an investment book that has soured. A solvency ratio falling year on year, even from a comfortable level, deserves more attention than an absolute number, however high. With insurers, the direction of travel is the story.
Where the float goes
If the float is the engine, the investment book is the fuel line and in Nepal it runs mostly through one pipe: fixed deposits and government securities, with a smaller allocation to listed equities. That conservatism is sensible for money owed to policyholders, but it ties the sector's fortunes tightly to interest rates and rates have been falling. The same decline in deposit rates that has hollowed out bank and corporate interest income is quietly compressing the return insurers earn on their float. An insurer whose underwriting only just breaks even and whose float yield is sliding is being squeezed from both ends at once.
This is why the investment line deserves as much scrutiny as the underwriting line. Two non-life insurers with identical combined ratios can post very different profits depending on how their float is invested and what rates did that year. When you read the income statement separate the two engines explicitly: what did underwriting earn and what did the investment book earn? A company increasingly reliant on the second, in a falling-rate world, is running to stand still.
There is a reflexive twist here. Insurers are themselves large institutional buyers of NEPSE-listed shares, so the same market that prices their equity is partly propped up by their float. That can cut both ways: a market downturn dents the investment income that carries underwriting at the very moment claims may be rising, one more reason the investment line should be read as a risk, not a given.
Two businesses under one word
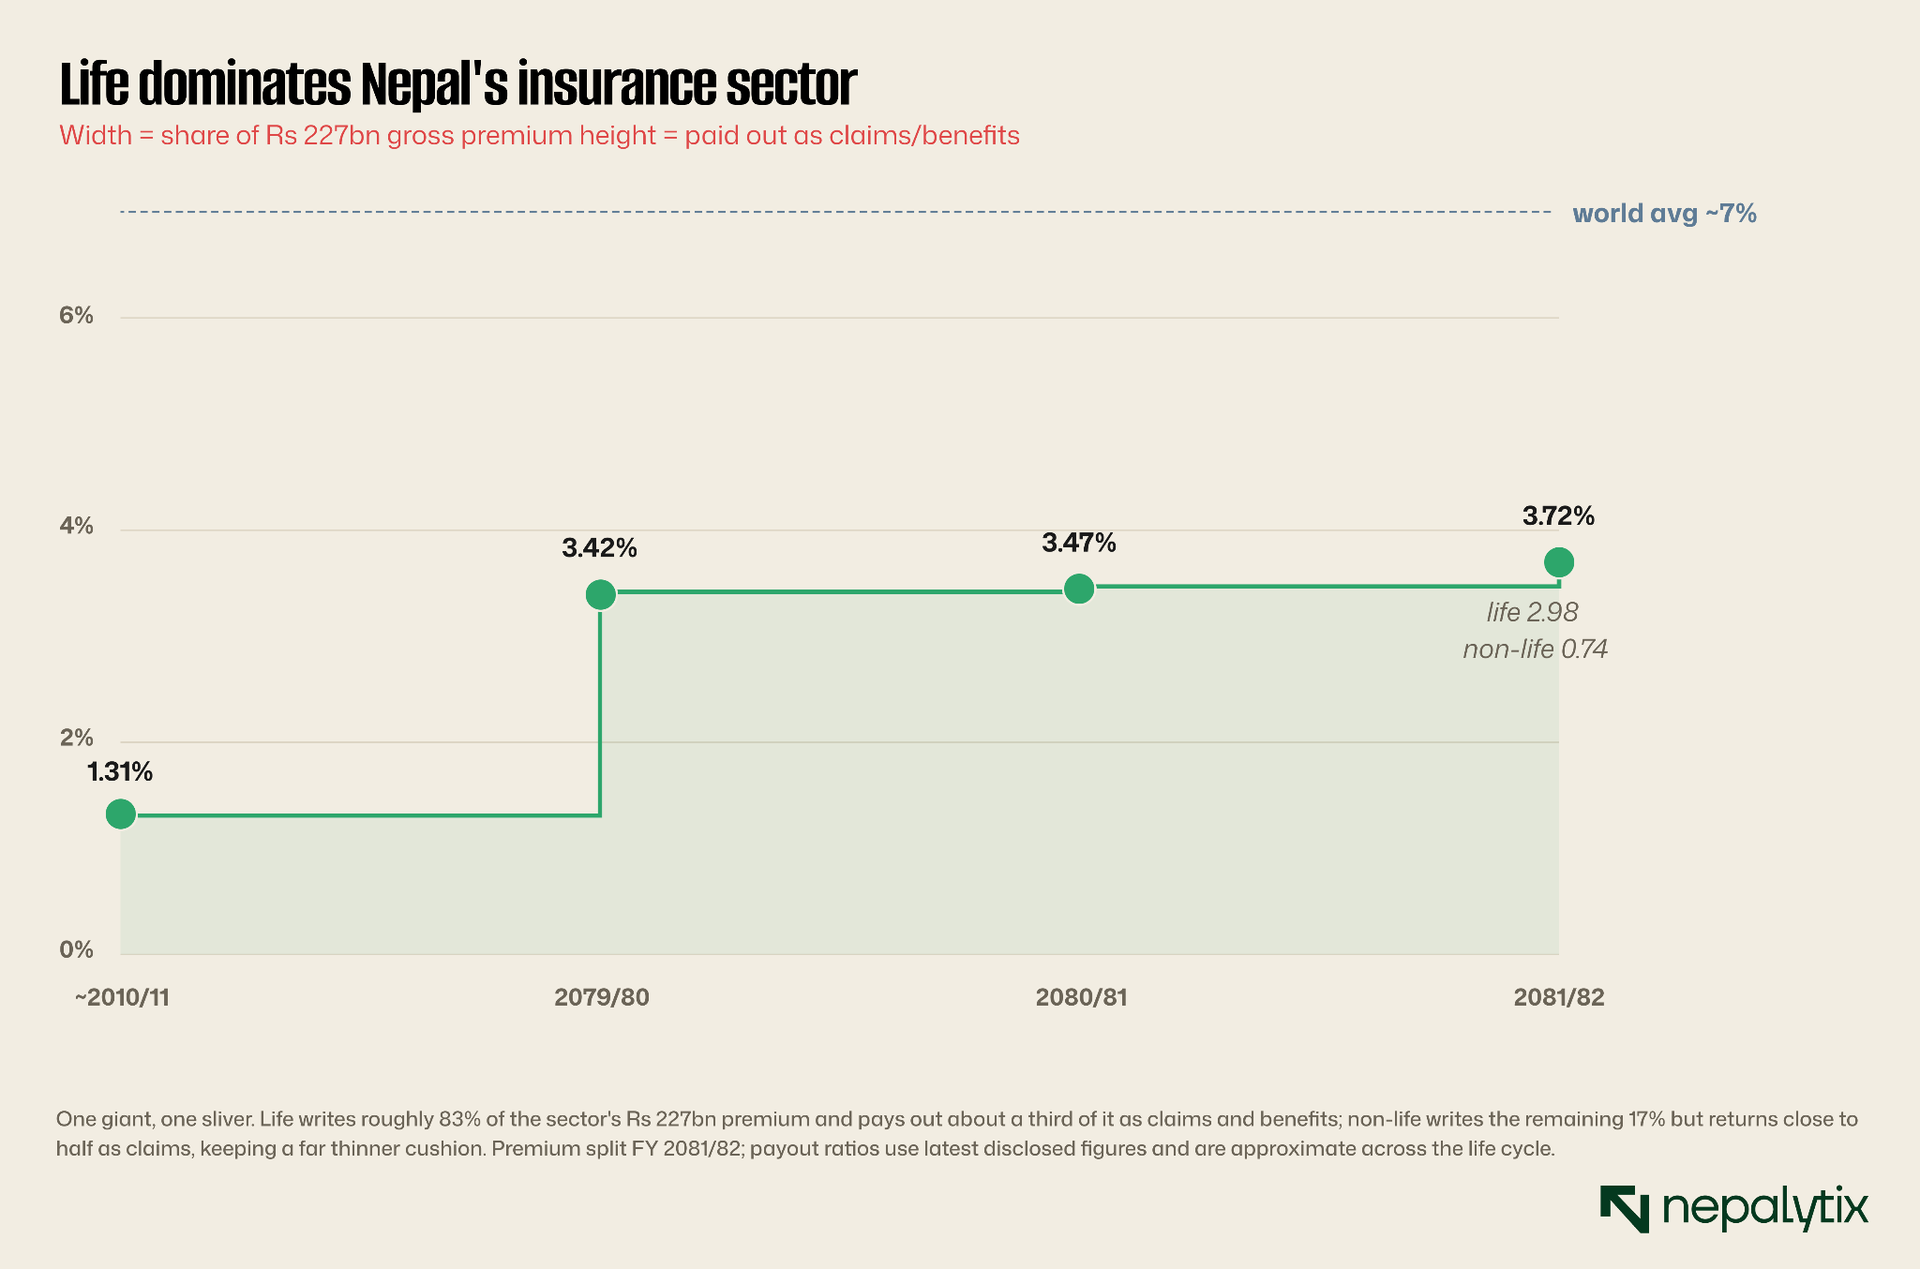
"Insurance" in Nepal are really two industries that share a regulator and almost nothing else. Life insurance sells long-dated savings-and-protection contracts; non-life (general) insurance covers motor, fire, property, marine, engineering and the rest on annual policies. They earn differently, pay out differently and must be read with different metrics. Putting them on one chart shows how lopsided the split has become.
The asymmetry is not just size. A non-life insurer's claims are lumpy and immediate (a flood season, a spike in motor accidents, a run of fire losses) and you read it the way you read a bank's credit book: on the quality and pricing of the risks it takes, the adequacy of its reserves, and the combined ratio that tells you whether it is pricing them to make money.
Within non-life, the motor is the line that dominates and the one to understand first. It is the largest single book for most general insurers, the most frequent source of claims and the place where pricing discipline shows up first. A motor book written too cheaply to win market share will quietly poison the combined ratio for years. Third-party motor cover is compulsory and runs partly through an industry pool, which spreads the worst losses but also means an insurer's motor result is not entirely its own to control. When a non-life insurer's claims ratio lurches, the motor is usually where to look.
Life is a different animal and the trap is valuation. A life insurer's profit emerges over decades. A policy written this year generates margin every year it stays in force, so this year's accounting profit, and the price-to-earnings ratio you might compute from it, tell you almost nothing. Worse, a life insurer that is growing fast can look unprofitable precisely because it is growing: the costs of writing new business commission, medicals, setting up reserves land immediately, while the profit dribbles in over the life of the policy. The industry calls this new-business strain and a reader who mistakes it for weakness will misjudge the fastest-growing insurers most badly.
The metric the industry uses instead is embedded value: the insurer's net worth plus the present value of all the future profit locked into policies already on the books. A life insurer trading below its embedded value may be cheap even on a punishing P/E; one trading at a large premium to it is pricing in growth that has to actually arrive. Alongside it, watch persistence the share of policies that stay in force rather than lapsing because a book that is quietly lapsing is an embedded value quietly evaporating and the first-year premium that looked like growth was just churn.
Don't count policies
Which brings us to the most common way a casual reader is misled. Insurers love to publish policy counts because a big number sounds like a big business. It often isn't. The right denominator is premium, and the gap between the two can be enormous.
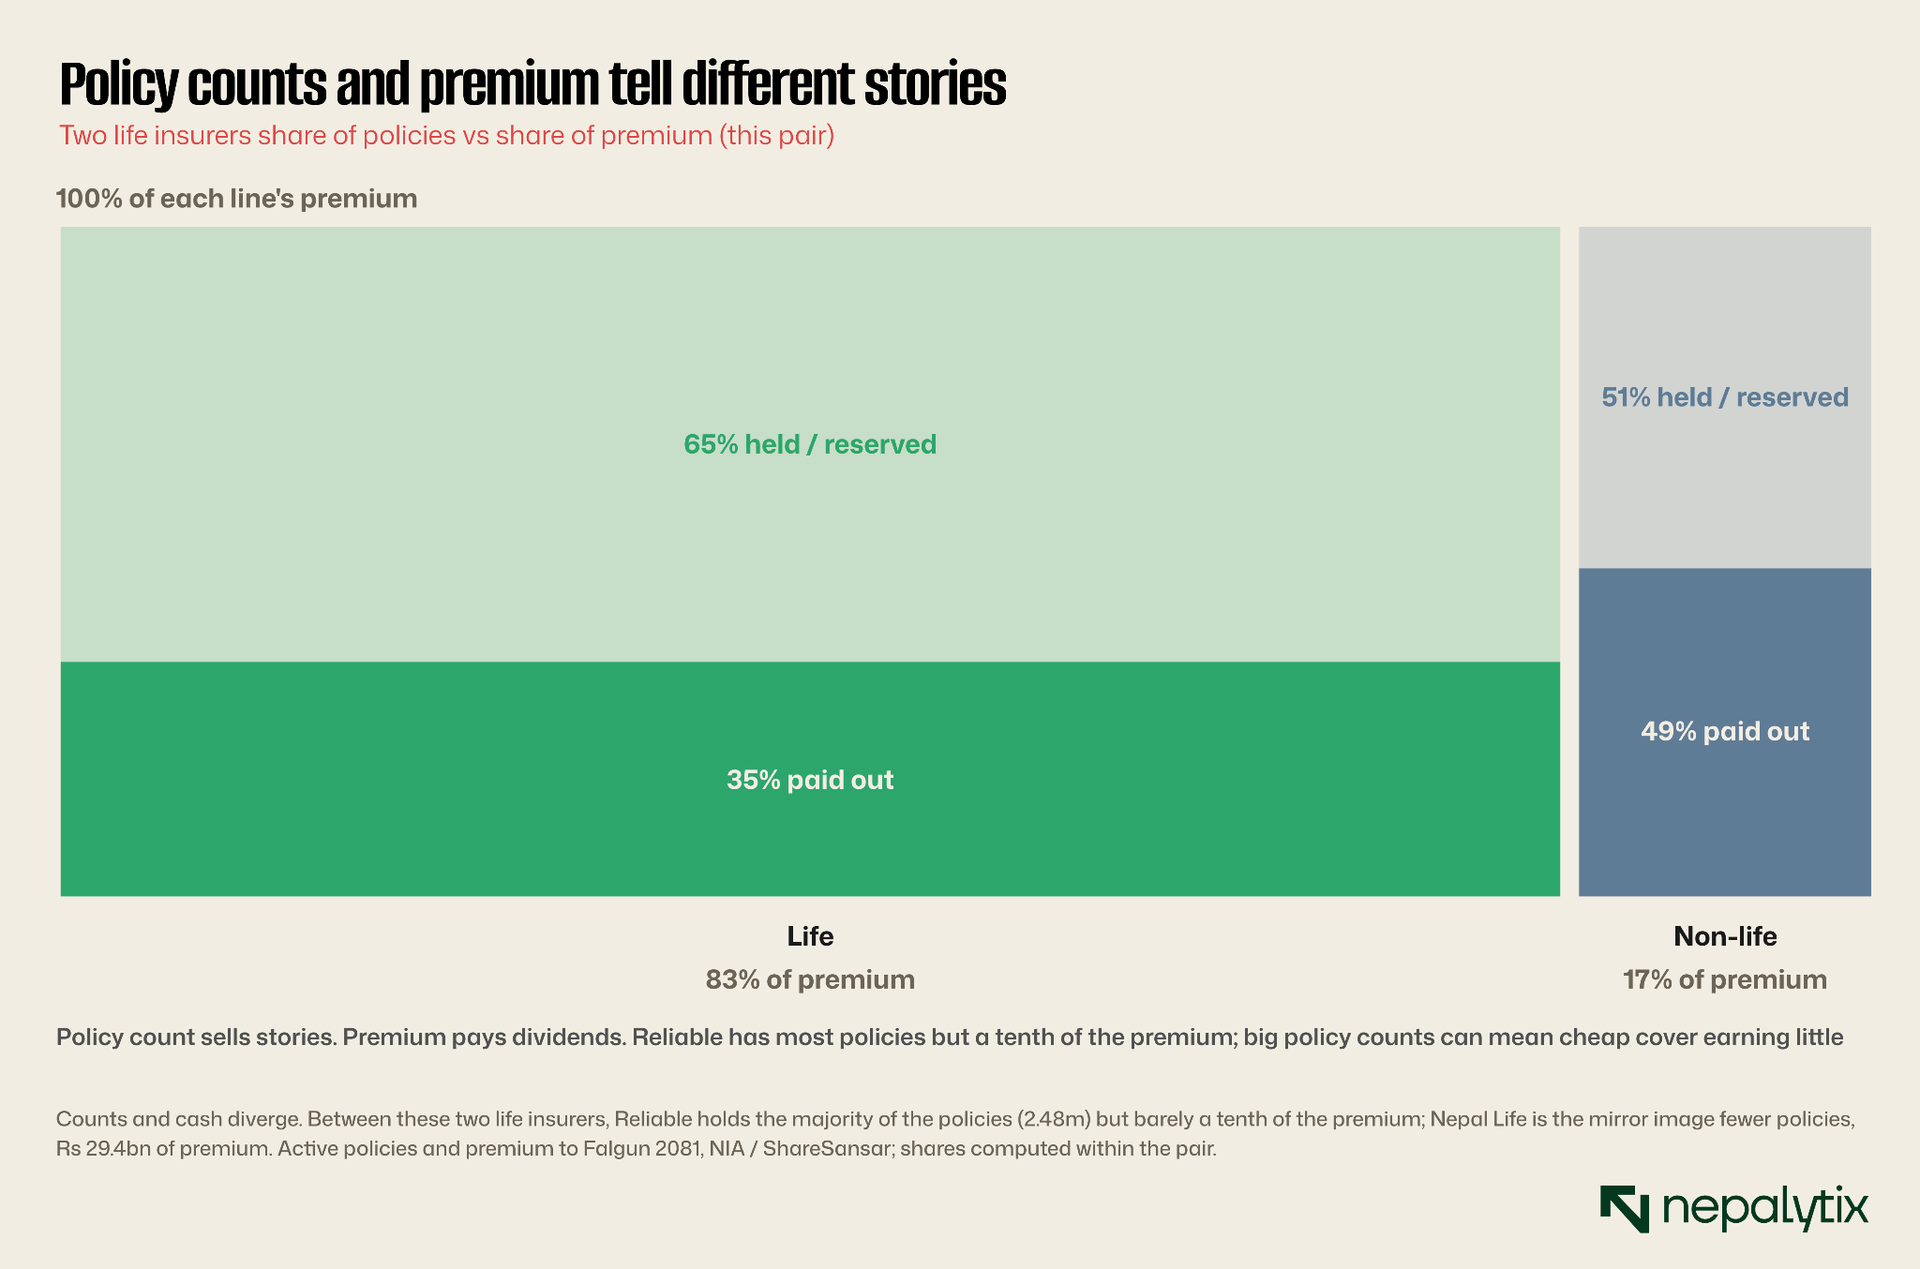
One insurer here has the most policies in the country and one of the smallest premium pools to show for it. The other has fewer policies and writes nearly ten times the premium. Neither is necessarily better run but they are completely different businesses, and a reader who stops at "millions of policyholders" will misjudge both. A high policy count paired with low premium usually means the insurer is selling cheap, small-ticket cover, often micro-policies or foreign-employment cover sold in bulk that earns it very little per contract. Premium per policy not policy count tells you what kind of business you are actually looking at.
How they trade
All of this reaches the investor through NEPSE where insurance is one of the larger sub-sectors with both life and non-life indices and the great majority of the country's insurers listed and trading. Two habits of the Nepali market shape any insurance valuation. The first is the bonus-share culture: rather than pay much of their surplus as cash, Nepali financial firms and insurers very much included distribute heavily in bonus shares partly a legacy of scrambling to meet that capital bar. That inflates share counts and makes per-share history hard to read without adjusting for it and it means a fat solvency surplus often comes back to you as more shares rather than more cash.
The second is that the market tends to price insurers on book value and growth rather than on the metrics that actually matter (combined ratio, embedded value, float yield), which is precisely the gap a careful reader can exploit. An over-capitalised insurer trading at a premium to book on the strength of "the insurance growth story may be a worse buy than a leaner one the market has overlooked. The penetration runway is real, but it is not evenly shared and the price already embeds a chunk of it.
The runway
Step back from the individual company to the market it sits in because the macro number reframes everything. Insurance penetration premium as a share of GDP is the single statistic that tells you how much of the business is still unwritten.
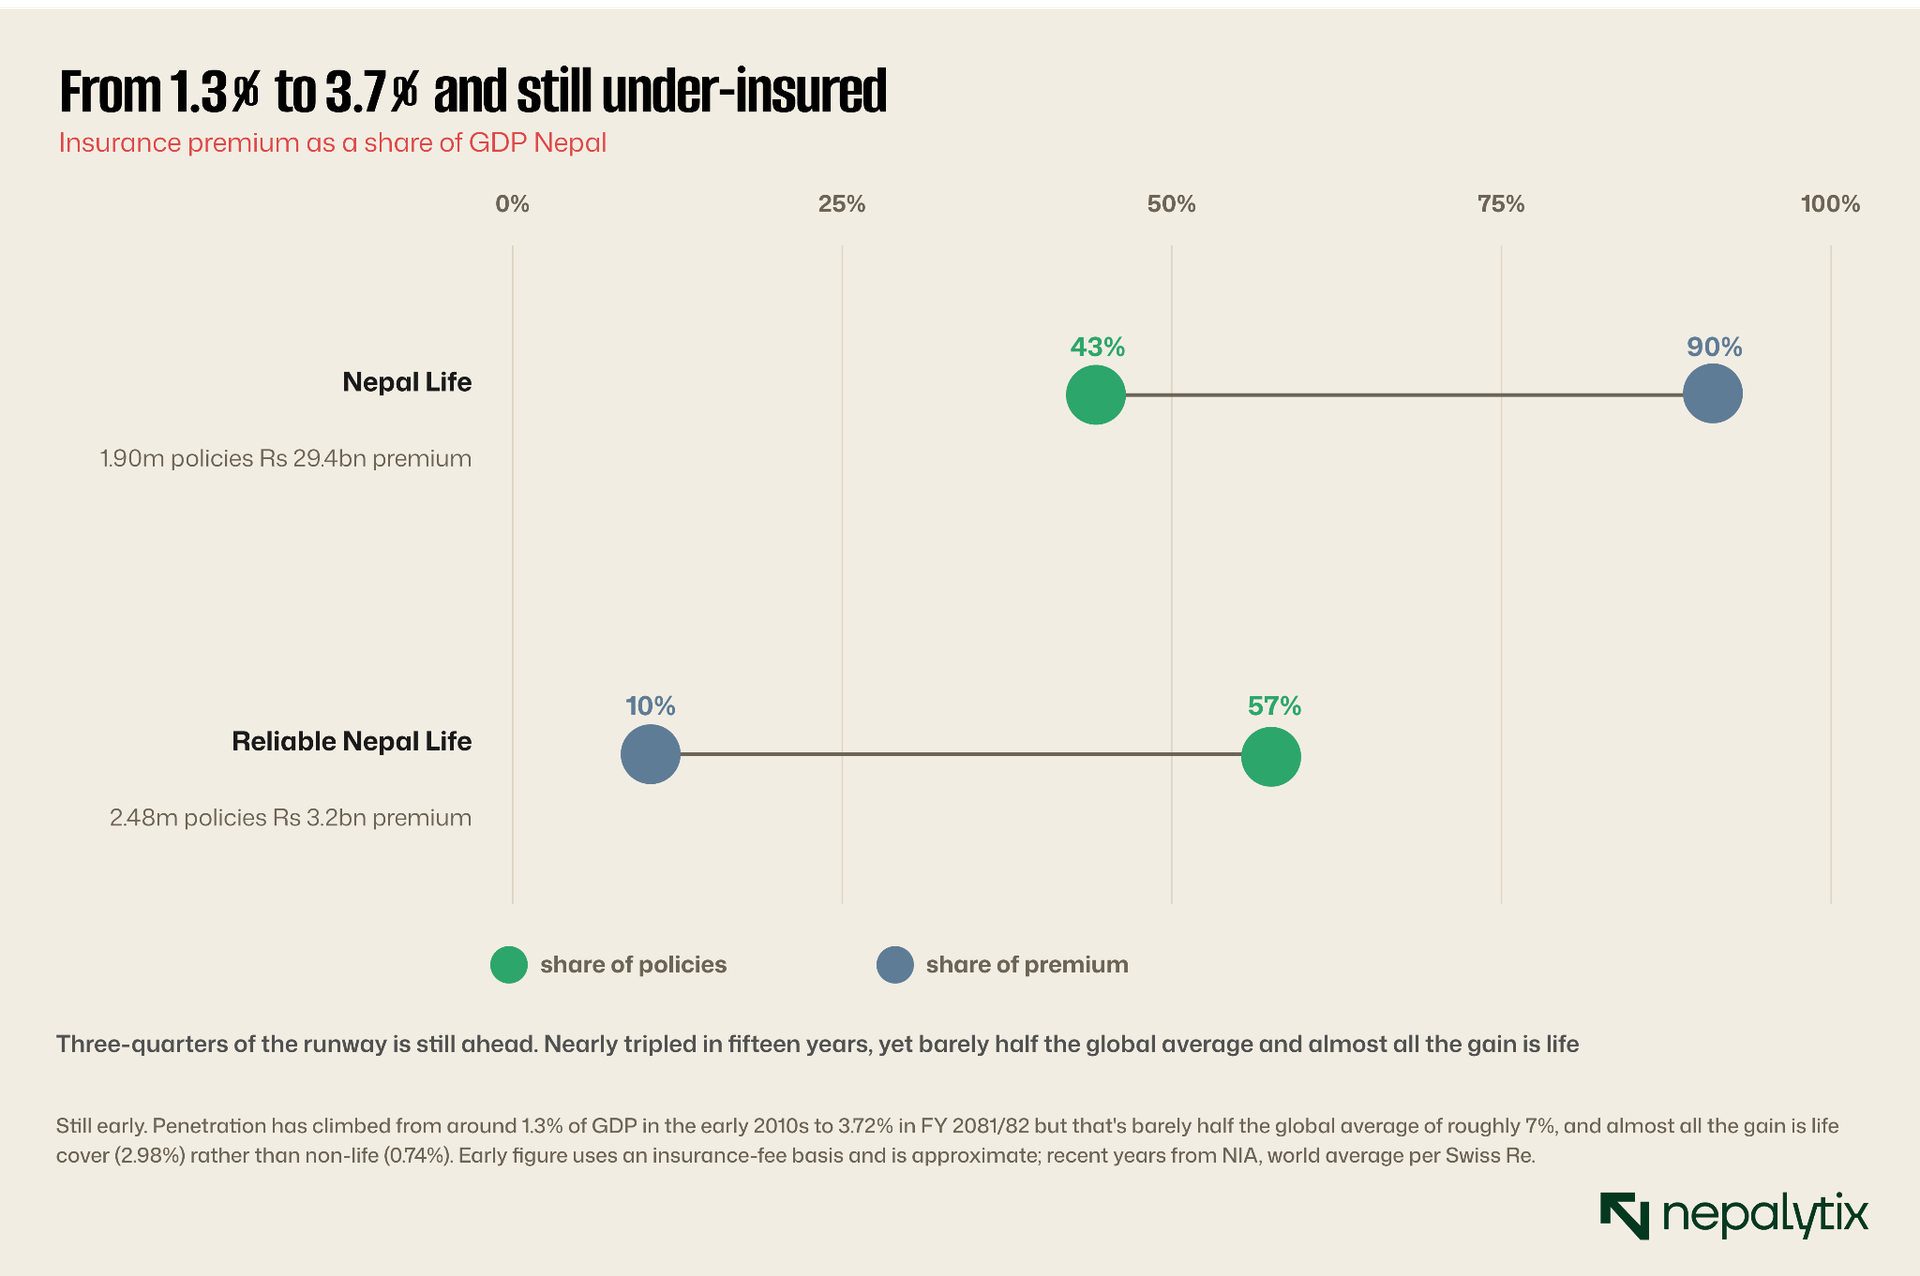
Two readings sit inside that line. The optimistic one is runway: a sector at half the world's penetration, in an economy still formalising, has years of structural growth ahead, and that is the bull case every insurance equity rests on. The cautious one is in the composition. Almost all the rise is life, and a large share of life cover is tied to foreign-employment policies, protection sold to migrant workers, which means the sector's growth is leveraged to remittance flows and labour migration as much as to rising domestic prosperity. Non-life at 0.74 percent of GDP has barely moved in years; a country that is exposed to floods, earthquakes and fire is dramatically under-insured against its own physical risks. Where you land, runway or fragility, depends on which of those two facts you weigh, and a good insurance note argues both.
One slice of that under-insured market is already moving fastest. Micro-insurance, small cheap policies aimed at rural and low-income households is a separately licensed category, and in the opening months of FY 2082/83 the micro and small insurers grew premium by roughly 40 percent against about 12 percent for the large non-life companies. It is still tiny in absolute terms but it is where the penetration line is most likely to bend and the part of the sector most exposed to the country's physical risks and least cushioned against them. For an investor it is a frontier; for the regulator it is the financial-inclusion mandate made concrete.
A reading checklist
Put it together and reading a Nepali insurer comes down to a short, ordered set of questions none of which you would ask a bank. First, the float: how much of the profit is underwriting, and how much is just investment income on held premium? Second, for non-life the combined ratio: does the underwriting make money on its own, or only after the investment book rescues it? Third, the reserves and the reinsurance behind them: are the promises adequately provided for and is the cession prudent rather than reckless or excessive? Fourth, solvency, read as a trend rather than a comfortable absolute level, with an eye to what the surplus capital is doing. Fifth, for life, embedded value and persistence not this year's P/E, and a clear eye for new-business strain. Sixth, premium per policy not the policy count management wants you to admire. And running underneath all of it, the macro question of whether the growth is genuine deepening or just remittance-linked life cover sold in volume and whether a falling-rate world is quietly draining the float.
The sector will reward the discipline. There are insurers listed and trading across both life and non-life, a regulator that now publishes solvency and claims data in detail, and a market still writing less than half the cover its economy implies. Read them as banks and they look dull and over-capitalised. Read them as what they are, promises sold today against costs that arrive tomorrow, financed by the float in between and they become one of the more interesting corners of the exchange.
Disclaimer
This report has been prepared by Nepalytix for informational and educational purposes only and does not constitute investment advice, an offer, or a solicitation to buy or sell any securities.
The information contained in this report is based on sources believed to be reliable; however, Nepalytix does not guarantee its accuracy, completeness, or timeliness. Opinions, estimates, and projections expressed herein are those of the authors as of the date of publication and are subject to change without notice.
Investing in securities involves risks, including the possible loss of principal. Past performance is not indicative of future results. Readers are advised to conduct their own independent research and consult with a qualified financial advisor before making any investment decisions.
Nepalytix and its contributors may hold positions in the securities discussed in this report at the time of publication or thereafter.
Neither Nepalytix nor any of its affiliates accept any liability for any loss arising from the use of this report or its contents.