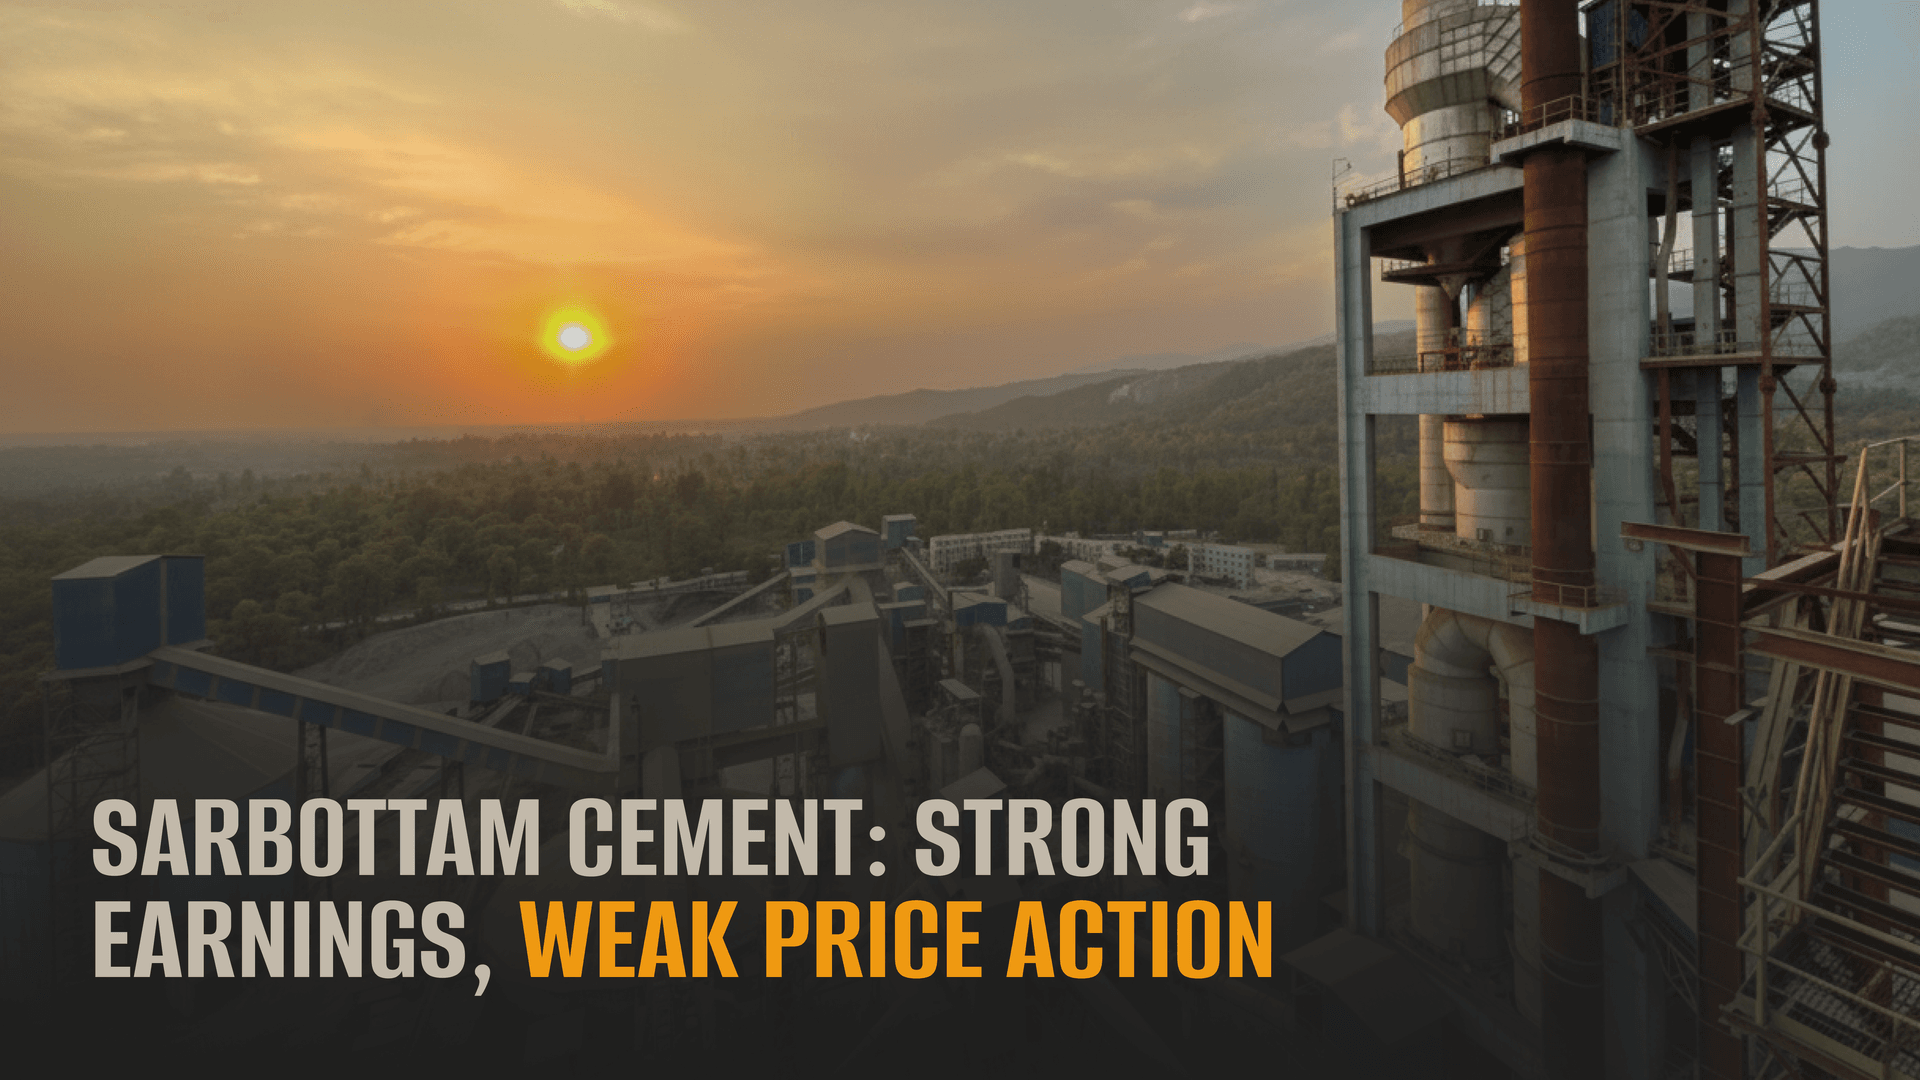
Long Read: Sarbottam Cement listed at a premium. The cement sector is two years past peak. Both are true. Here's the trap.
Sarbottam Cement’s fundamentals have rarely looked stronger: a 50 percent profit jump, expanding margins, a 20 percent combined dividend, and the first fully profitable year since listing. Yet the stock continues to underperform
A 50 percent profit jump on flat revenue. The first net-profitable full year since IPO. A 20 percent combined dividend and a share price down on the year despite all of it. Two years into Nepal's first book-building IPO, the operational thesis has been delivered and the technical setup has not. What that gap is signalling about cement, capital structure and Nepal's manufacturing equity market.
In Summary
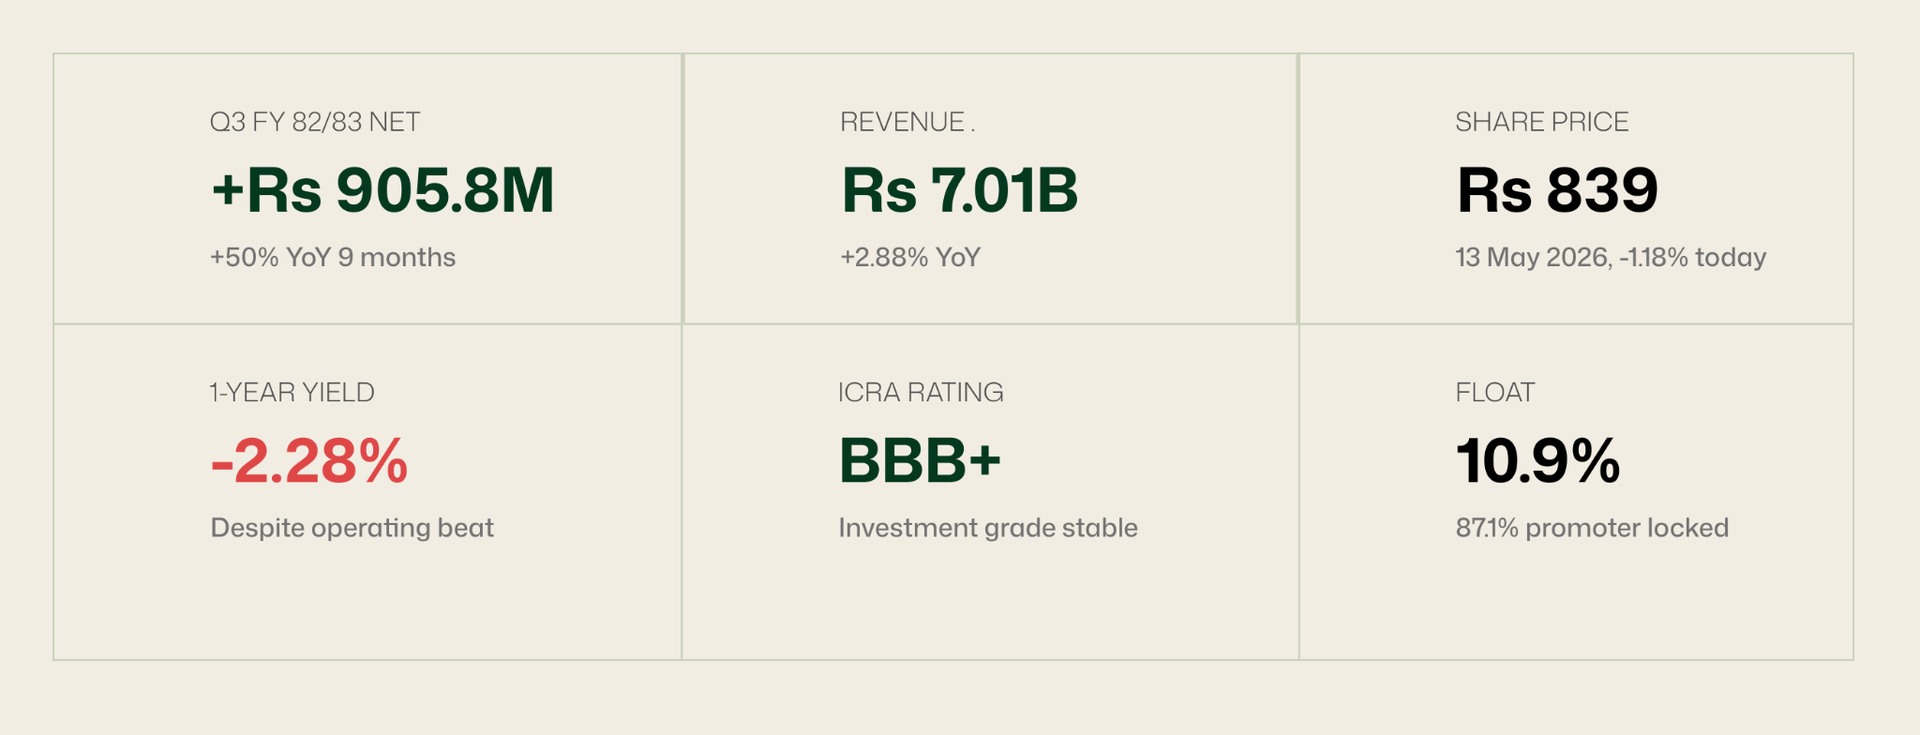
→ Sarbottam Cement Limited (NEPSE: SARBTM) just published its Q3 FY 82/83 financial statement showing a nine-month cumulative net profit of Rs 905.8 million, a 50.21 percent year-on-year jump against revenue that grew only 2.88 percent. The operating story is one of accelerating margin expansion: net margin moved from 8.85 percent in the comparable nine-month period of FY 81/82 to 12.93 percent in FY 82/83. EPS at the annualised run-rate is Rs 23.12, book value per share Rs 195.96 and the company paid a 20 percent combined dividend (5 percent bonus plus 15 percent cash) for FY 81/82, its first full year as a listed company.
→ The market has not rewarded it. The share price closed at Rs 839 on 13 May 2026, down 2.28 percent over the trailing twelve months and approximately 21 percent below the 52-week high of Rs 1,048. All four moving averages 5-day, 20-day, 120-day, 180-day sit above the current price, indicating a sustained downtrend over multiple time horizons. The contrast with Shivam Cement (SHIVM), the most mature listed cement peer is sharp: Shivam is up 16.57 percent over the same period on operationally weaker fundamentals.
→ The disconnect is structural, not informational. Sarbottam came public in March 2024 through Nepal's first book-building IPO at the bottom of its operating cycle. Promoter shares (87.1 percent of the company) are locked until March 11, 2027. Qualified institutional investor allotments unlock approximately September 22, 2026 roughly four months from this writing. The 10.9 percent public float sets price discovery for a company that is, by most fundamental measures, the strongest listed cement operator in Nepal. The market is pricing the supply overhang not the operating result.
→ The thesis the IPO sold in 2024 has delivered. Revenue recovered from the Rs 5.38 billion trough of FY 79/80 to Rs 9.55 billion in FY 81/82 audited. Net profit recovered from Rs 207.5 million to Rs 1.004 billion. The investor who bought at the QII cut-off price of Rs 401 in November 2023 is up roughly 123 percent in total return including the FY 81/82 dividend. The investor who bought the public offering at Rs 360.90 in February 2024 is up roughly 148 percent. The path between then and now ran through Rs 1,083 at the post-listing peak and Rs 770 at the recent low far from a clean line. This piece sets out, in fifteen sections, what actually happened, what is driving the current divergence between operating data and stock price, and what the next twelve months hold.
The contradiction
In the nine months ending Chaitra 2082 (mid-April 2026), Sarbottam Cement earned Rs 905.8 million in net profit on Rs 7.01 billion in revenue. The same company in the same nine months of the prior fiscal year earned Rs 603 million on Rs 6.81 billion in revenue. Profit grew 50.21 percent. Revenue grew 2.88 percent. The implied operating margin moved from 8.85 percent to 12.93 percent.
A profit beat of that magnitude, particularly one driven by margin expansion rather than top-line growth would, in most equity markets produce a positive share-price reaction. In Sarbottam's case it did not. The Q3 result was published on 6 May 2026. The share price on the announcement date (Sharesansar reading of 5 April 2026 was Rs 838, and 8 May 2026 was Rs 838) suggests the result was a non-event for the stock. As of 13 May 2026, the share traded at Rs 839.
That sequence, strong operating result, no price response is the cleanest version of the puzzle this piece is structured to answer. The data is good. The market is not impressed. Why?
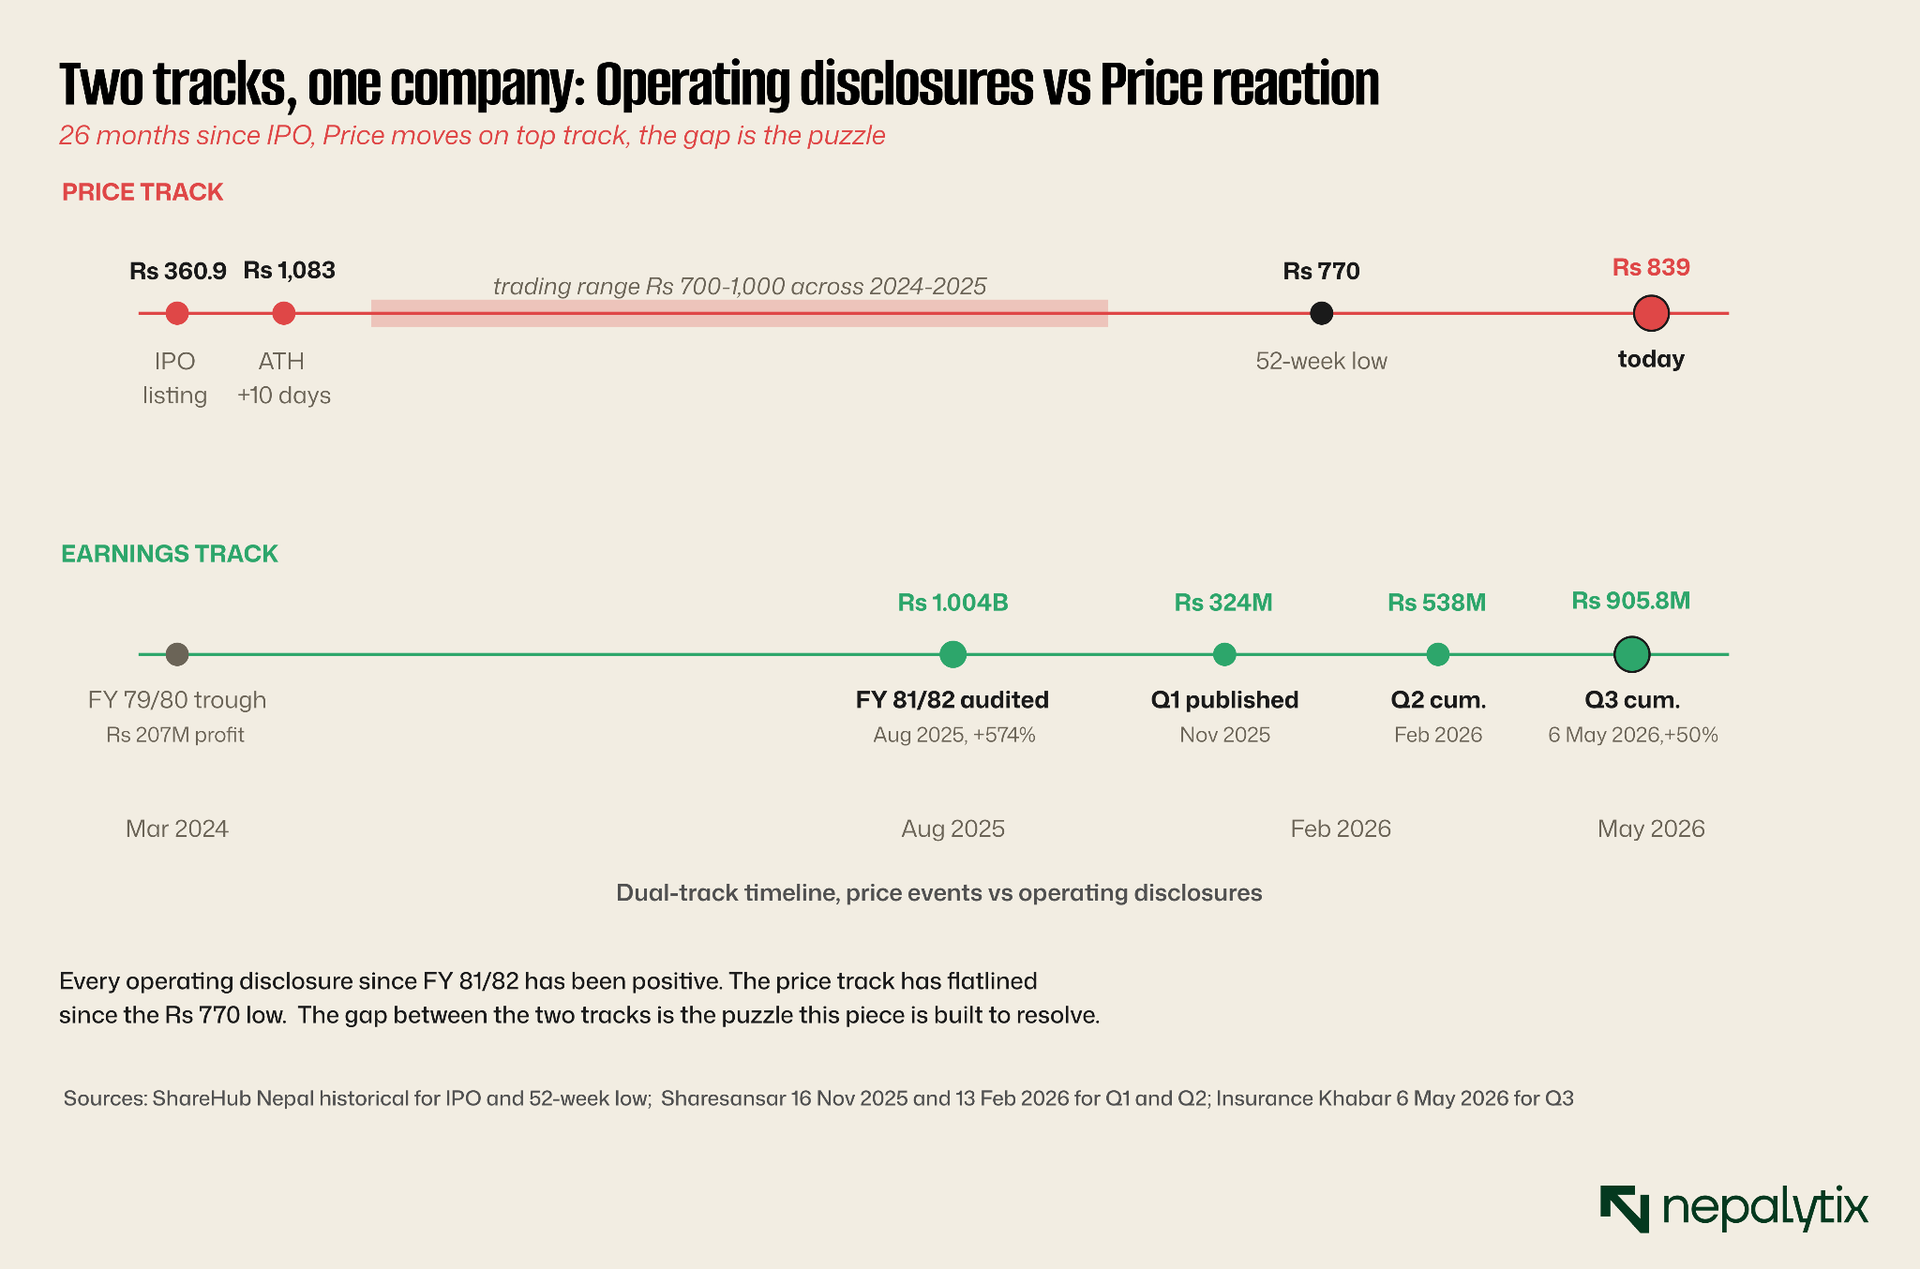
The chart maps the contradiction onto two years of market history. The stock is listed at Rs 360.90 for public investors and Rs 401 for qualified institutional investors. Within ten trading days it reached an all-time high of Rs 1,083 a 170 percent gain for QIIs and 200 percent for public allottees. Within one trading day of listing it also touched an all-time low of Rs 556, the wide IPO opening range allowed by NEPSE rules created extreme initial volatility. The interesting reading is what happened after the post-listing froth settled.
The stock spent most of 2024-2025 ranging between Rs 700 and Rs 1,000. Q1 FY 82/83 results published in mid-November 2025 produced no sustained breakout. Q2 FY 82/83 results in February 2026, the company's first H1 cumulative profit of Rs 538 million, more than half of the entire prior-year audited annual figure produced no sustained breakout. By the time Q3 published on 6 May with a Rs 905.8 million nine-month cumulative result, the stock was trading around Rs 838 and barely moved on the news. The 52-week low of Rs 770 was set during this period of strong operating data, not before it.
This is not a small inefficiency. The same nine months that delivered the strongest profit print in the company's listed history saw the stock trade through its 52-week low. Either the market is wrong about Sarbottam Cement or the fundamentals are not the binding constraint on the share price. The thesis of this piece is that the second reading is closer to correct and that the reason is structurally embedded in the company's share register, its post-IPO lock-in schedule and the broader Nepali cement sector's structural overcapacity. The next fourteen sections walk through the evidence.
What the IPO actually sold
Sarbottam Cement Limited was incorporated in October 2010 as a private limited company under the Saurabh Group, became operational in February 2014 and converted to a public limited company in July 2019. The company runs a manufacturing plant in Sunwal Municipality of Nawalparasi Province 5, approximately 240 kilometres from Kathmandu with limestone mining concessions in Palpa and Chitwan districts. Installed production capacity is 3,000 tonnes per day of cement and 3,000 tonnes per day of clinker, equivalent to roughly one million tonnes per annum (MTPA) of each. The company employs approximately 200 people and produces Ordinary Portland Cement (OPC), Portland Pozzolana Cement (PPC) and Portland Slag Cement (PSC) under the "Sarbottam" brand.
The relevant operating-history fact for any IPO investor is that the company went public at the bottom of its operating cycle. The prospectus published in late 2023 showed an operating income trajectory that had collapsed: from Rs 8.93 billion in FY 2077/78 (2020/21) to Rs 7.88 billion in FY 2078/79 (-11.7%) to Rs 5.38 billion in FY 2079/80 (-31.7%). Net profit followed the same path from Rs 1.31 billion at peak to roughly Rs 207.5 million at trough an 84 percent decline over three years. The reasons given for the decline included the post-COVID demand reset, accumulating inventory across the industry, fuel cost pressure and the broader Nepali macroeconomic slowdown that compressed construction activity sector-wide.
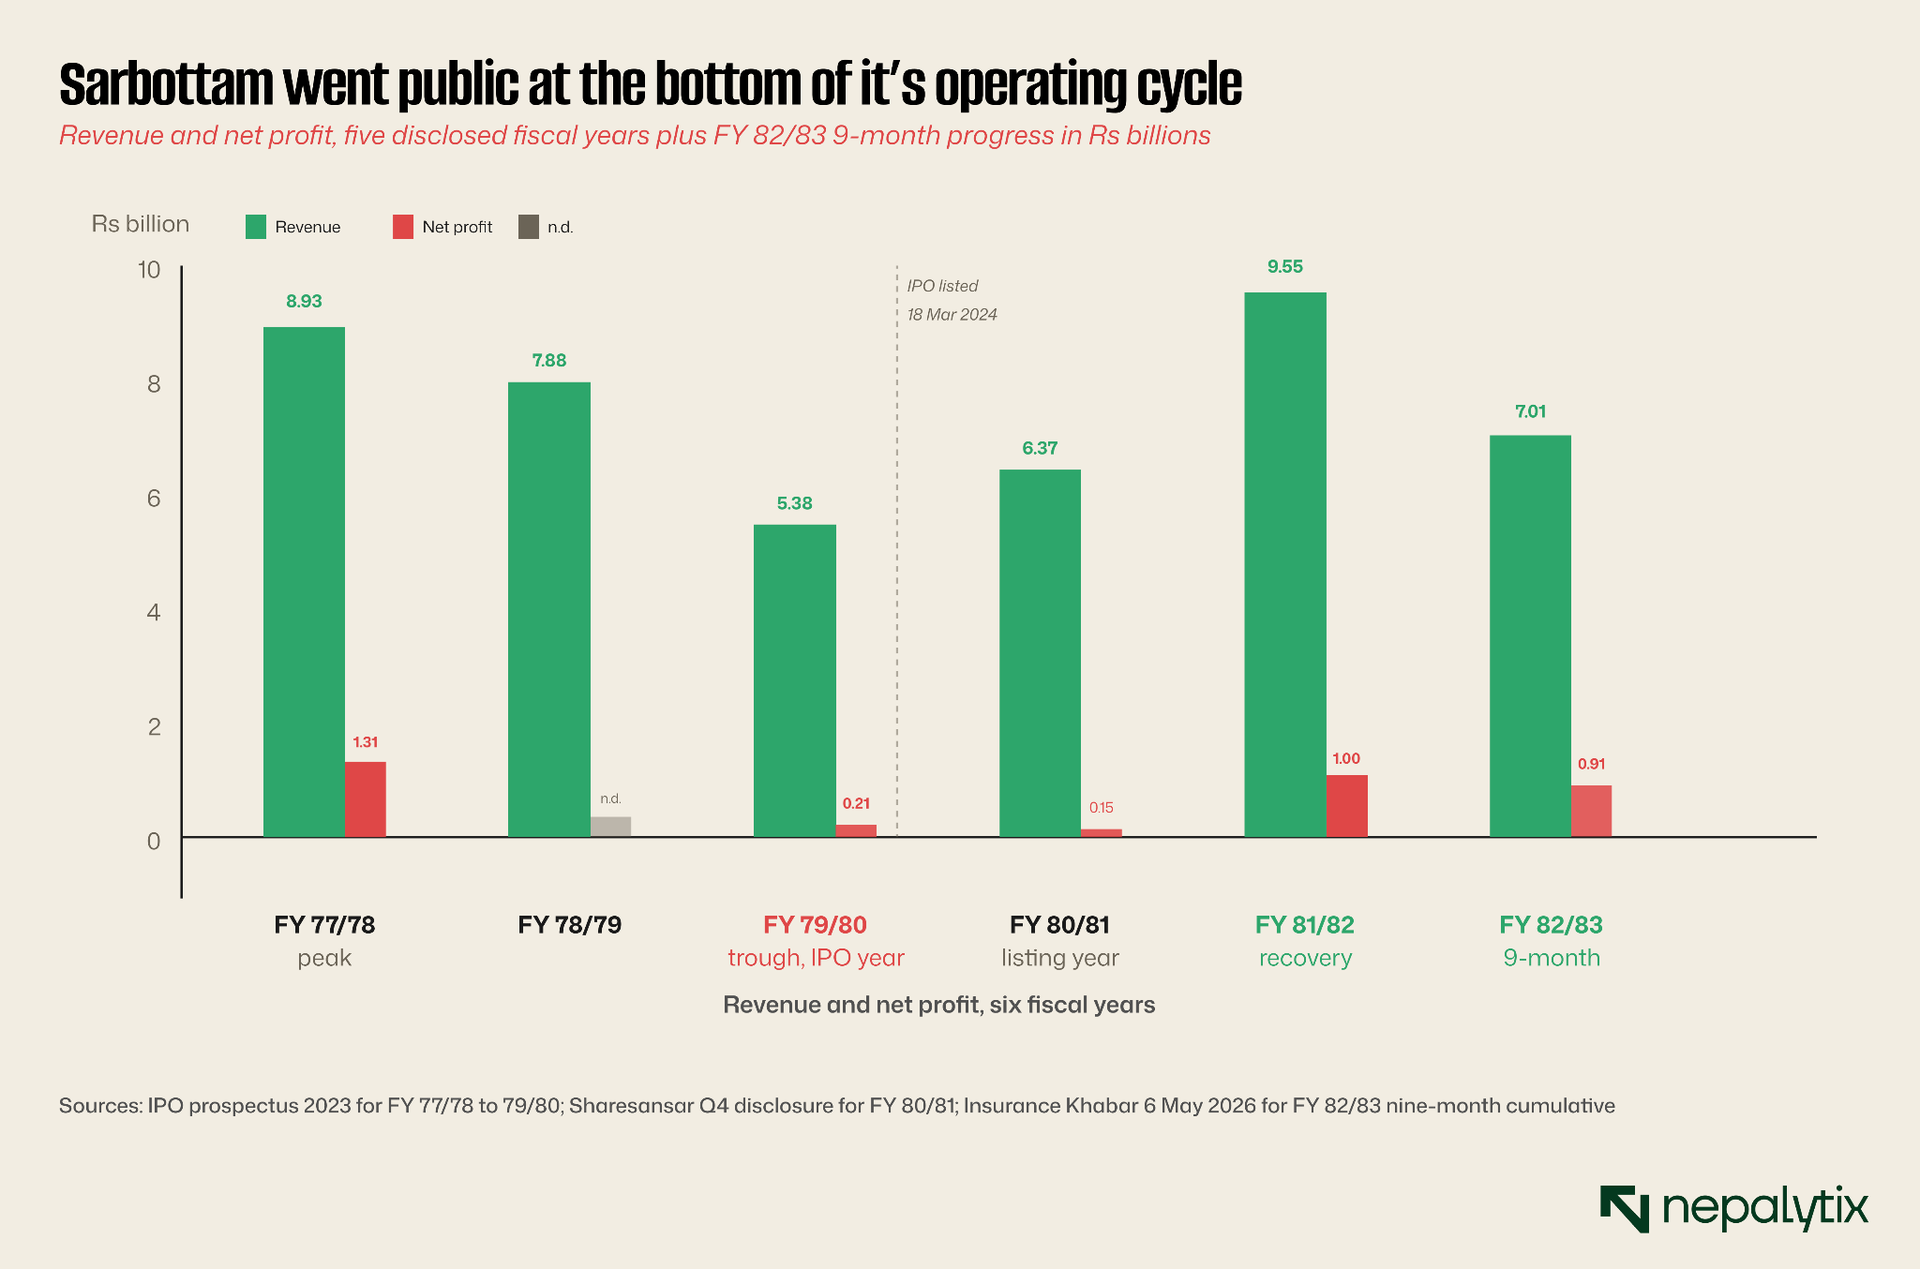
The chart makes the IPO timing visible. The vertical dashed line marks the listing date of 18 March 2024 coming at the company's worst operating year on record. Public investors who applied at Rs 360.90 in February 2024 were not buying into momentum. They were buying into a recovery thesis: that the trough behind the FY 79/80 dip was cyclical not structural, and that the operating engine VRM-equipped clinker integration, captive limestone, distributed brand would recover its FY 77/78 trajectory once macroeconomic conditions normalised.
The thesis was tested in two stages. FY 80/81 (the listing year itself) ran nearly break-even at Rs 149 million net profit on Rs 6.37 billion revenue; revenue recovering, profit margin compressed to roughly 2.3 percent. That was the year of maximum scepticism for IPO holders. Then FY 81/82 the company's first full fiscal year as a listed entity delivered the recovery: Rs 9.55 billion in revenue (already above the FY 77/78 peak) and Rs 1.004 billion in net profit. EPS reached Rs 20.19 versus Rs 3.74 the prior year. The audited result was published in late August 2025.
FY 82/83 has, through nine months, taken the recovery a step further. Net profit at Rs 905.8 million through Q3 is on a trajectory to deliver a full-year figure in the range of Rs 1.1-1.3 billion above the FY 81/82 audited number despite revenue growing only marginally. The IPO operational thesis has by any reasonable standard, delivered. The next question is what that has meant for shareholders.
What delivered: the IPO investor's actual return
For an investor who bought at the qualified institutional investor cut-off price of Rs 401 in November 2023, the holding today consists of: the original shares purchased; a 5 percent bonus distribution from FY 81/82 dividend (book close 28 November 2025); and Rs 15 per share in cash dividend from the same. Compounding that arithmetic against today's market price of Rs 839 produces a specific return number.
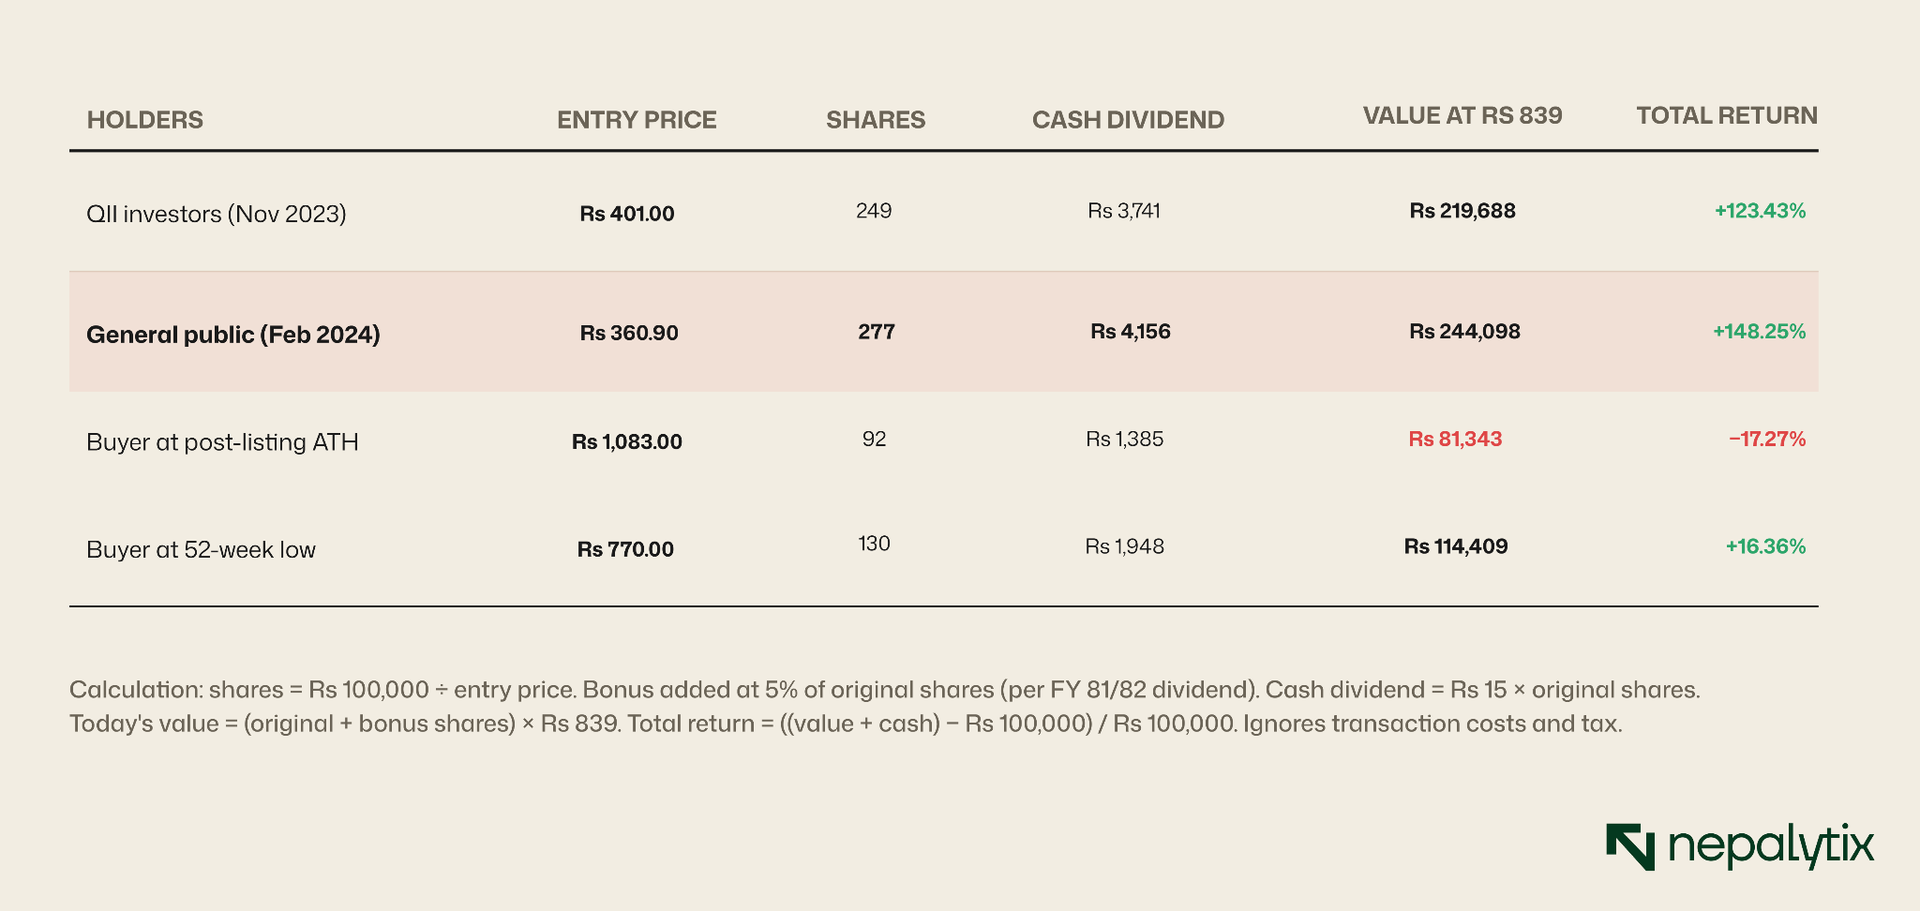
The chart makes the entry-point dependence visible. The IPO public cohort delivered the largest absolute and percentage return: Rs 143,910 of gain per Rs 100,000 invested in approximately 27 months. The QII cohort which paid the 10 percent premium for first access, returned Rs 122,970 of gain per Rs 100,000. The post-listing peak buyer is the only category showing a loss; the 52-week low buyer is marginally positive.
The numbers tell the story cleanly. Investors who got in through the IPO at either the QII cut-off or the public price have made significant total returns. The public-tranche investor in particular has nearly tripled the value of an initial holding, including bonus and dividend. That is a successful IPO outcome by any standard.
The cohort that lost money is the one that bought in the immediate post-listing scramble at the all-time high. That cohort is by definition small, the all-time high held for only a few sessions and trading volume at that level was thin. The cohort that has done less well than the IPO holders but is still positive is the one that bought near the 52-week low, which sits roughly 8 percent below today's price.
The structural fact this table makes clear is that the IPO mechanism worked as designed. Book-building set a QII cut-off price of Rs 401 that reflected institutional pricing of the company's fundamentals. The public-tranche discount of 10 percent (Rs 360.90) compensated retail investors for accepting the institutional valuation. Two years and a recovery cycle later both cohorts are up substantially. The system did what it was designed to do.
The reading the rest of this piece is built on is that the IPO investor's story is essentially complete and positive. The market question now is about the marginal buyer at Rs 839 today, what they are pricing, what they are not and why the share-price trajectory of the last six months has flattened out despite Q3's operating beat.
The overhang: What 87 percent locked means for price discovery
Sarbottam Cement has 52,242,750 shares listed on NEPSE following the FY 81/82 bonus distribution. Of those, 43,335,012 or 87.1 percent are promoter shares. Public shares total 5,423,295, or 10.9 percent. The residual 2 percent represents employee and other restricted holdings. The float available for trading is in effect just over five million shares against a total market cap of approximately Rs 43.8 billion. Daily volume is typically in the low thousands.
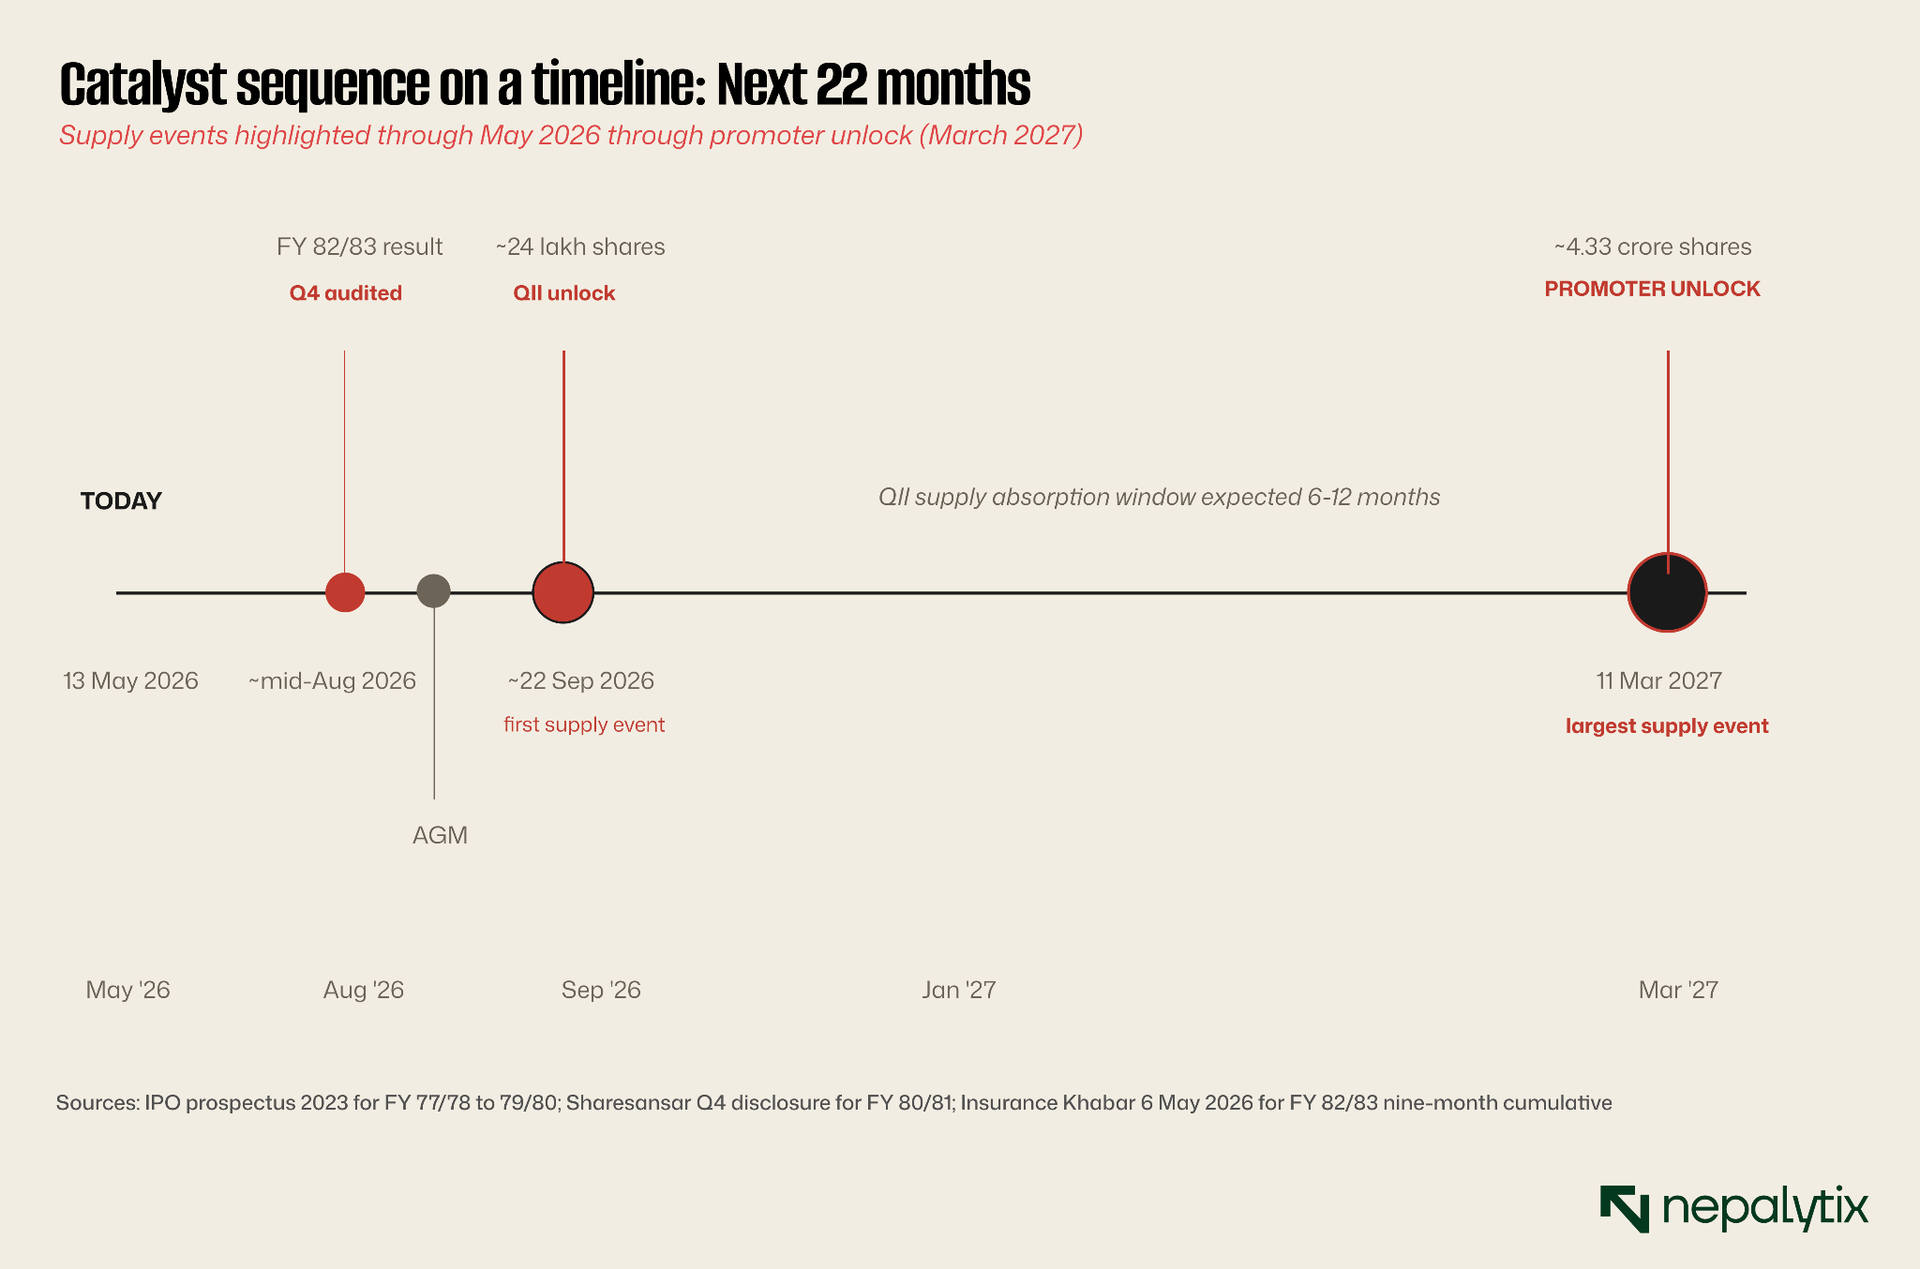
The lock-in structure determines when this changes. Nepal Securities Board Regulation (SEBON) requires promoter shares to remain locked for three years from the date of listing meaning Sarbottam's promoters cannot trade their shares until 11 March 2027. Qualified institutional investors who participated in the IPO are locked for shorter periods typically ending in Asoj of the third post-listing year which translates to approximately 22 September 2026. The two unlock dates frame the next 22 months of supply-side dynamics on the stock.
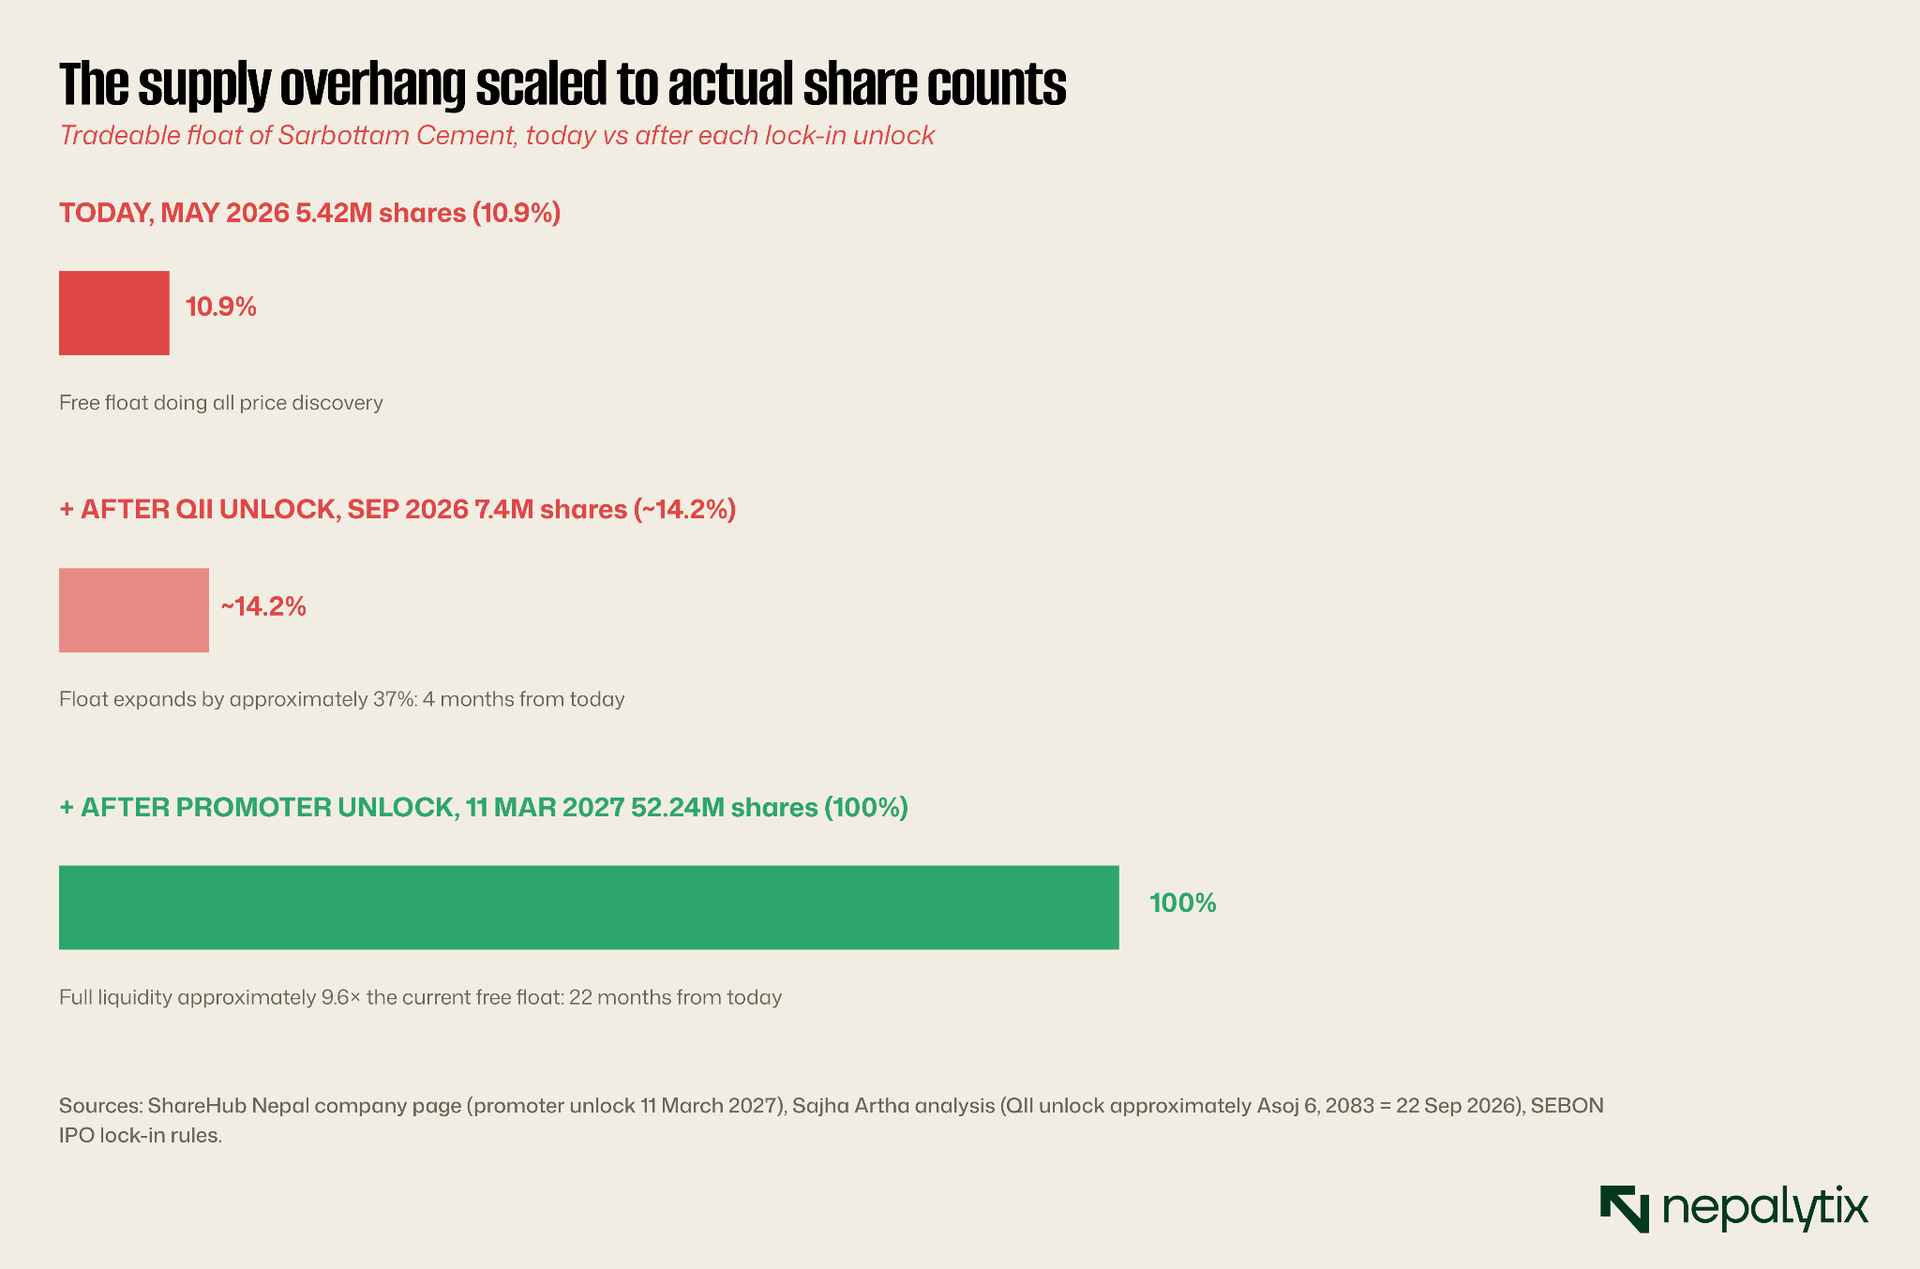
The arithmetic here matters more than it might seem. A company with 10.9 percent float trades on a different set of forces than a company with 100 percent float. The free-float shares set the marginal price but the marginal buyer knows that within a defined horizon under 12 months for the first wave, under 24 months for the second a substantially larger pool of supply will become tradeable. That knowledge is incorporated into the price now, not when the unlock actually happens.
What QII investors do at unlock is variable. Some hold; some sell aggressively to crystallise three-year returns; some sell at intermediate price points based on their fund-level commitments. The pattern observed in other Nepali listings is that QII unlock typically produces a 10-20 percent price decline in the months following the unlock as the locked supply works through the market. The magnitude depends on absorbing demand and on whether the stock is in an uptrend or downtrend at the time.
What promoter shareholders do at unlock is harder to predict but more consequential. The Saurabh Group is a long-term industrial holder; outright divestment is unlikely. But pledging shares for working capital, selling tranches to fund expansion in other group companies or simply diluting through secondary placement are all standard outcomes once the lock-in expires. For a company with 87.1 percent promoter holdings, even a 5 percent sell-down by promoters represents over four times the current public float.
The pattern most relevant to today's Rs 839 share price is what Ghorahi Cement (GCIL) is currently displaying. GCIL listed 10 August 2023 with 80 percent promoter holding. Its promoter unlock date is 10 July 2026, approximately two months from this writing. Over the trailing twelve months GCIL has lost roughly 16 percent of its value. The company is loss-making (EPS −Rs 10.54 in Q2 FY 82/83) which provides part of the explanation but the promoter overhang has been a documented and discussed factor in market commentary on the stock. Sarbottam's setup is similar; different timing, different unlock magnitudes, but the same structural force.
The margin expansion: what is actually driving the 50 percent profit jump
Returning to the operating story. In the nine months ending Chaitra 2082, Sarbottam earned Rs 905.8 million in net profit on Rs 7.008 billion in production sales revenue, a net margin on revenue of 12.93 percent. The comparable nine-month period of FY 81/82 produced Rs 603 million on Rs 6.811 billion in revenue with a net margin of 8.85 percent. Margin expanded by roughly 408 basis points year over year. The dominant question for the operating thesis is what drove the expansion.
Four candidate explanations are available from the public disclosures and industry context:
Cost of sales improvement (the dominant driver). The primary-source income statement shows cost of sales fell from Rs 5,505 million in 9M FY 81/82 to Rs 5,249 million in 9M FY 82/83, a Rs 257 million reduction on slightly higher revenue. This single line item is responsible for approximately 593 basis points of margin expansion, making it the largest contributor by far. Nepal's cement industry is heavily exposed to coal and fuel oil import costs, fuel typically represents 25-35 percent of cement production cost. Global coal prices have been moderating through 2025 from elevated 2022-2024 levels. Sarbottam's vertically integrated clinker production (3,000 TPD captive) provides partial insulation from clinker import dependency that smaller competitors face. The "13 cement industries in Koshi state closed due to clinker shortages" referenced in industry trade press during 2025 suggests captive clinker capacity has been a margin differentiator in the sector. The Rs 257M absolute reduction in cost of sales is consistent with both lower input costs and captive-clinker insulation working together.
Lower interest expense. The IPO mechanism raised Rs 4.65 billion of paid-up capital, with the institutional and public tranches together raising approximately Rs 2.2 billion in fresh proceeds (excluding the locked-in shares). Sarbottam's Q3 FY 82/83 primary disclosure reports long-term borrowings of Rs 60.5 million as of Chaitra 30, 2082 down from Rs 110.3 million a year earlier and a total finance cost of Rs 186.3 million for the nine months versus Rs 227.0 million in the prior-year comparable period, a Rs 40.7 million saving. On a revenue base of approximately Rs 7 billion that translates to a margin contribution of roughly 58 basis points. The contribution is durable rather than transient as long as Sarbottam maintains its current capital structure, the saving carries forward.
Operating expenses growth (the offset). Administrative expenses more than doubled from Rs 93.2 million to Rs 203.6 million, and selling & distribution expenses grew from Rs 360.0 million to Rs 466.3 million. Combined growth of Rs 217 million in operating expenses cost approximately 251 basis points of margin, a substantial drag that partially offset the cost-of-sales improvement. The disclosure does not break out the drivers of this expense growth but it is consistent with normal scaling of operations as the company prepares for capacity utilisation expansion.
Other income growth (modest positive). Other income grew from Rs 124.9 million to Rs 187.9 million, a Rs 63 million increase contributing approximately 90 basis points to margin expansion. This line typically captures interest on cash reserves, equity-method income from associated companies, and miscellaneous receipts. The disclosure attributes a portion to share of profit from associates accounted for by equity method, suggesting the associate companies (Jagadamba Cement subsidiaries) contributed.
Tax burden growth (modest negative). Current tax grew from Rs 66.4 million to Rs 136.3 million as profits expanded a Rs 70 million increase. Deferred tax decreased from Rs 81.2 million to Rs 48.9 million, partially offsetting. Net effective tax change cost approximately 54 basis points of margin.
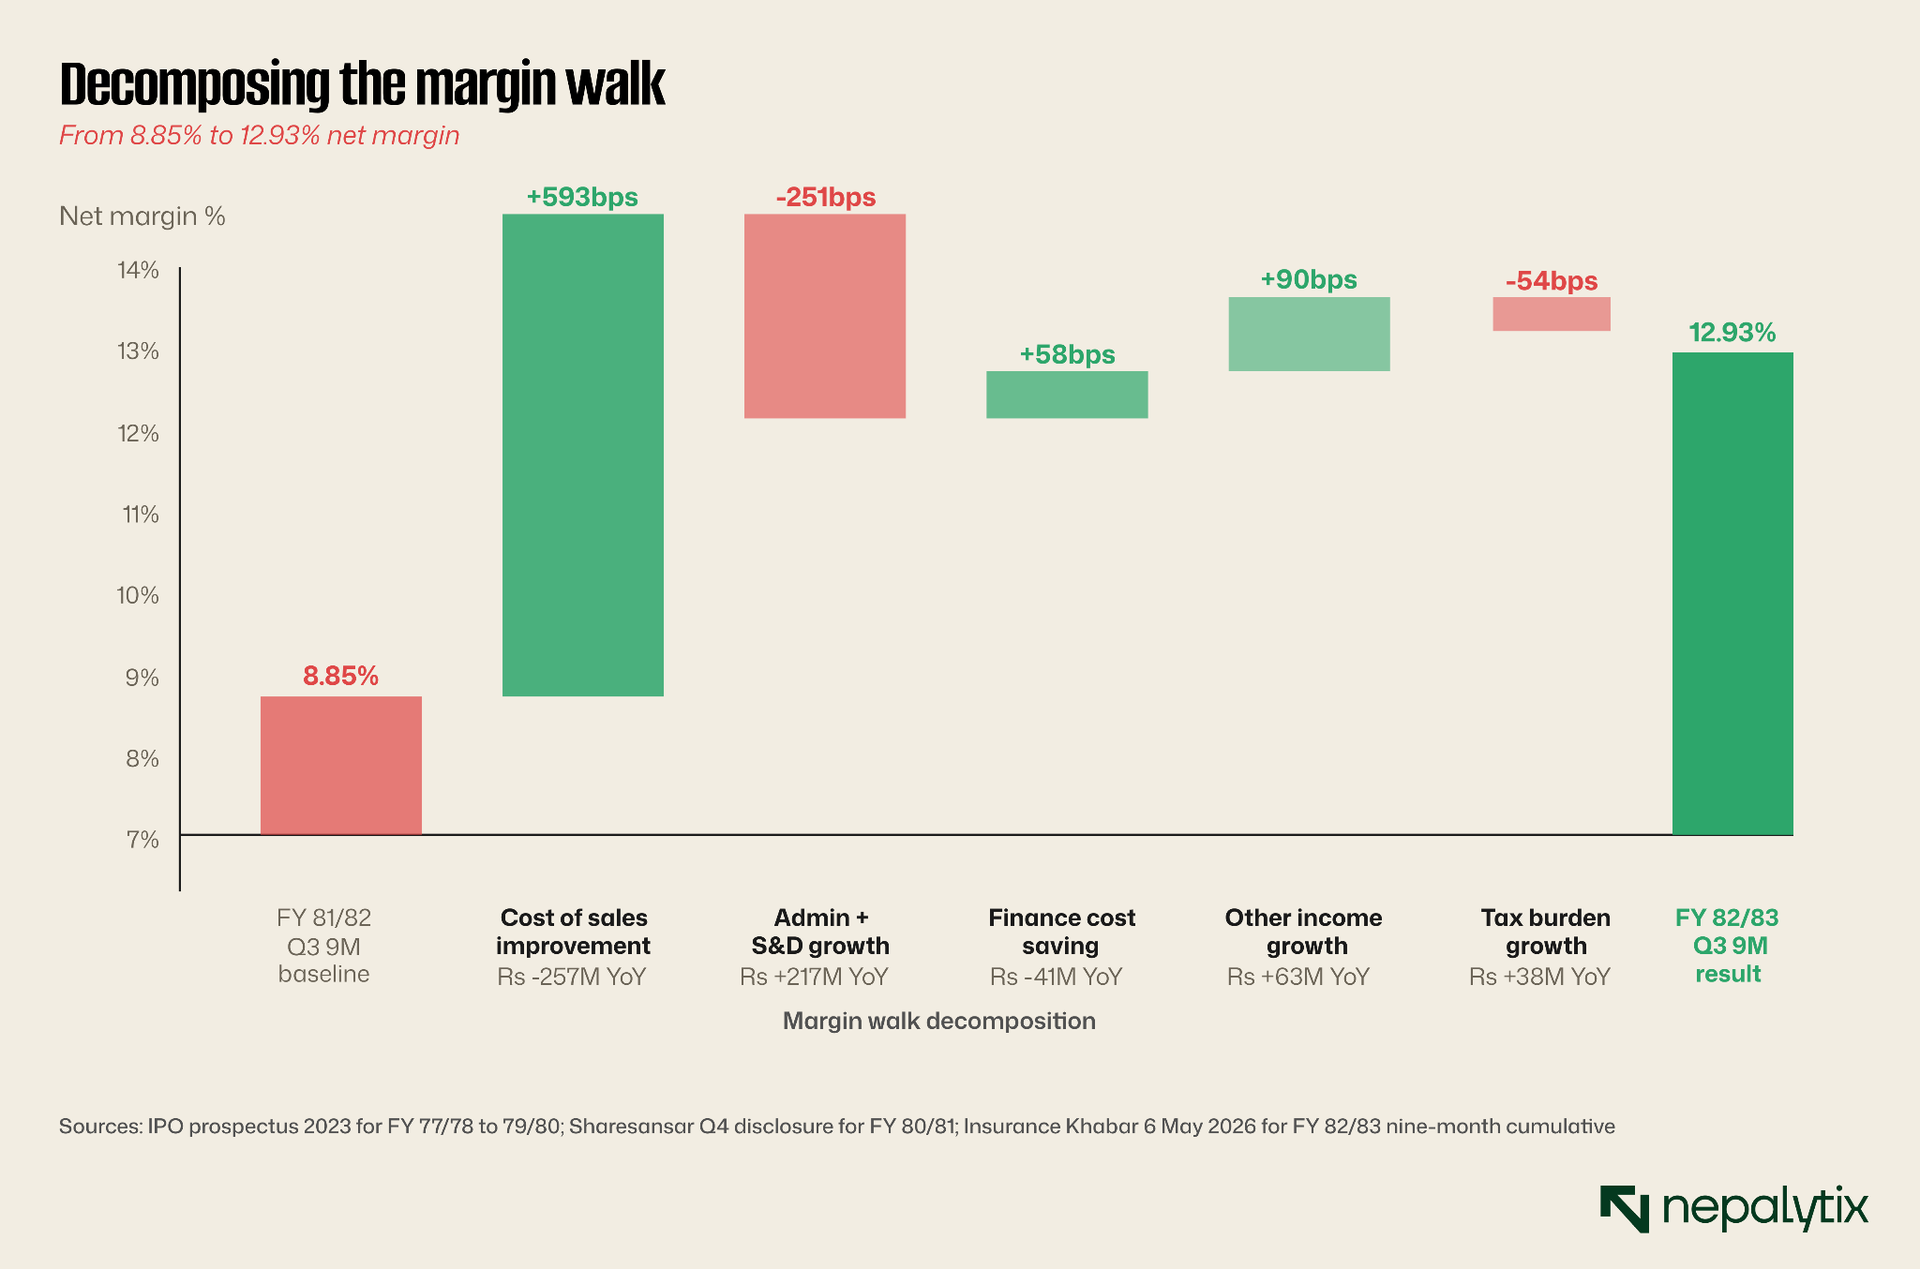
The walk produces a Rs 905.8 million Q3 print from a Rs 603 million baseline through a decomposition dominated by cost of sales improvement. The largest contributor is the Rs 257 million reduction in cost of sales, roughly 593 basis points of margin expansion that more than offsets the Rs 217 million growth in operating expenses (-251 bps). Finance cost savings, other income growth, and tax burden changes are smaller secondary contributors. The most important reading is that the dominant driver cost of sales combines two effects: lower commodity input costs (cyclical, may reverse) and captive clinker integration (durable, structural). The fuel-cost contribution within cost of sales is more cyclical but unlikely to reverse in the near term. Finance cost saving is durable as long as the capital structure stays intact. Operating expense growth offset is a real ongoing drag that needs management attention.
The implication for forward earnings is that the FY 82/83 margin expansion has structural rather than transient drivers. A reasonable read suggests Sarbottam's normalised net margin sits in the 11-14 percent range above the 8-9 percent of recent years and approaching the pre-COVID 14-15 percent peak. At Rs 9-10 billion in annual revenue, that translates to Rs 1.0-1.4 billion in normalised annual net profit, broadly consistent with the FY 81/82 audited Rs 1.004 billion and FY 82/83 9M run-rate.
The sector landscape: overcapacity and the strategic fact it imposes
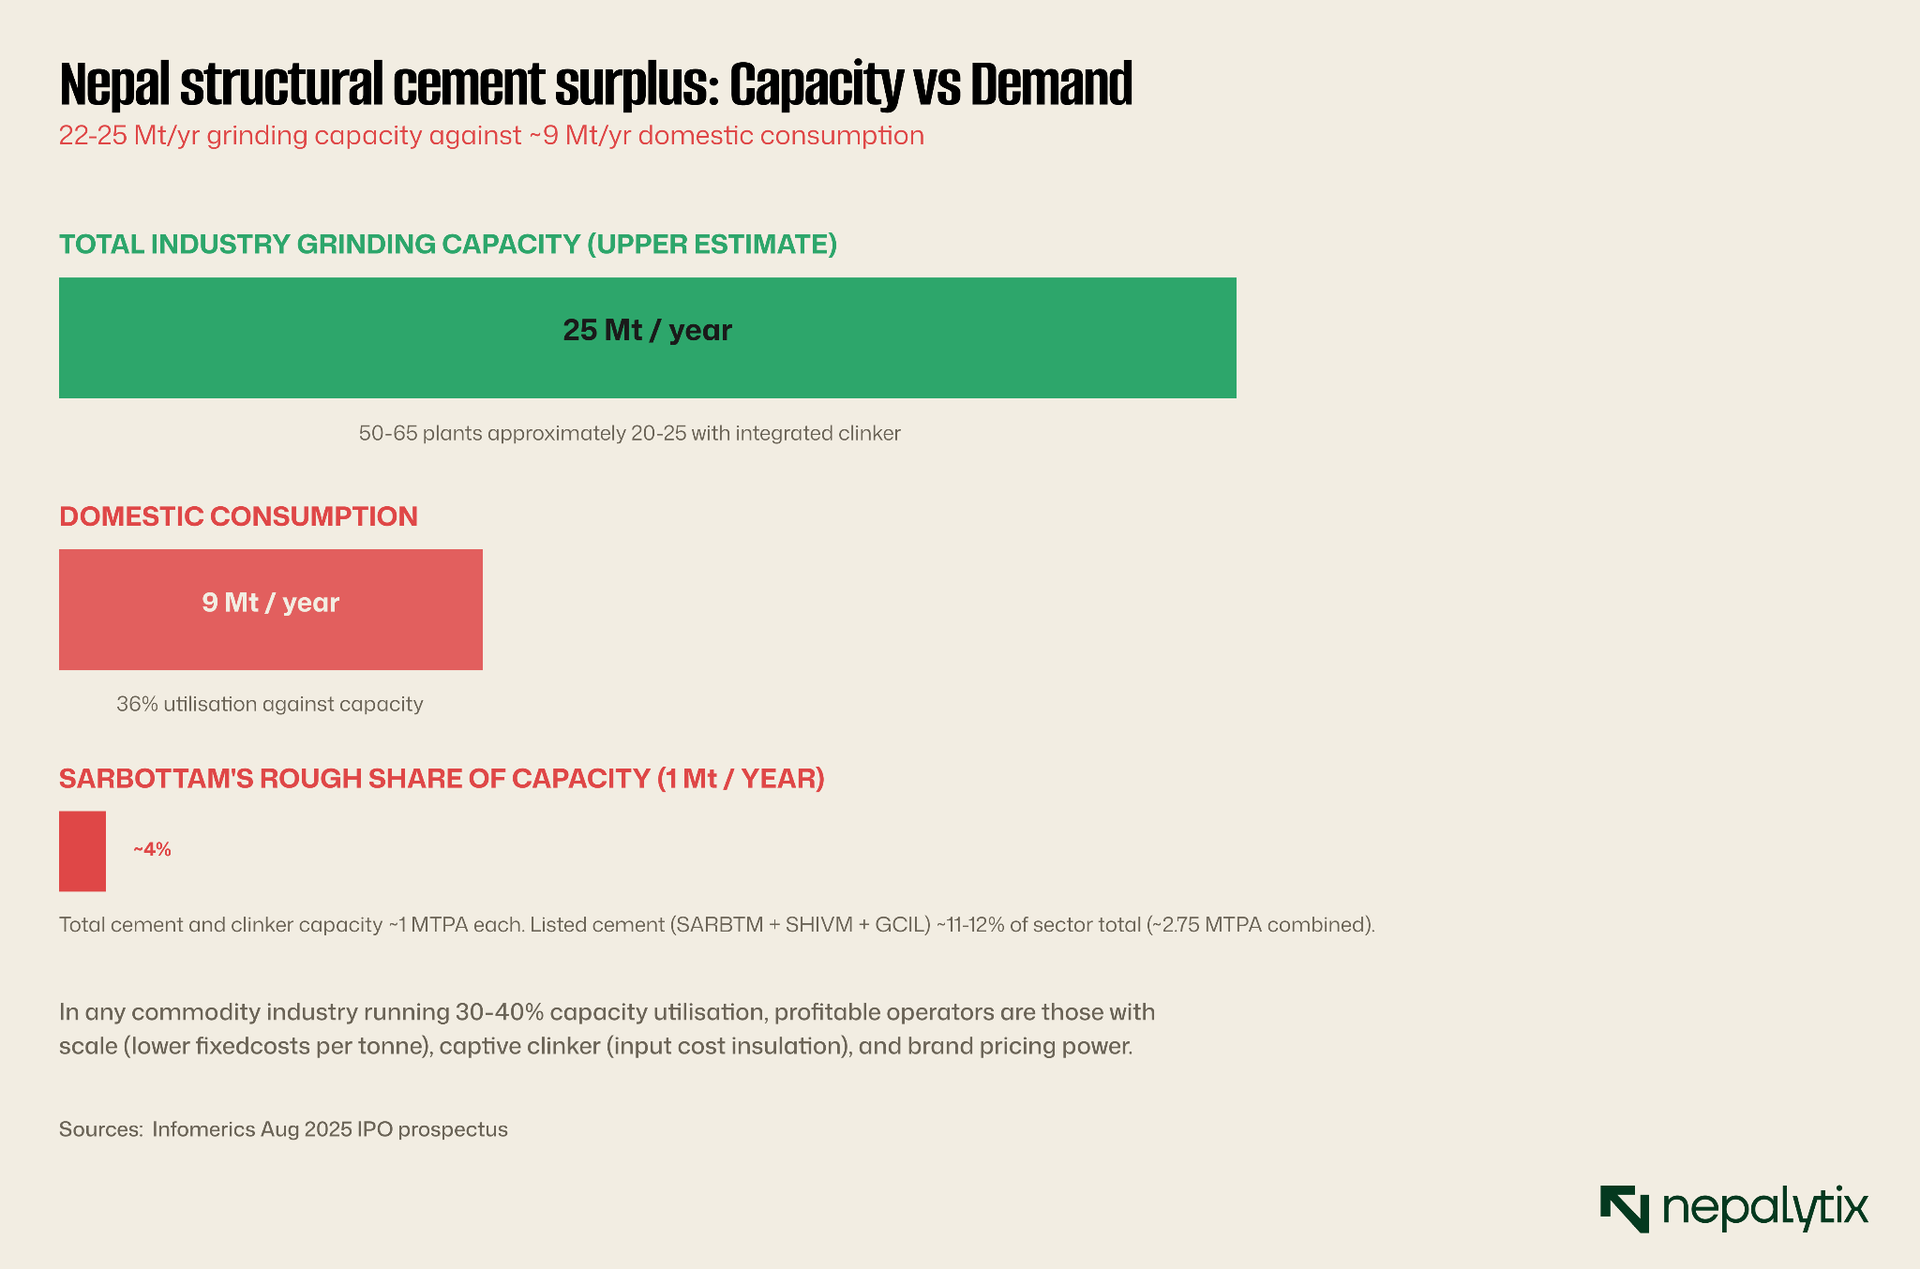
Nepal's cement industry has been built faster than its demand has grown. Infomerics Credit Rating Nepal's August 2025 sector report places total grinding capacity at 22-25 million tonnes per year across approximately 50-65 plants. Domestic consumption sits at approximately 9 million tonnes per year. Industry utilisation runs at 30-50 percent, with the lower end of that band representing the marginal, smaller producers and the upper end representing the integrated majors with captive clinker. This is a fundamentally different industry structure than, say, Indian cement (60-70 percent utilisation) or Chinese cement (75-85 percent utilisation). It is more analogous to Pakistan cement in the late 2010s — a market with structural surplus capacity, persistent margin pressure, and a small number of integrated players who control most of the profitable output.
The strategic implication of structural overcapacity is unambiguous: industry pricing is contested, marginal operators run at unsustainable margins and consolidation is a near-permanent question.
The companies that thrive in such markets are typically those with
(a) scale that reduces fixed costs per tonne
(b) captive raw material that insulates input costs
(c) brand strength that supports pricing power
(d) financial robustness to outlast cyclical weakness
Sarbottam ticks (b) and (c), partially ticks (d) and is at a meaningful scale disadvantage to Hongshi-Shivam.
The three listed cement names SARBTM, SHIVM, and GCIL together represent approximately 11-12 percent of total Nepali cement capacity. The dominant force is the unlisted Hongshi-Shivam joint venture between China's Hongshi Holding Group and Shivam Holdings which operates a 6,000 TPD plant (approximately 2.44 MTPA) and is the single largest cement producer in Nepal. That entity is not directly accessible to public equity investors but its pricing decisions shape the entire industry.
The listed cement peer set, three different stories
The closest analytical work for any single-stock analysis is the peer comparison. For Sarbottam, the listed comparison set has exactly two members: Shivam Cement (SHIVM) and Ghorahi Cement Industry (GCIL). The three names tell three different stories about cement equity in Nepal.
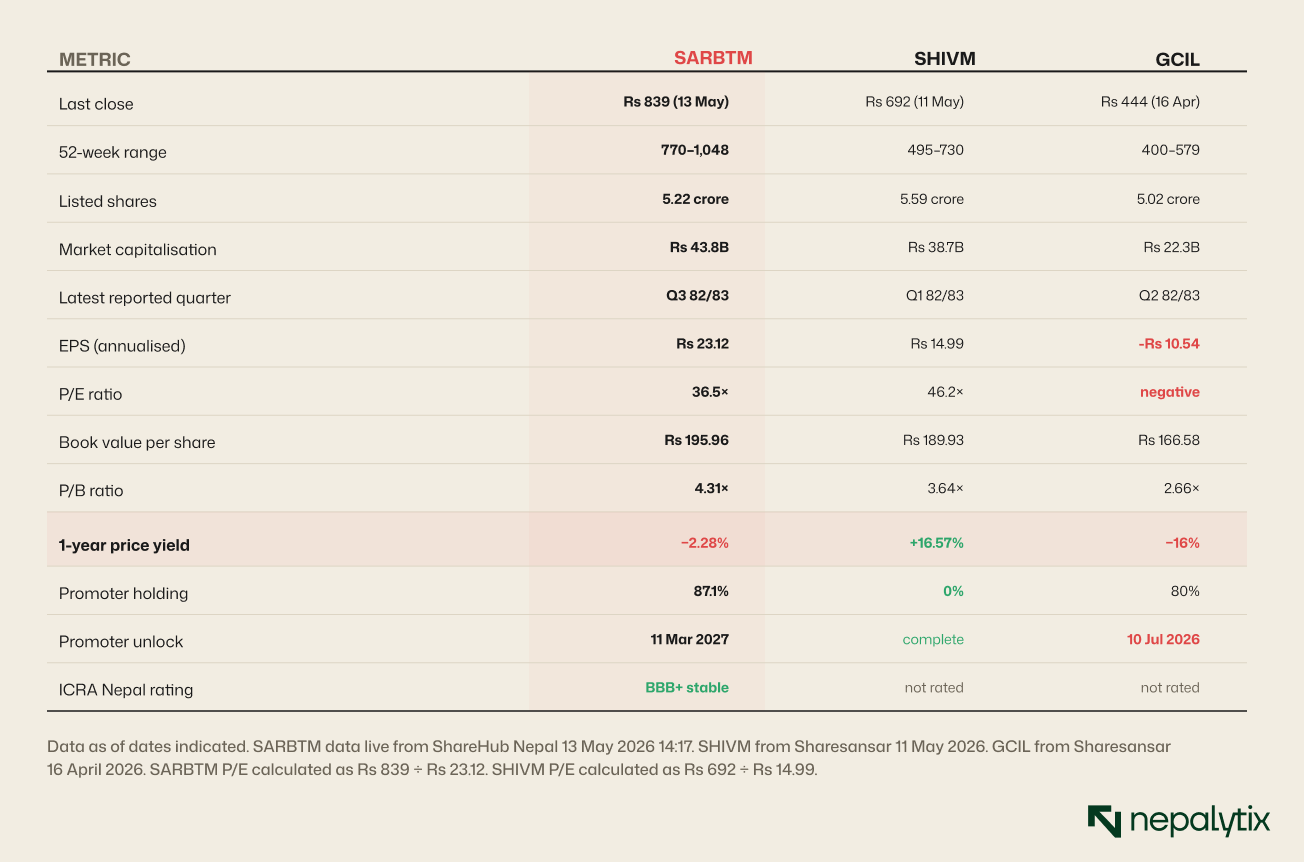
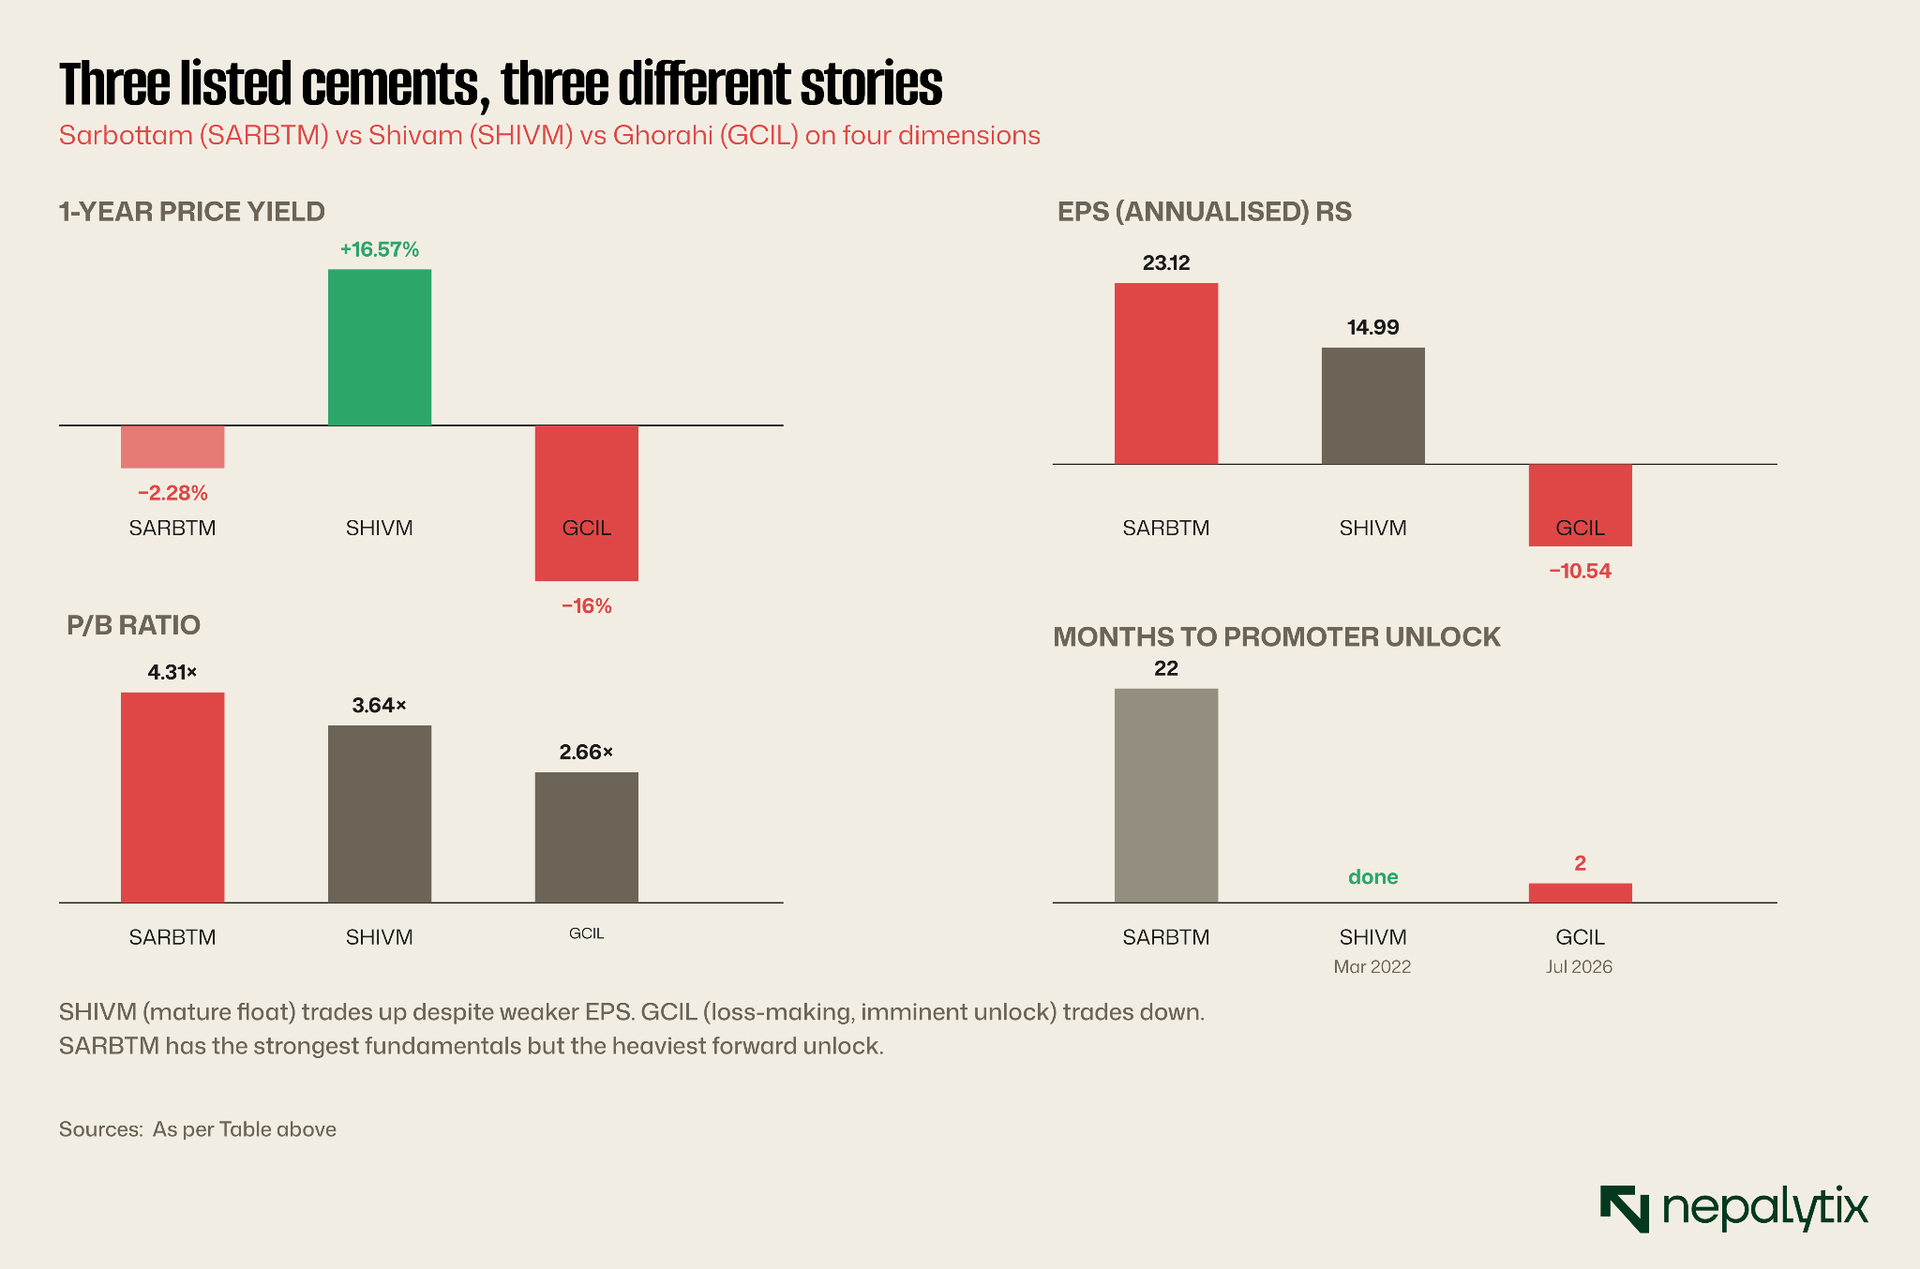
The peer reading is sharply diagnostic. Shivam (SHIVM) trades at a premium to Sarbottam on P/E (46.2× vs 36.5×) and at a discount on P/B (3.64× vs 4.31×) with weaker EPS (Rs 14.99 vs Rs 23.12), weaker dividend (12.5% vs 20%) and yet a positive 16.57 percent trailing yield versus Sarbottam's 2.28 percent. The single most likely explanation is that Shivam's promoter lock-in expired in March 2022, the supply overhang has cleared, the float is the full 100 percent and the market is no longer discounting future supply.
Ghorahi (GCIL) trades at a meaningful discount on P/B (2.66×) but is loss-making (EPS Rs 10.54), with a 16 percent trailing decline and a promoter unlock date approximately two months from this writing (10 July 2026). The combination of loss-making operating data and imminent supply unlock is producing exactly the price action one would expect, sustained weakness with limited buyer interest.
Sarbottam (SARBTM) sits between the two on most operating metrics, better than both on EPS, better than GCIL on profitability, comparable to SHIVM on book value but is being priced more closely to GCIL's downward trajectory than SHIVM's upward one. The data point that most parsimoniously explains the divergence is the lock-in schedule: SHIVM has cleared, GCIL is two months from clearing, SARBTM is 4-22 months from clearing. The closer to unlock, the heavier the technical pressure.
Credit, capital structure, and the Saurabh Group
Sarbottam's credit position is unambiguously strong which is what differentiates it most clearly from the leveraged hydropower stories on NEPSE. ICRA Nepal's reaffirmed issuer rating is [ICRANP-IR] BBB+ stable. The long-term rating on bank loan limits is [ICRANP] LBBB+ and the short-term rating is [ICRANP] A2. All three sit comfortably in the investment-grade range. There is no debt-service concern, no delayed payment record, no rating downgrade history and no "Issuer Not Cooperating" flag. The company's relationship with its lenders is normal.
ICRA's rating commentary at the time of issuance identified specific strengths: a relatively better operational profile within the sector, controlled leverage levels, experienced promoters and management and operational synergies from being part of the Saurabh Group. It also identified specific weaknesses: a stretched liquidity profile, reduced scalability and margins that had led to a major moderation in coverage indicators (referring to the FY 79/80 trough), intense industry competition, vulnerability to cyclical and seasonal demand, and exposure to regulatory changes.
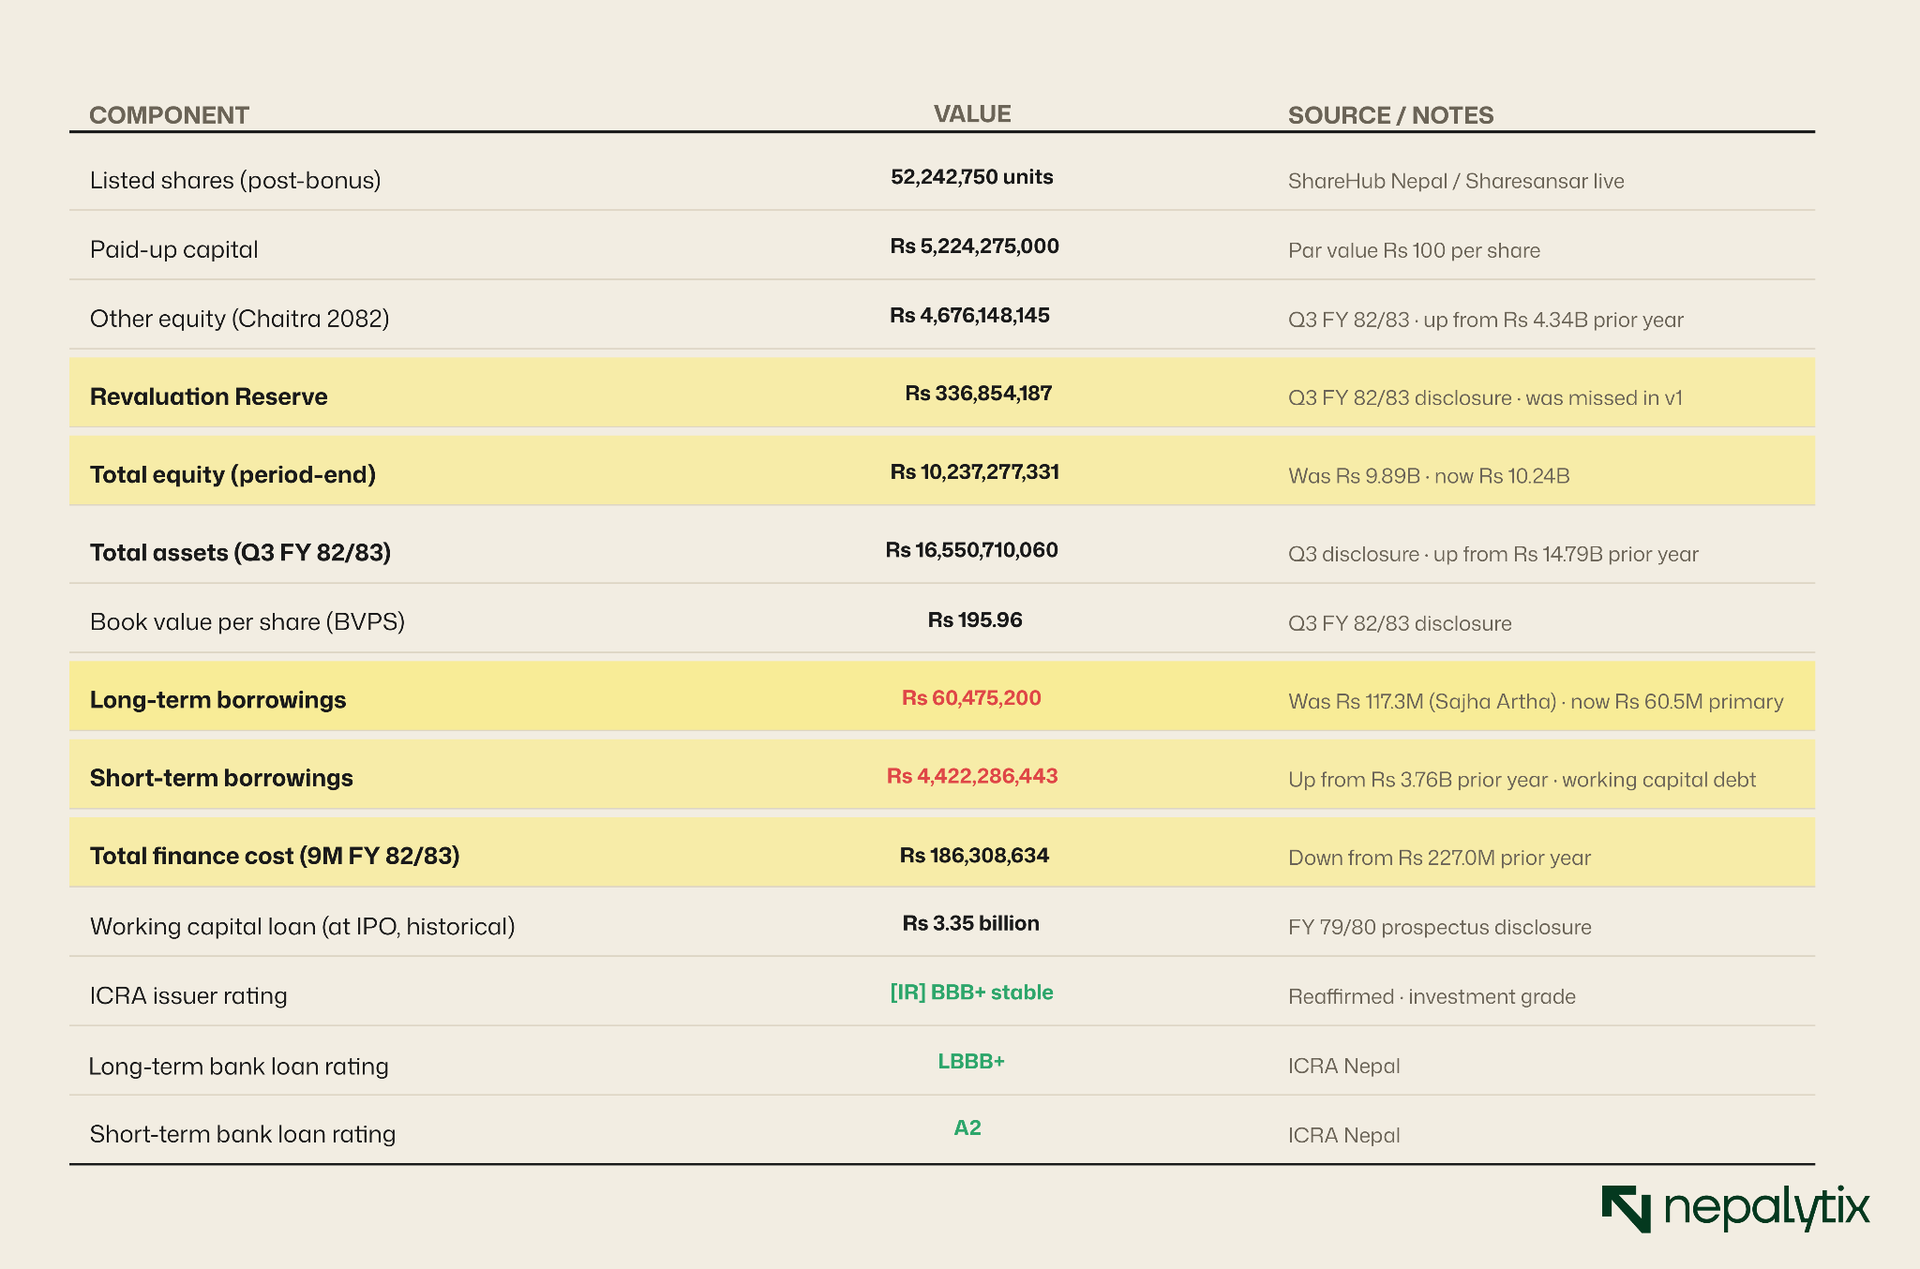
The capital structure has substantial implications for how to read the operating story. With only Rs 60.5 million in long-term borrowings against Rs 10.24 billion in total equity (Rs 5.22B paid-up + Rs 4.68B other equity + Rs 337M revaluation reserve), long-term-debt-to-equity sits below 1 percent interest expense as a percentage of revenue is small around 2.7 percent of revenue on total finance cost. Where the capital structure is less clean than it first appears is on the short-term side: short-term borrowings stood at Rs 4.42 billion at end-Q3 FY 82/83, up from Rs 3.76 billion a year earlier. This is working-capital debt rolled over short-term to fund inventory, receivables, and seasonal operating needs, not term-loan principal. The structure is normal for a manufacturing company at Sarbottam's scale, but the "very low debt" framing requires nuance: net leverage is moderate, not minimal. The credit story remains strong because the company services this debt comfortably from operating cash flow and the ICRA rating reflects that comfort.
The Saurabh Group context matters because it sets the long-horizon strategic environment. The Saurabh Group is a Nepali industrial conglomerate with operations across cement (Sarbottam), steel, tea, and fabric production, with reported annual group turnover exceeding Rs 30 billion and over 3,000 employees. President Bishnu Prasad Neupane personally holds 28.97 percent of Sarbottam Cement. The four-person executive team: Bimal Sawarthia, Tikaram Neupane, Diwas Neupane, and Tenzing Lakden Tamang represents the operating leadership disclosed in IPO documentation.
The strategic value of a conglomerate parent is operational support: shared procurement, intra-group debt facilities at preferential rates, cross-pollination of management and operational practices and credibility with lenders and suppliers. The risk of a conglomerate parent is the inverse: capital allocation decisions can prioritise group-level objectives over single-company shareholder value and inter-group transactions can be opaque. Both characterise the Saurabh Group position; it is a long-term, family-controlled industrial holder, not an institutional financial owner. Operating profile: what Sarbottam actually does
The factory in Sunwal Municipality of Nawalparasi sits on 30 bighas of land (approximately 393.15 ropani) with limestone mining concessions covering 20 square kilometres in Palpa and Chitwan districts. The plant operates a Vertical Roller Mill (VRM) for cement grinding, the company markets itself as the first in Nepal to deploy this technology with claimed energy consumption reductions of up to 50 percent compared to traditional ball mill technology. Daily capacity is 3,000 tonnes of cement and 3,000 tonnes of clinker corresponding to annual production of approximately 20 million cement bags (50kg) and 1.1 million tonnes of clinker.
The integrated clinker production is the operational differentiator. Nepal's cement industry is heavily exposed to clinker import. Most smaller cement plants buy clinker domestically from integrated producers or import it from India or China. The 13 cement plant closures in Koshi state during 2025 cited "clinker shortages" as the cause. A company with captive clinker is insulated from this supply risk and from the margin compression that occurs when clinker prices spike. Sarbottam's 3,000 TPD clinker capacity meets its own grinding requirements and historically has produced surplus for external sale.
The product portfolio spans Ordinary Portland Cement (OPC) 43-grade and 53-grade, Portland Pozzolana Cement (PPC) and Portland Slag Cement (PSC). All three are sold under the "Sarbottam" brand. Cement industry brand positioning in Nepal has historically been built on
(a) compressive strength claims (53-grade vs 43-grade)
(b) earthquake resistance positioning (relevant post-2015)
(c) durability against monsoon weather
Sarbottam positions itself as Nepal's "first eco-friendly cement" with VRM technology. a sustainability angle that targets both retail builders and infrastructure clients with environmental procurement requirements.
Retail pricing per 50kg bag for Sarbottam falls in the upper end of the Nepali market at Rs 720-950 per bag per third-party trade press surveys compared to Rs 520-820 for Hongshi-Shivam and Rs 580-1,200 across the wider market. The premium reflects brand positioning rather than dramatic input cost differentiation and is consistent with the company's strategy of capturing the quality-conscious end of residential and commercial construction demand.
The quarterly cadence: Q1 strong, Q2 weak, Q3 strong
The single-quarter trajectory through FY 82/83 reveals a cement-typical seasonal pattern that helps frame what Q4 might deliver. Single-quarter net profit was approximately Rs 324 million in Q1 derived from the company's annualised EPS disclosure of Rs 26.07 on the pre-bonus share count of 49,755,000, since the Q1 disclosure does not report a single-quarter profit figure directly. Q2 single-quarter was Rs 214 million (derived from cumulative Rs 538.35M minus Q1). Q3 single-quarter was Rs 367 million (derived from cumulative Rs 905.8M minus Q2 cumulative). All three figures are computed from the primary-source quarterly disclosures. The progression maps cleanly onto Nepal's construction calendar.
The quarterly distribution maps onto Nepal's construction reality. Q1 includes the late monsoon through early autumn, construction picks up sharply once the rains end in late August. Q2 spans late autumn through mid-winter, which sees a slowdown as the Tihar-Dashain holiday cycle reduces working days and as cold mountain regions become less constructable. Q3 spans the peak construction season, the dry winter months when most major project work happens before the pre-monsoon humidity returns. Q4 (mid-April to mid-July) sees activity decline again as monsoon approaches.
The cement industry typically front-loads profit into Q1 and Q3 with Q2 and Q4 weaker. Sarbottam's FY 82/83 progression of Rs 324M → Rs 214M → Rs 367M is exactly consistent with this seasonal logic. For Q4 forecasting, the relevant comparison is FY 81/82 Q4 (final quarter of the audited year ending Ashad 2082). If Q4 of FY 81/82 contributed approximately Rs 401 million to the audited Rs 1.004 billion full-year figure (FY 81/82 nine-month was Rs 603 million, so Q4 = full year minus 9M = 1004 - 603 = Rs 401 million), and if Q4 FY 82/83 grows at a similar rate to the YoY growth observed in Q1-Q3 (50%), full-year FY 82/83 net profit lands in the Rs 1.2-1.4 billion range.
A normalised forward EPS estimate, dividing roughly Rs 1.25 billion in expected full-year profit by 52.24 million shares, lands at Rs 23.9 broadly consistent with the Q3 annualised reading of Rs 23.12 and with the trajectory from FY 81/82's Rs 20.19. At Rs 839, that implies a forward P/E of roughly 35×, slightly below the current trailing P/E of 36.5×.
Valuation: what Rs 839 is actually paying for The relevant valuation question for any IPO-recovery story is whether the market is paying for the recovery that has happened, the recovery that might continue or neither. For Sarbottam at Rs 839, the answer is partial on each.
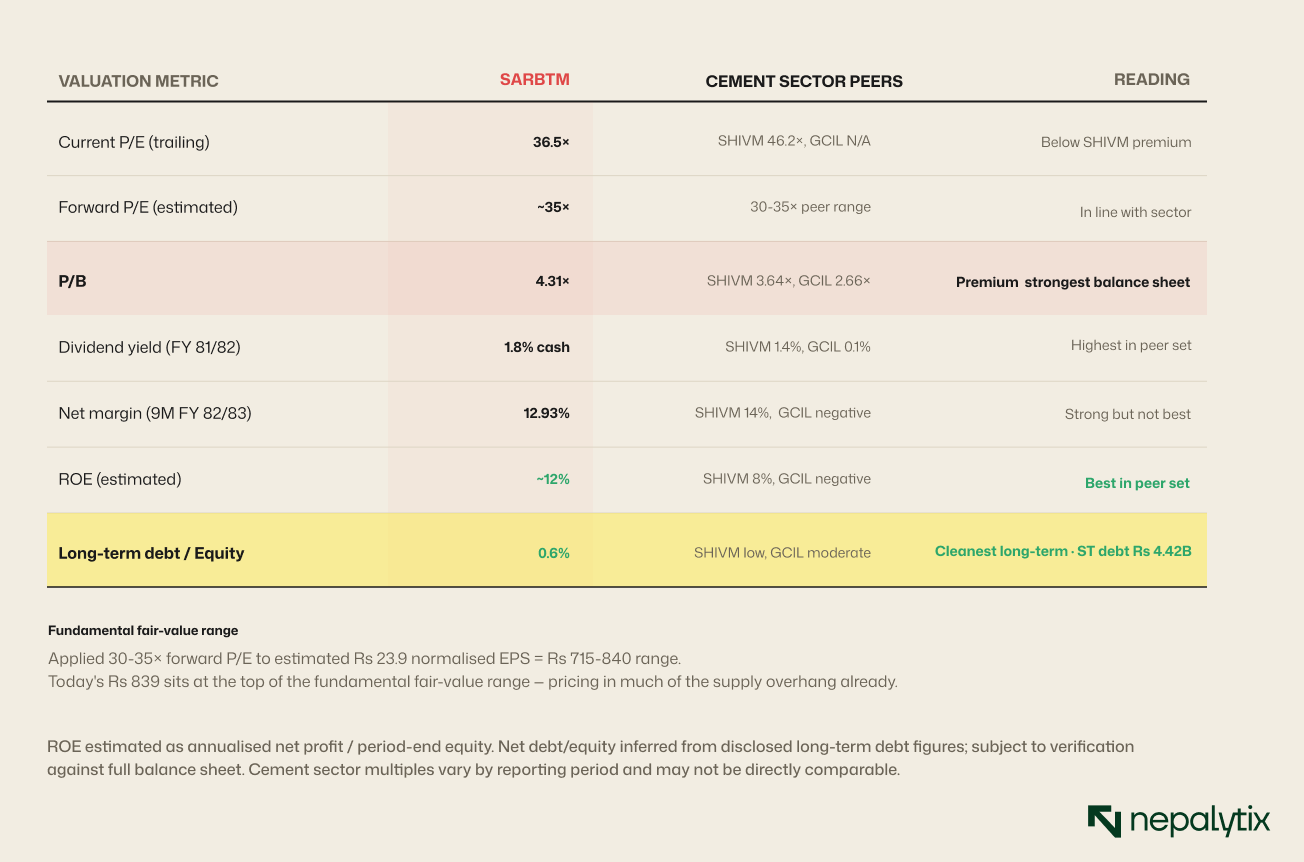
The fundamental reading: Sarbottam is trading at a P/E roughly in line with sector, a P/B at a premium to both listed peers (consistent with the strongest balance sheet), a dividend yield at the high end of the sector, the highest ROE in the peer set and the lowest leverage. By every fundamental metric except absolute size, Sarbottam is the strongest listed cement operator in Nepal.
The price action does not reflect that strength. As established in earlier sections, the dominant force compressing valuation is technically the supply overhang from the upcoming lock-in expirations. A reasonable framing is that Sarbottam is being priced as if the QII supply unlock in September 2026 will produce a 10-15 percent price decline, and as if the promoter unlock in March 2027 carries additional risk on top.
If those expectations are correct, Sarbottam at Rs 839 is fairly priced, the discount to fundamental fair value compensates the marginal buyer for the supply risk ahead. If those expectations are too pessimistic, for example if the QII shareholders are mostly long-term institutional holders who choose to hold rather than sell or if the Saurabh Group does not engage in promoter dilution at unlock then the stock is currently trading at a meaningful discount to its fundamental value.
The fundamental fair-value range, based on a 30-35× forward P/E (consistent with the cement sector range) applied to a Rs 23.9 normalised EPS estimate, lands at Rs 715-840. The current Rs 839 sits at the top of that fundamental range. That suggests the market is currently pricing closer to fair-value than to a discount; the supply overhang concern is already largely incorporated.
Catalysts: what could move the picture
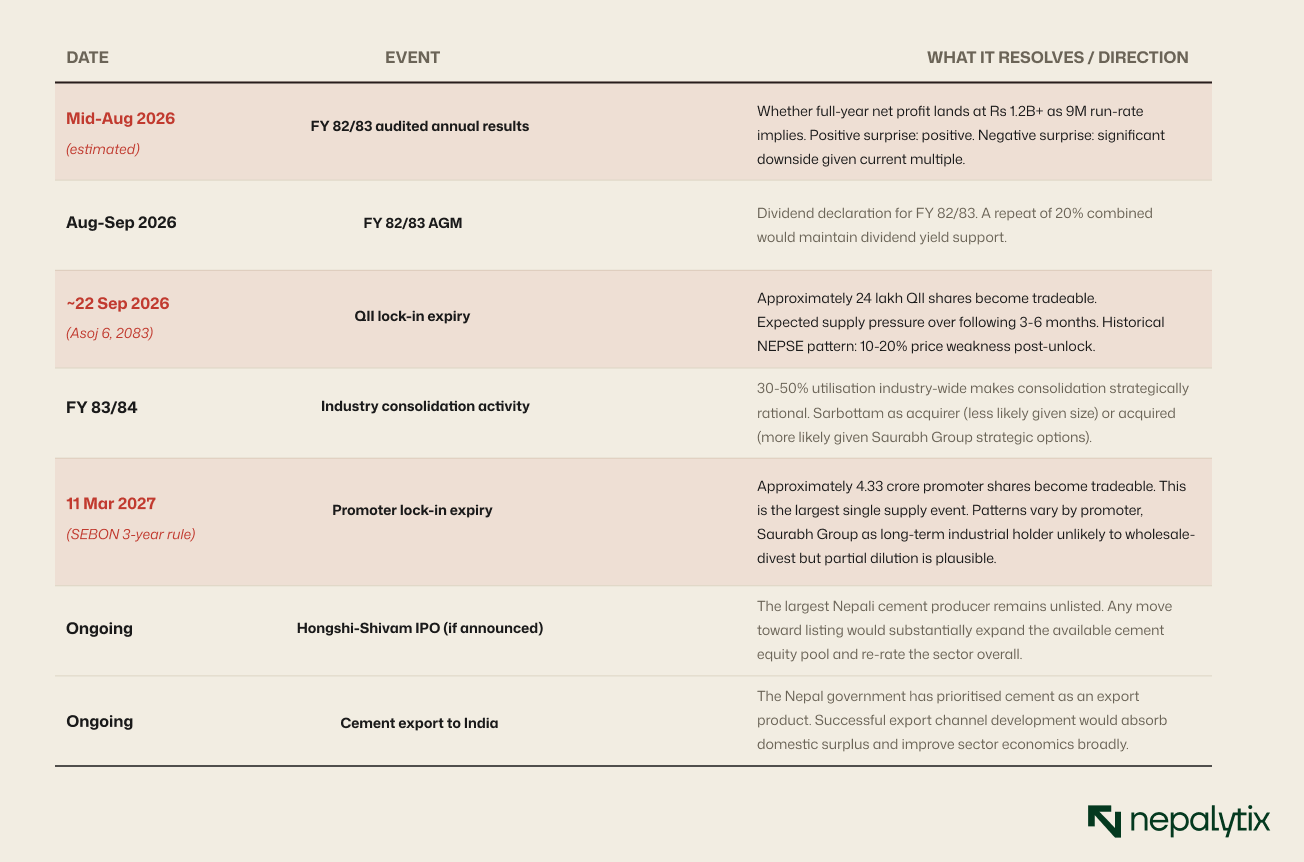
The catalyst calendar has three immediate forced disclosure events (Q4 FY 82/83, AGM, QII unlock) and one binary supply event (promoter unlock). The QII unlock in approximately four months is the single most consequential near-term event because it is the first time that locked supply enters the float since IPO. The pattern observed at GCIL's approach to its July 2026 promoter unlock sustained price weakness, declining volumes, technical breakdown is the relevant comparison case, though GCIL's loss-making operating profile is a confounding factor.
The risks not yet discussed
Three risks specific to Sarbottam deserve explicit treatment beyond the supply-side discussion:
Cement demands cyclicality. The FY 79/80 trough that produced Sarbottam's 84 percent profit decline was driven by a sector-wide demand collapse not by company-specific problems. A similar event would compress Sarbottam's profits regardless of margin quality. Domestic cement demand depends on government infrastructure spending, residential construction activity and remittance-funded private building, all of which are exposed to broader macroeconomic conditions. Nepal's 2026 fiscal stance and the trajectory of remittances (covered in our Monday Signal piece) bear on the demand outlook.
Input cost reversal. The 100-150 basis point margin contribution from fuel and clinker is the most cyclical element of the Q3 result. A reversal in coal prices spiking on geopolitical shock, fuel oil tightening or clinker import constraints would compress margins by potentially more than they expanded. The interest expense saving is durable; the input cost saving is not.
Regulatory and tax changes. Cement is heavily exposed to sector-specific taxation, mining royalty regimes and environmental regulations. Any change in
(a) excise duty on cement
(b) royalty rates on limestone extraction or
(c) emission standards that require capital expenditure for compliance, could meaningfully affect Sarbottam's economics.
The Saurabh Group's industrial conglomerate status provides some buffer through diversification but cement is a regulated commodity industry and that exposure cannot be eliminated.
The position by cohort
Different shareholders face different decisions. The IPO cohort both QII and public has already realised more than 100 percent total return including dividend. The question for that cohort is whether to crystallise the return ahead of the lock-in expiries that will trigger their fellow holders' selling or to hold through. The answer depends on the individual investor's view of the supply absorption capacity of the market and on their alternative use of the capital.
The post-listing peak buyer (Rs 1,083 cohort) sits at a meaningful loss, has likely been waiting two years for breakeven, and faces a 22-month additional wait if the operating thesis is going to produce another leg of return. For that cohort the question is whether to crystallise the loss now or wait through the unlock-related volatility.
The buyer at today's Rs 839, the marginal pricing buyer this entire analysis has been built around, is paying a price at the top of the fundamental fair-value range against a known supply event in approximately four months with a stronger known supply event 22 months out. The reading is that today's price is rational only if
(a) the QII shareholders are mostly hold-not-sell
(b) the operating thesis continues to deliver
(c) the broader cement sector demand outlook does not deteriorate.
None of these is guaranteed, but none is unreasonable.
The non-shareholder reading is different. For an investor who has not yet bought Sarbottam, the question is whether the discount to fundamental fair value that may emerge post-QII-unlock is the better entry point than today's price. Historical NEPSE patterns suggest that post-unlock weakness creates 6-12 month entry windows at 10-20 percent discounts to pre-unlock prices. If that pattern holds for Sarbottam, an entry point in the Rs 700-770 range becomes plausible in late 2026 or early 2027.
The closing position
Sarbottam Cement is the strongest listed cement operator in Nepal by every fundamental metric except absolute size. It has the highest EPS, the highest ROE, the strongest dividend, the cleanest balance sheet, the highest credit rating and the most defensible operational position (captive clinker, VRM technology, established brand, integrated production). It is also the listed cement stock with the heaviest near-term supply overhang, the lowest float and the worst 12-month price performance.
The two-year operating thesis that the IPO sold in 2024 has delivered. Revenue recovered from the FY 79/80 trough of Rs 5.38 billion to FY 81/82 audited Rs 9.55 billion. Net profit recovered from Rs 207 million to Rs 1.004 billion. The 9-month FY 82/83 trajectory points to a Rs 1.2-1.4 billion full-year figure that would extend the recovery. Shareholders who entered at IPO have realised total returns above 100 percent. By any reasonable standard, the operating engine of the company is working.
The technical setup is the binding constraint. With 87.1 percent of the share count locked and lock-in expiries scheduled for September 2026 (QII) and March 2027 (promoters), the 10.9 percent free float is doing the work of pricing a Rs 43.8 billion market cap. The market has compressed the price toward but not yet below the fundamental fair-value range, on the rational expectation that supply absorption will be the dominant force over the next 22 months.
The cement is working. The float isn't. The next two years of Sarbottam's stock price are about which one of those facts the market chooses to weigh more heavily.
The forward question is whether the operating engine can deliver enough additional performance through margin expansion, capacity addition, sector consolidation or favorable regulatory development to offset the technical pressure of the unlock schedule. The answer depends on Q4 FY 82/83's audited print in mid-August, on whether the FY 82/83 dividend matches or exceeds the FY 81/82 20 percent combined payout, on QII shareholder behaviour at unlock, and on the Saurabh Group's strategic posture as promoter unlock approaches. Each of those is observable and dated.
What Rs 839 today is not paying for is a guaranteed third leg of return. What it is paying for is participation in a cement business with strong fundamentals trading through a supply absorption cycle that may take 18-24 months to clear. For investors with the patience and the conviction to hold through that cycle, today's price likely sits inside the fundamental fair-value range. For investors looking to enter at maximum discount to fundamentals, the post-QII-unlock window in late 2026 is likely a better entry point. For the IPO cohort still holding, the trade has already worked; what remains is whether to optimise the realisation.
Cement is ultimately a commodity with brand-driven local pricing power and structural overcapacity. Within that context, Sarbottam has built through the Saurabh Group's industrial backing, the captive clinker integration, and the VRM differentiation, a defensible operational position. The IPO that brought it public did so at the cyclical bottom and at a transparent book-built price. Two years later, the operational thesis was validated. The market's remaining question is about the share register, not the cement plant.