Markets Weekly June 12: Investors Defended 2,700. Speculators Ignored It
NEPSE tested 2,700 as speculative money drove newly listed stocks into repeated circuits, while weak liquidity and falling dividends widened the gap between momentum and fundamentals.

NEPSE touched 2,702 and someone bought it. The week still closed down 1.2 percent the third straight sitting on the same shelf it spent five days probing. Upstairs, paper that has existed for two weeks hit its circuit five days running. That gap is the whole edition.
I. NEPSE Tested 2,700 All Week
A market doesn't decide anything at the floor of its range. It finds out who's still willing to buy. For two years NEPSE has traded inside a band roughly bounded by 2,700 on the downside and the high 2,800s on the up. Bands like that aren't lines on a chart; they're a running argument between the people who think the index is cheap down there and the people who need to sell regardless. This week the argument went all the way to the lower bound. Monday opened with a 20-point drop. By mid-morning Tuesday the index printed 2,702 close enough to the floor to count as a test of it.
Then the test got answered. Buyers stepped in, the index recovered most of the day's hole, and Tuesday closed down just 1.54. That single fact a defended 2,702 is the most bullish thing that happened in five sessions and it's worth sitting with, because nothing else in the week supports it.
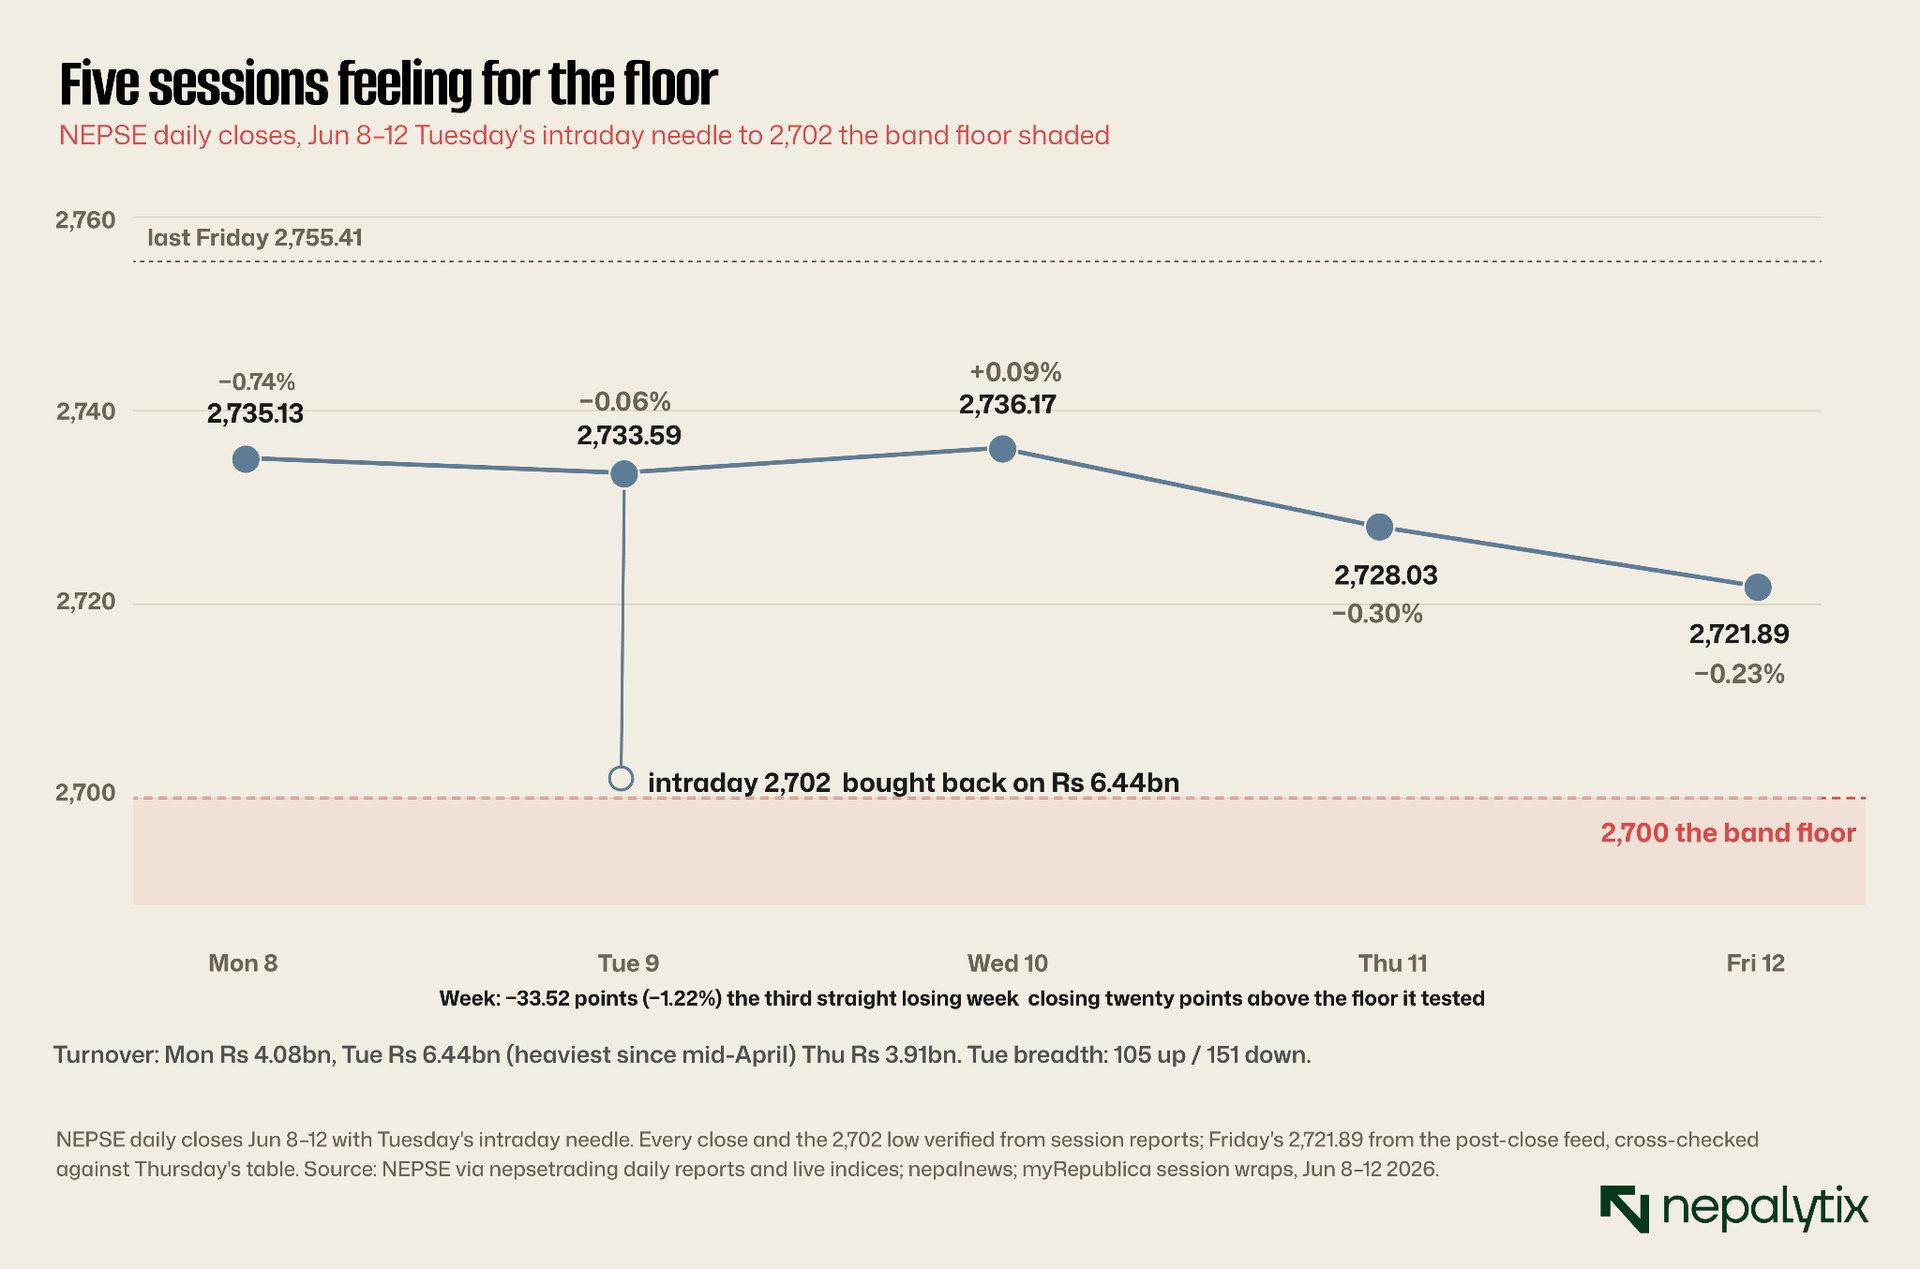
Here's the line itself. Five closes, all of them below last Friday's 2,755.41, none of them below 2,700. The index didn't recover Wednesday's +2.58 was the only green day and Thursday and Friday quietly erased it but it didn't break either. It drifted lower inside the band and came to rest at 2,721.89, twenty points off the floor. Read on its own, that looks calm. It isn't. It's a slow leak with a hard stop underneath it, and the close-only chart hides which of those two is doing the work.
To see that, stop looking at where each day finished and look at where each day fell to.
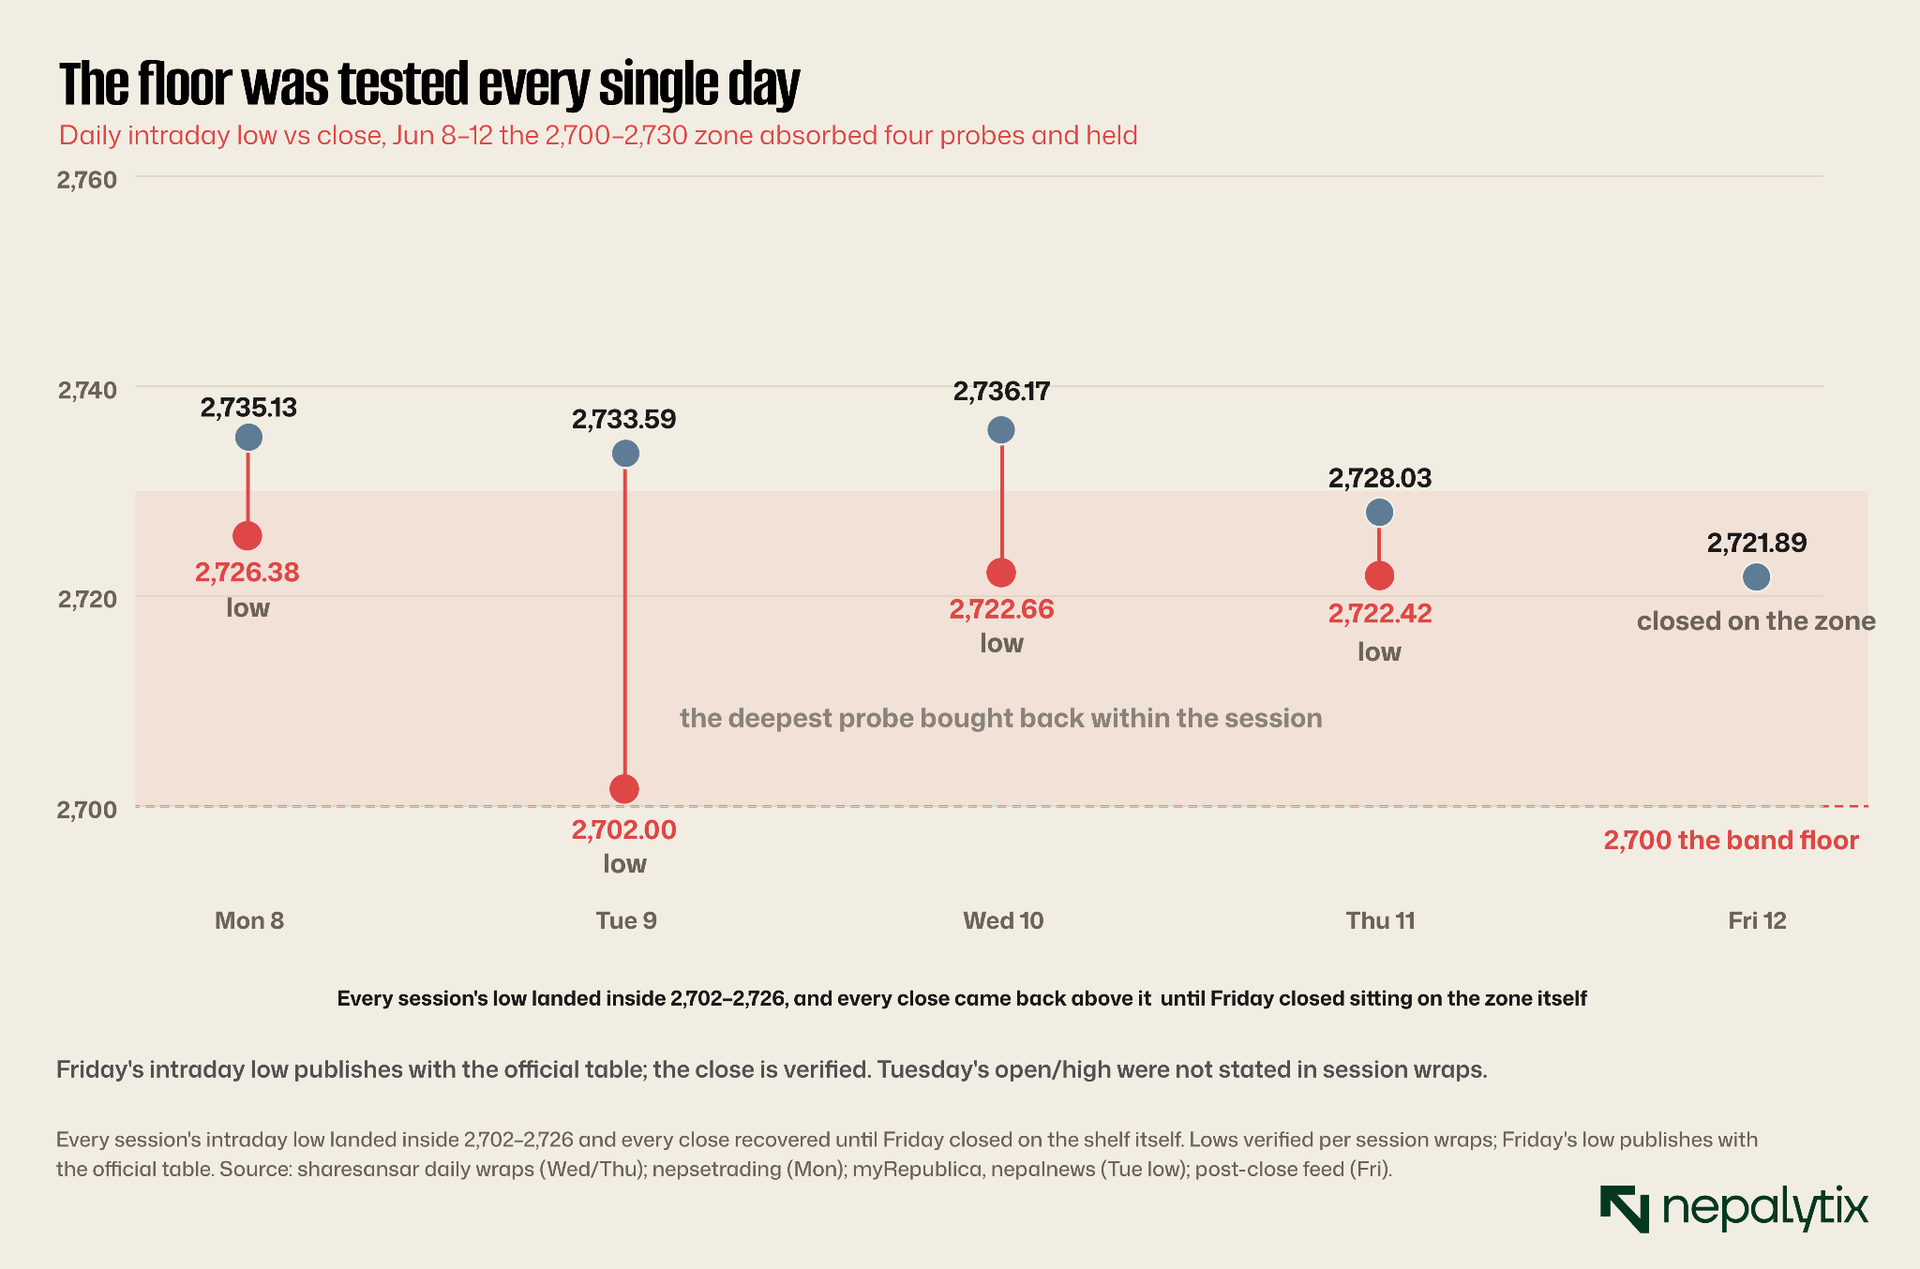
This is the chart the week actually wrote. Four consecutive sessions reached down into the same fifteen-point shelf 2,726 Monday, 2,702 Tuesday, 2,722 Wednesday, 2,722 Thursday and four consecutive times the close came back up off it. That repetition is not noise. A level that gets probed once and holds is luck; a level that gets probed four days running and holds each time is a real bid sitting underneath the market, the kind that takes genuine supply to break. Which is exactly why Friday matters: the index didn't bounce off the shelf this time, it closed on it, at 2,721.89. The bid is still there. It's just out of the room above it.
A bid you can see in the lows should be visible in the volume too. It is for exactly one day.
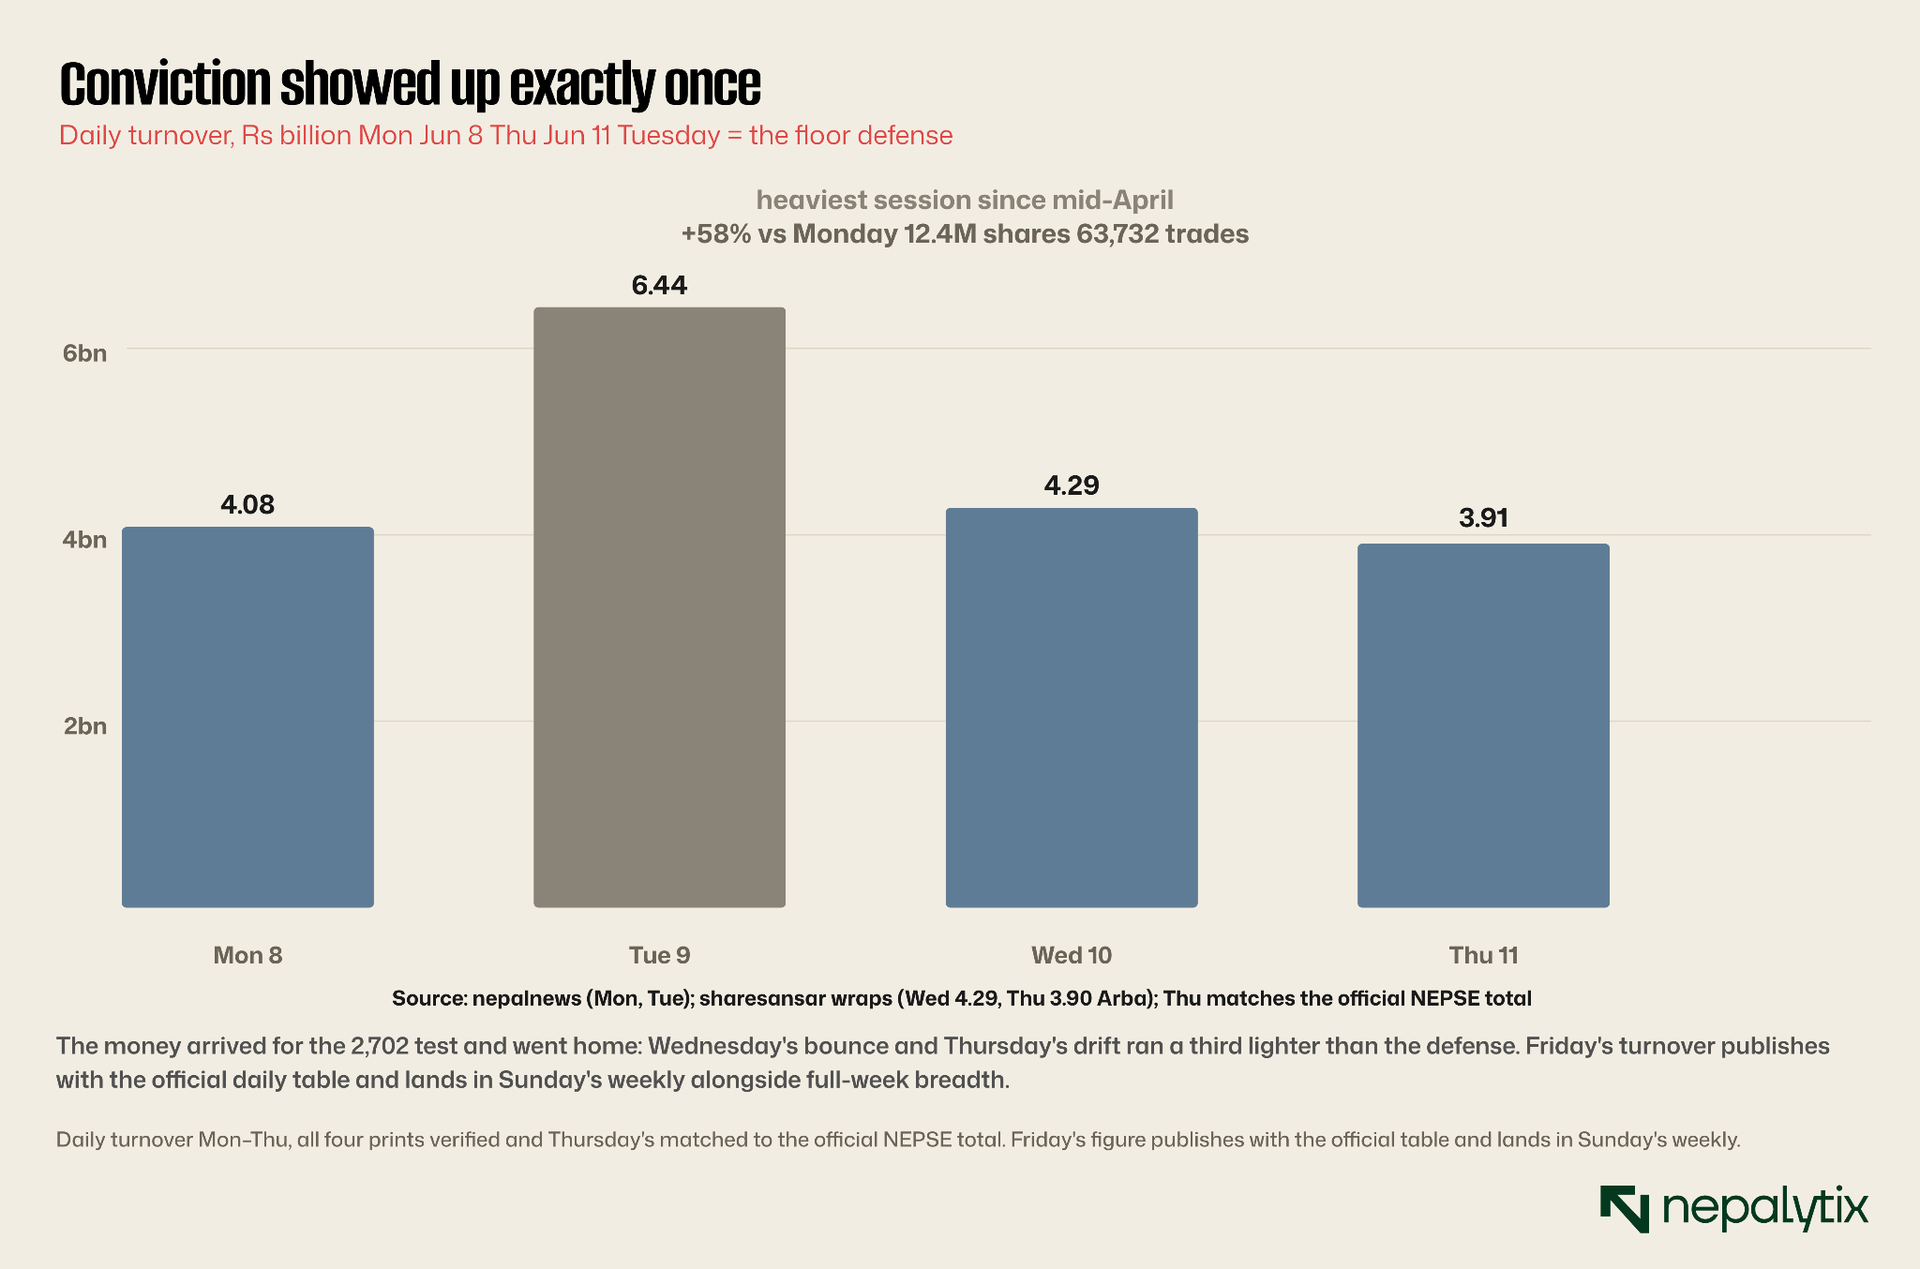
Tuesday's defense of 2,702 cost Rs 6.44 billion, the heaviest session since mid-April 58 percent above Monday, more than 12 million shares through 63,732 trades. That is what conviction looks like in turnover: a real crowd showing up at a price. The tell is what came next. Wednesday's bounce ran on Rs 4.29 billion and Thursday's drift on just Rs 3.91 billion each roughly a third lighter than the defense. The people who bought the floor did not stick around to push the recovery. They defended the price and went home. A floor held by one heavy session and abandoned the next two is held, yes, but it is not the same as a market that wants to go up.
So if the index-level money showed up once and left, where did the conviction that stayed go? Friday's sector tape answers that, and it sets up everything that follows.
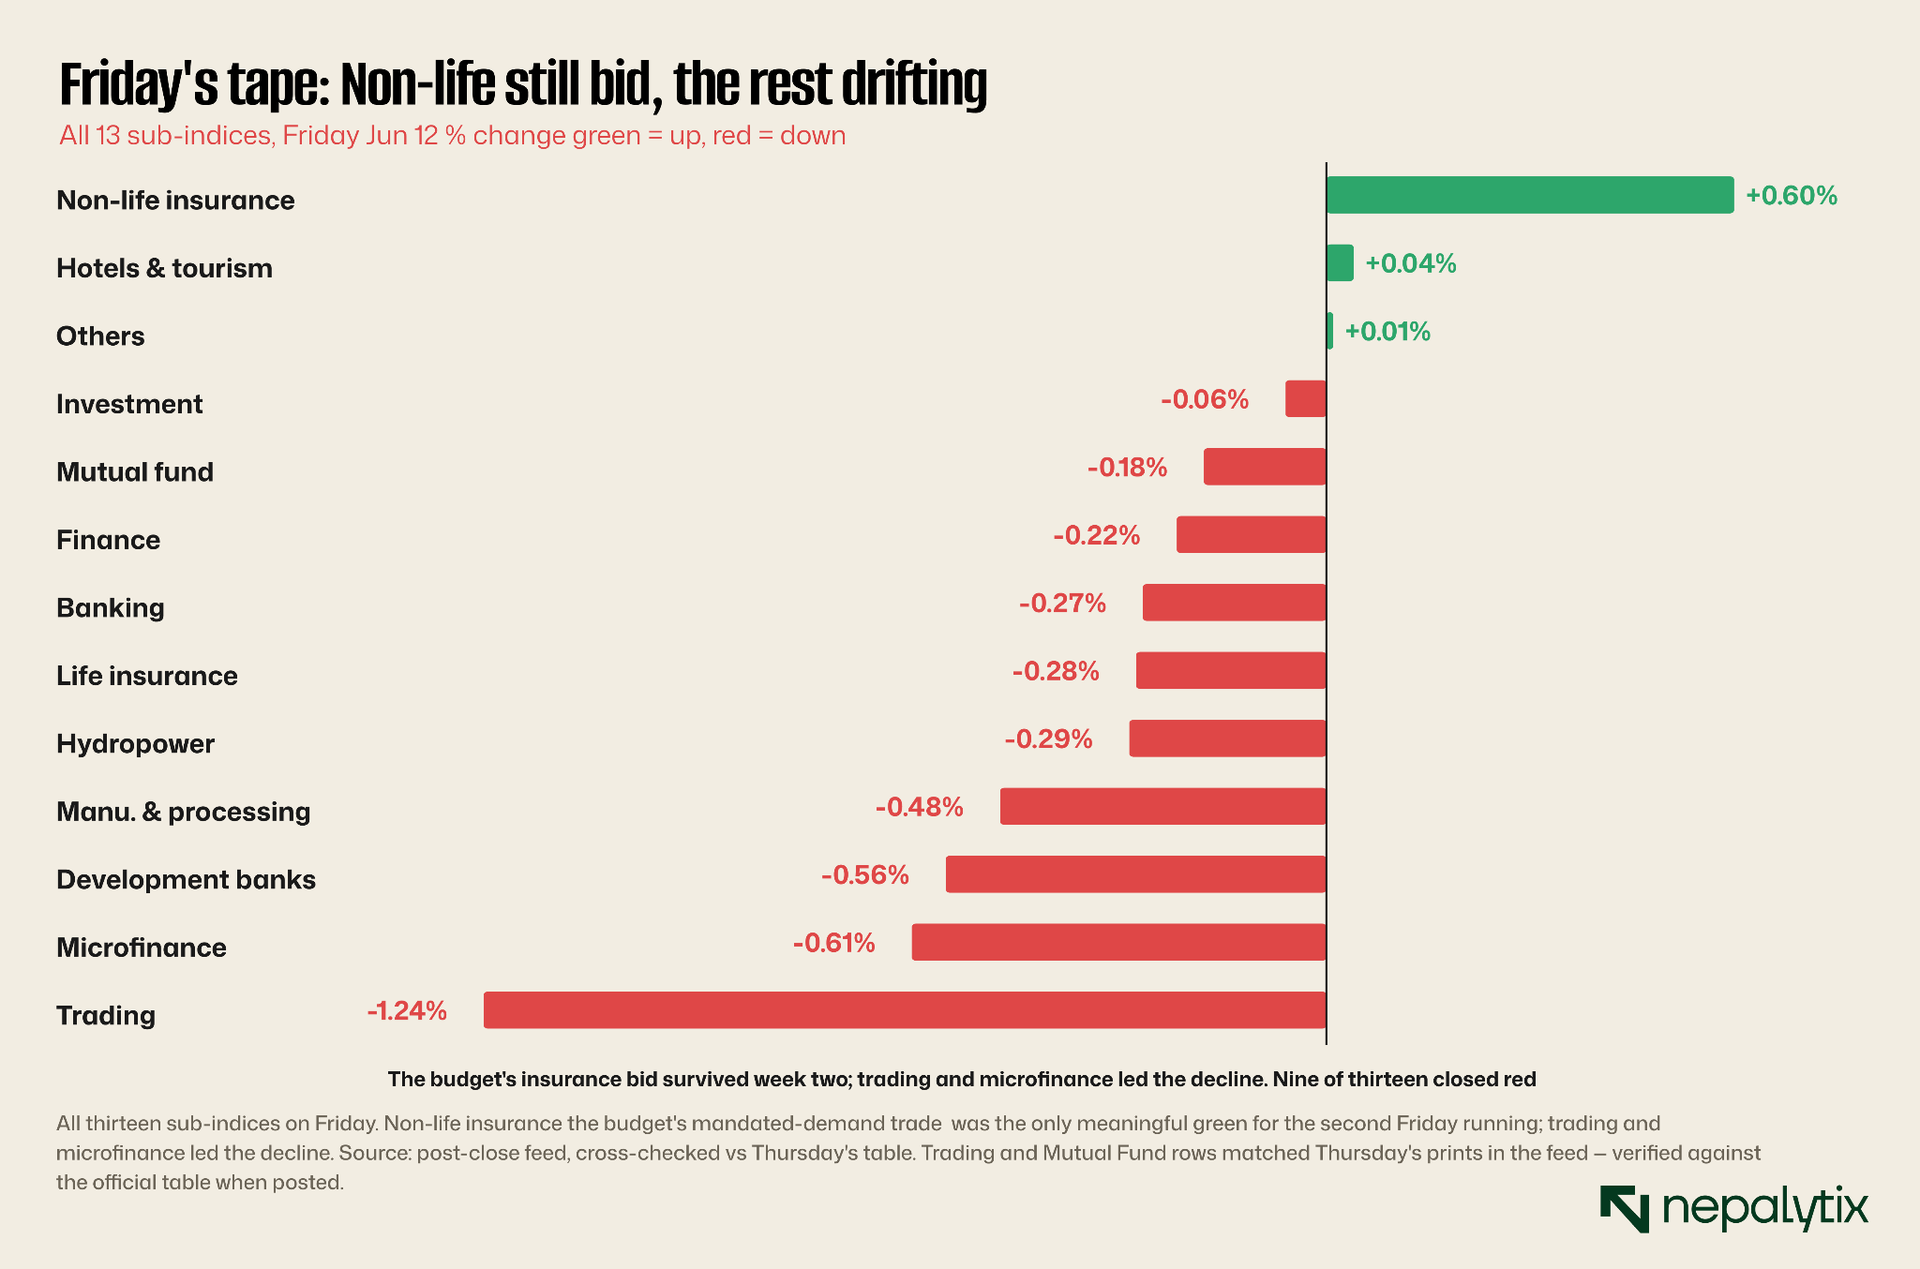
Nine of thirteen sectors closed red. The exception that matters is non-life insurance, green for the second Friday running the one corner where the budget created mandated demand, and the one corner buyers keep returning to. Everything heavy is on the floor; the bid has retreated into a single policy-driven theme. Hold that shape in your head broad red, one narrow green because Section II is the same market photographed from the opposite side: the narrow green isn't insurance there. It's paper two weeks old.
II. Speculation Moved Upstairs
While the index fought for its floor, the hottest trades on the exchange were companies the market had barely met. Kalinchock Hydropower is a 5-megawatt run-of-river plant in Dolakha. It was listed on May 22. In the thirteen sessions since, it has gone from a listing-week low of Rs 300 to a Friday close of Rs 1,193.20 just under four times its money in under three weeks. It hit the 10 percent-plus positive circuit on June 5, again on June 8, and again on June 10. Two of those circuit days were the worst sessions of the week for everyone else. While the broad market was being marched down to 2,702, this stock was being marched straight up, untouched by any of it.
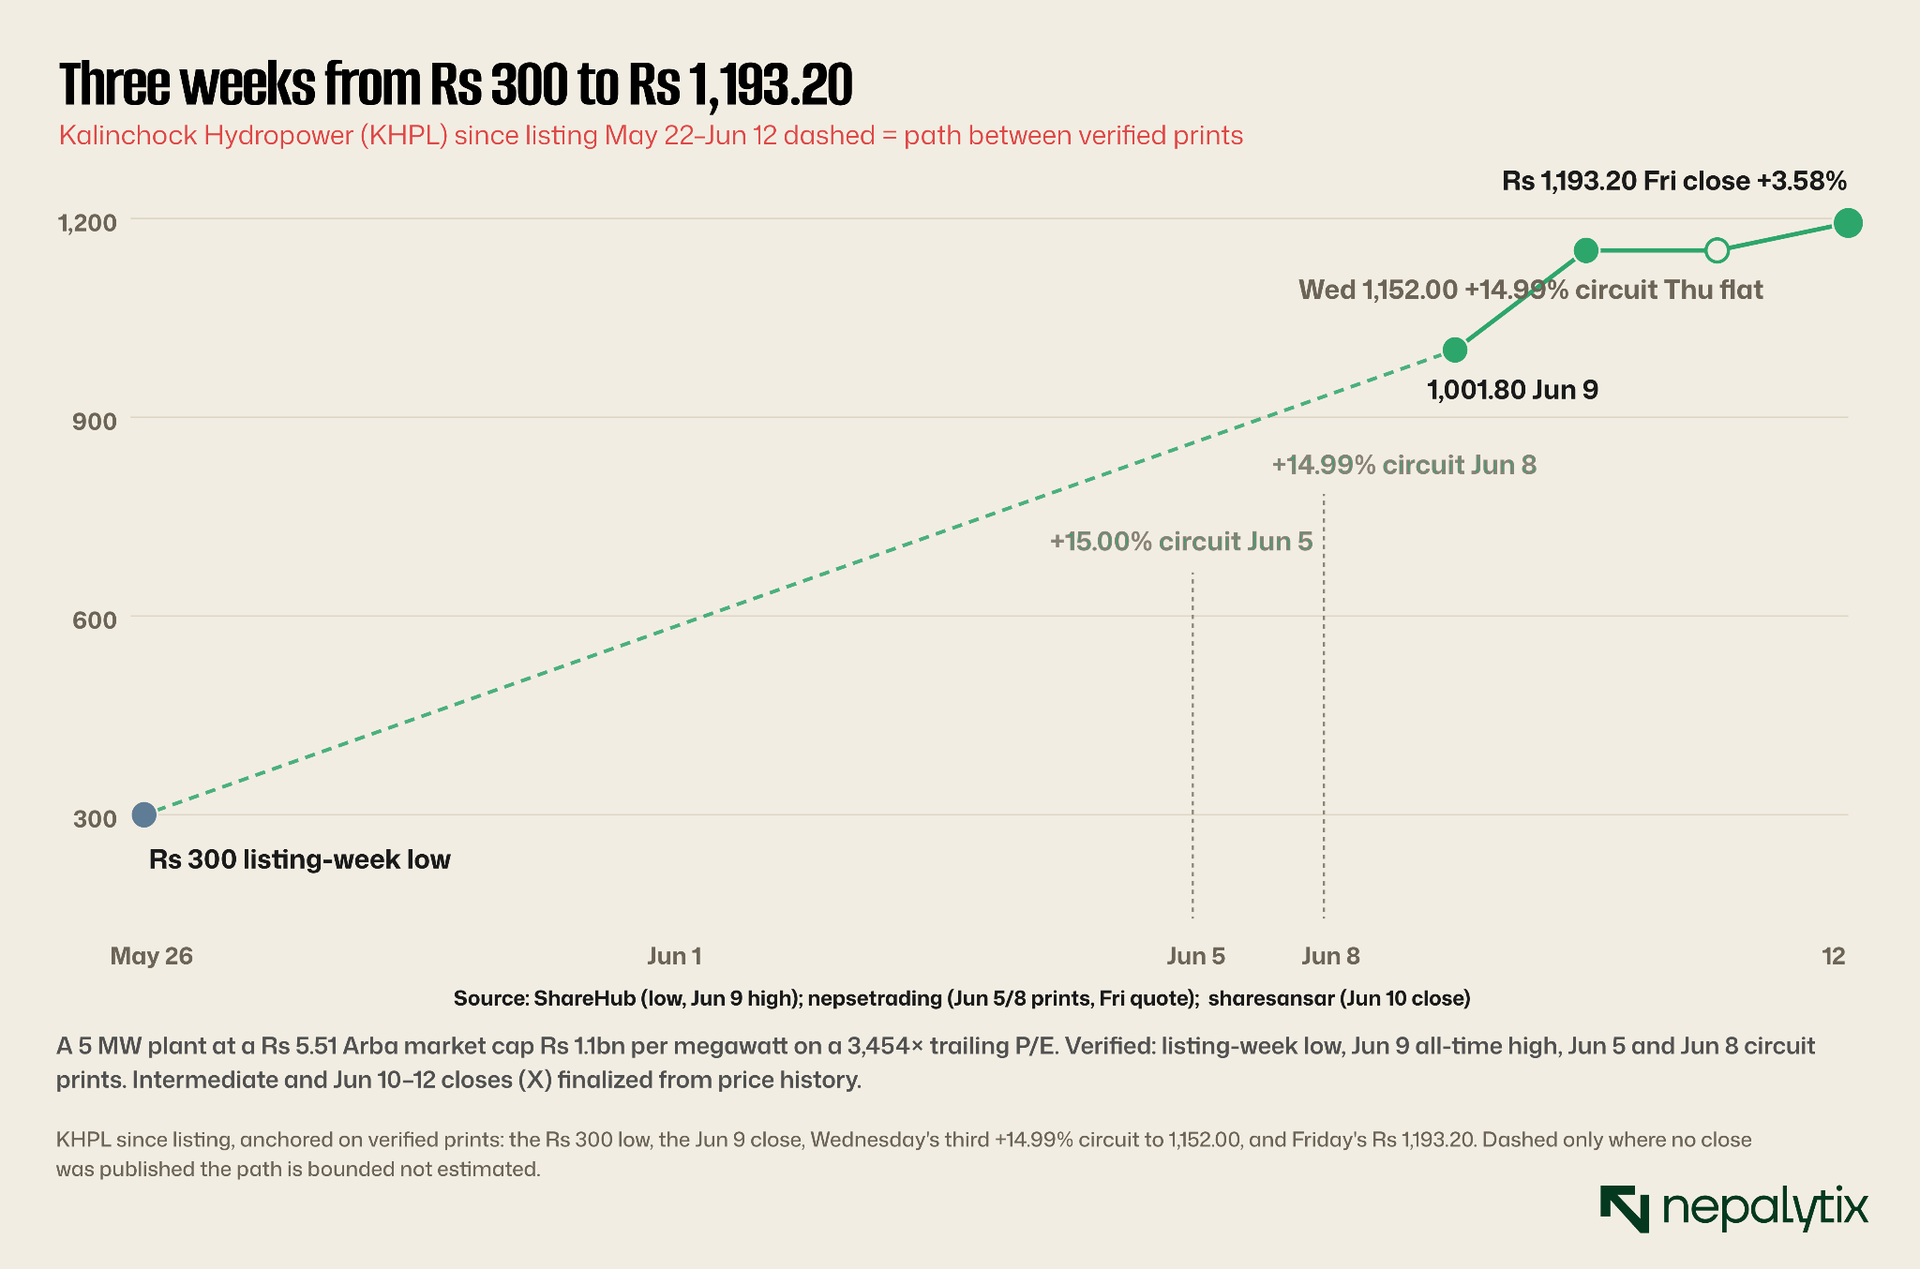
The shape of that climb is its own warning. A stock that prints three circuits in a fortnight isn't being valued; it's being bid by people who assume tomorrow's buyer will pay more, and so far tomorrow's buyer always has. The one crack worth noting is Friday's print: +3.58 percent not the circuit. The first session in this run where the move wasn't vertical. One soft day doesn't end a melt-up but melt-ups end with soft days, and this is the first one Kalinchock has had.
If Kalinchock is the late reel, Sopan Pharmaceuticals is the same film from the opening frame.
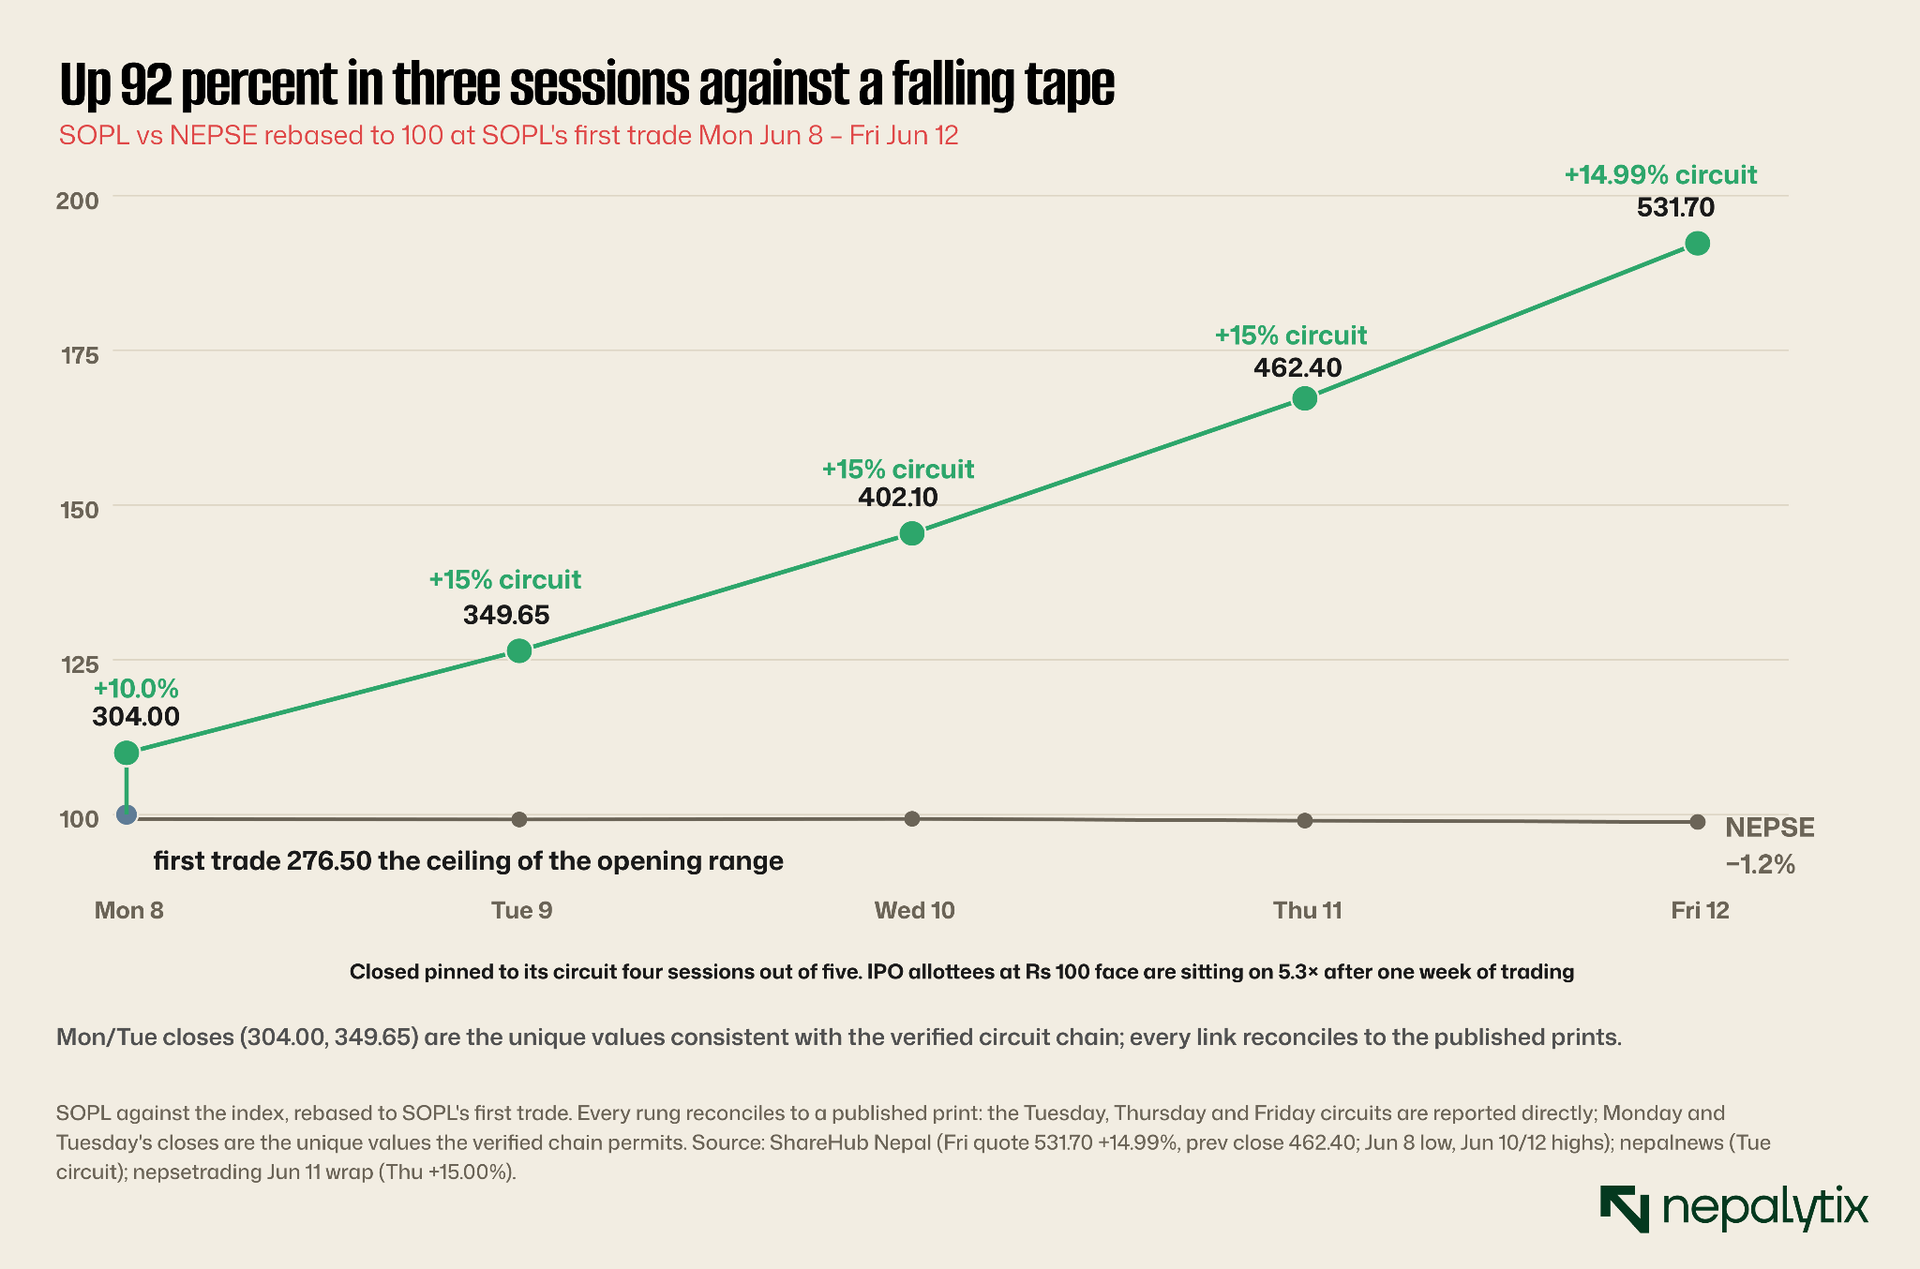
Sopan listed June 5. Its very first trade was Rs 276.50 the exact ceiling of its permitted opening range which means there was no price discovery at all on day one, only a queue of buyers and no sellers. It then closed at its circuit in four of its five sessions this week: 304, 349.65, 402.10, 462.40, 531.70. That is up 92 percent in a week the index fell 1.2 percent. Anyone allotted shares at the Rs 100 IPO price is sitting on better than five times their money. And the company underneath that price carries a CARE-NP B (Is) credit rating, the rating agency's formal label for high default risk. The market is paying five-bagger prices for a sub-investment-grade balance sheet, because the chart goes up.
Strip away the share prices for a second and ask what's actually being bought. The honest unit isn't rupees per share it's rupees per megawatt of real generating capacity.
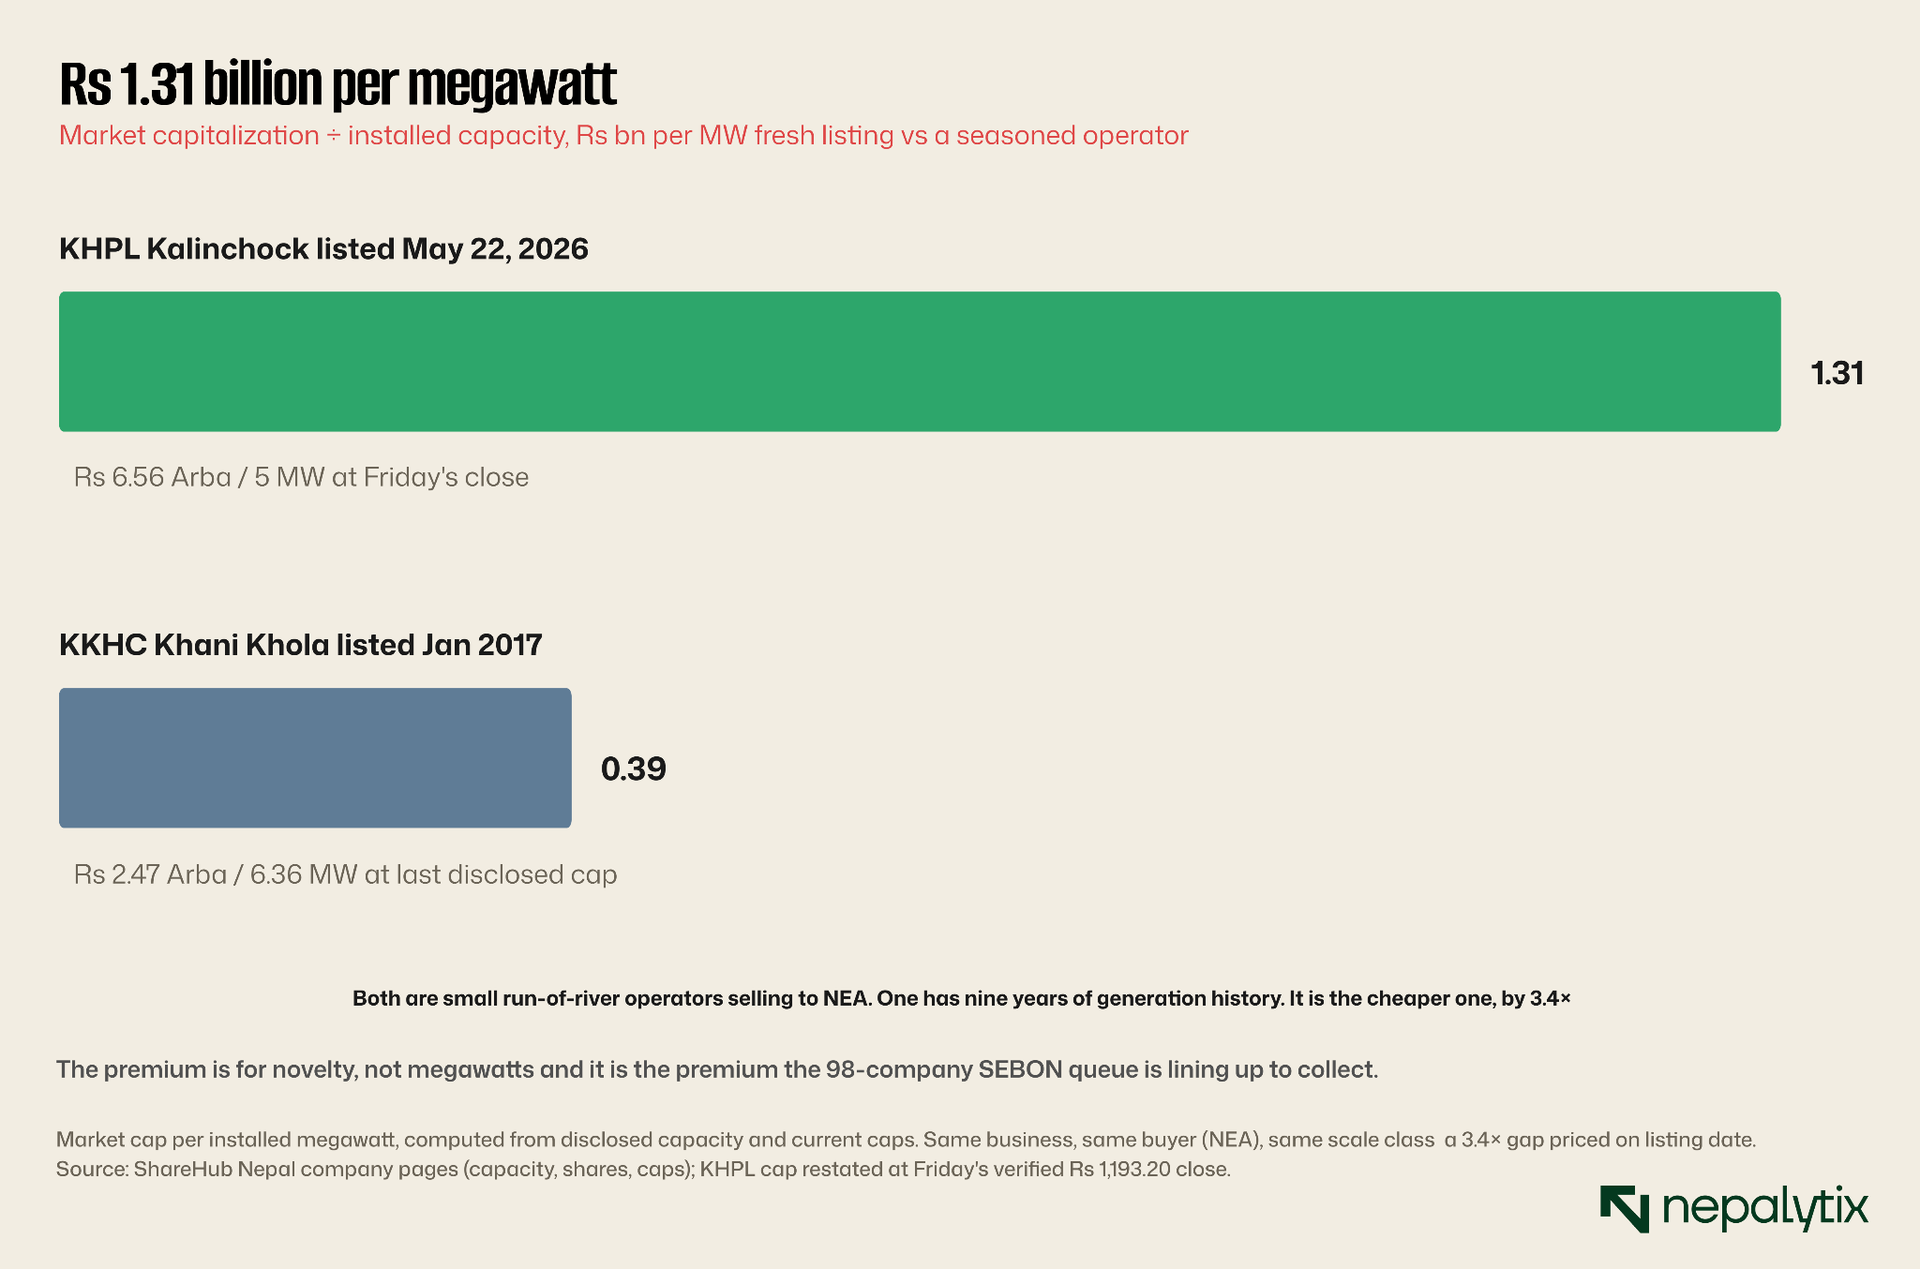
At Friday's close Kalinchock is worth Rs 6.56 arba for its 5 megawatts Rs 1.31 billion per megawatt. Khani Khola, an operating hydro that has been listed since 2017 and runs 6.36 megawatts across two plants, trades at about Rs 0.39 billion per megawatt. Same business, same single customer in the national grid, same broad scale. The market is paying roughly 3.4 times more for the megawatt that listed three weeks ago than for the one with nine years of delivered electricity behind it. The premium isn't for the power. It's for the freshness.
You would expect demand this indiscriminate to cool the moment the secondary market turns. It hasn't, the primary market is, if anything, hotter.
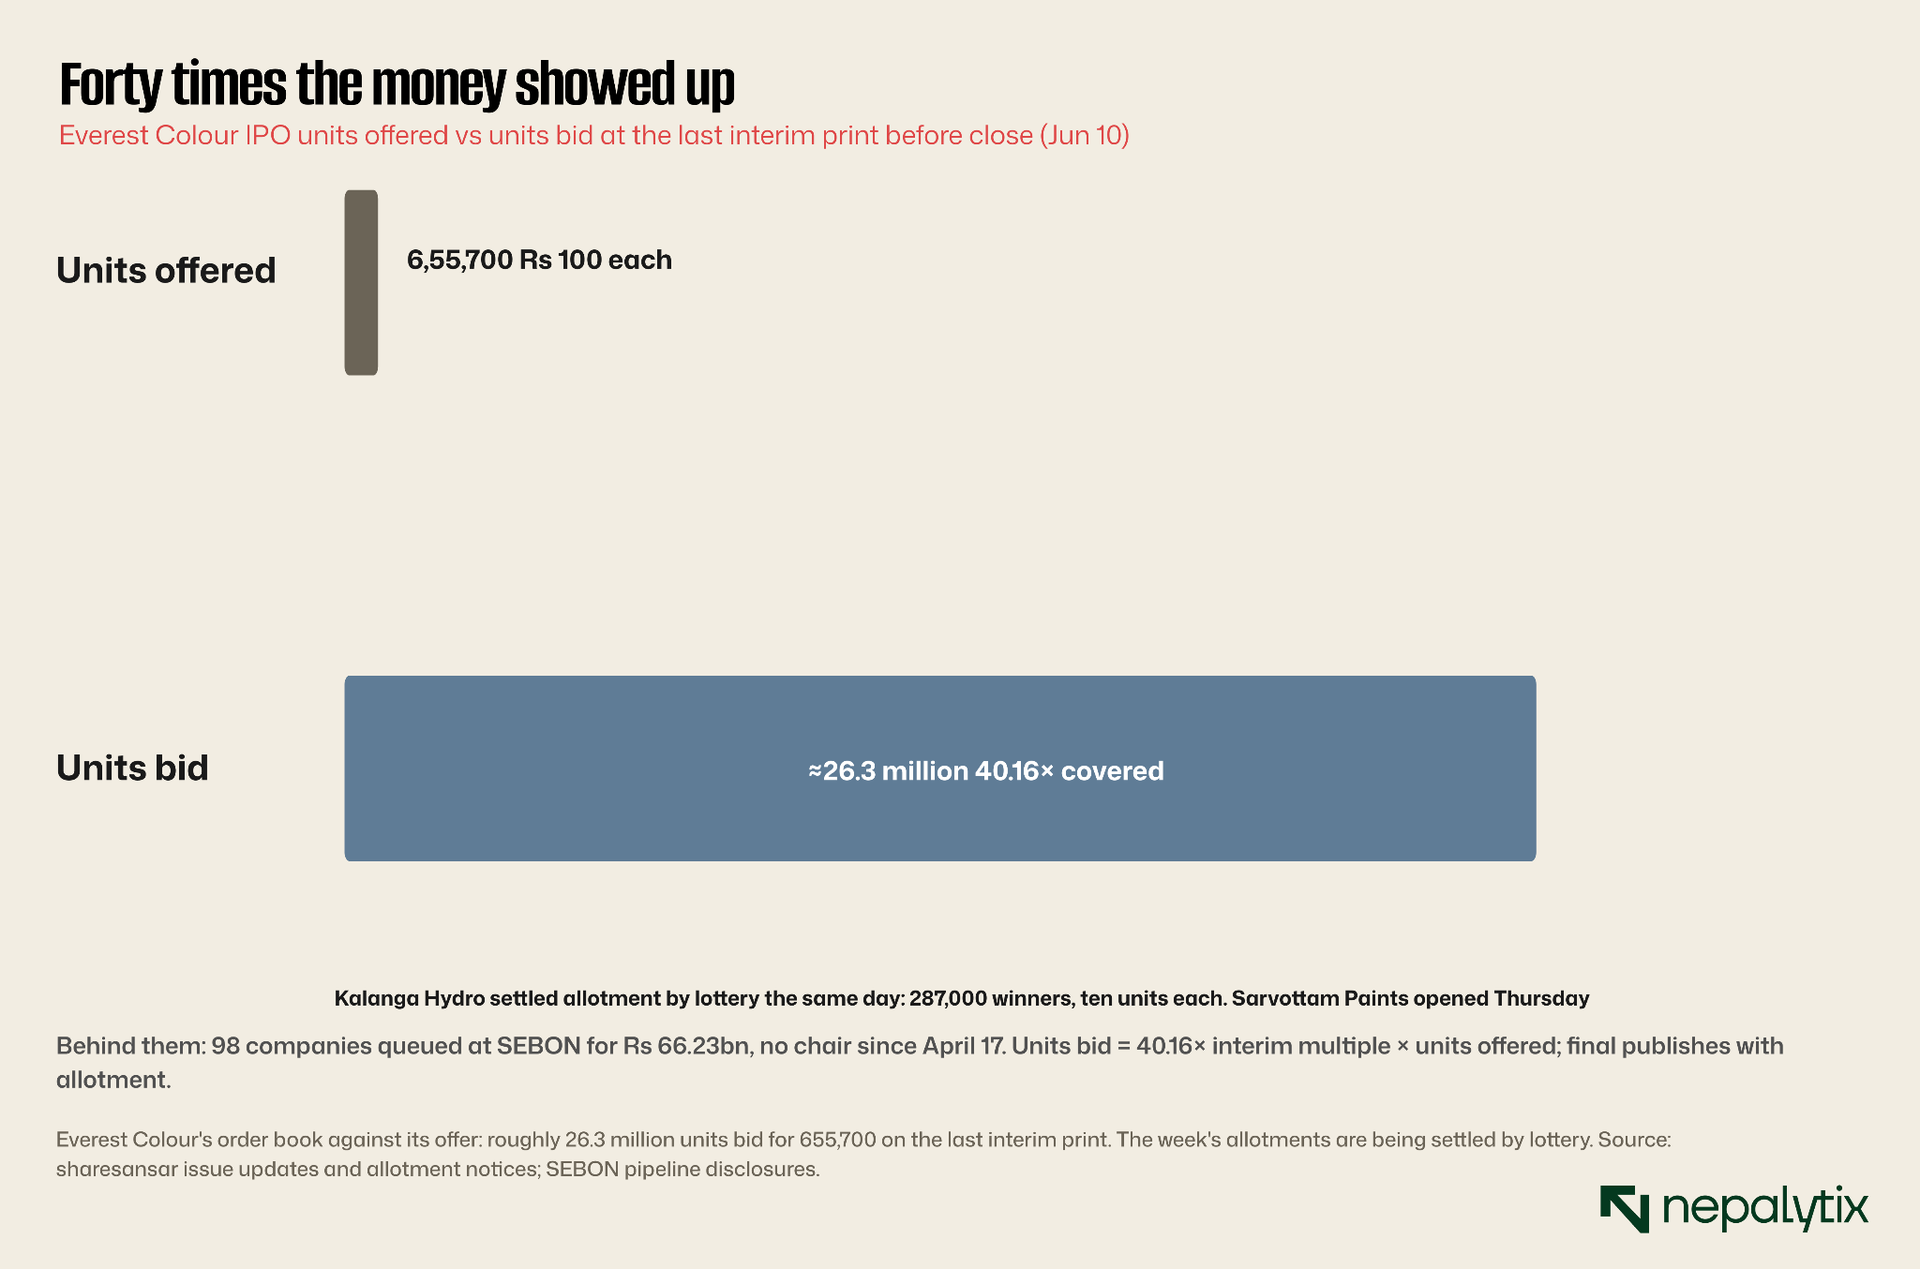
Everest Colour offered 655,700 units and drew bids for more than forty times that roughly 26 million units of demand into its closing day. Kalanga Hydro couldn't even allot by application; it had to run a lottery, and 287,000 winners drew ten units apiece. And the queue behind these isn't thinning: SEBON's pipeline now holds 98 companies seeking a combined Rs 66.23 billion with two more hydropower issues added just this week and no chair to approve any of it since April 17. The secondary tape says be careful. The primary tape says send more. Given what the listing-day paper did this week, the primary tape is coldly correct.
III. An Entire Float Absorbed Before Lunch
Some of these companies are so small that the price is whatever the last buyer felt like paying. Samaj Laghubitta has 228,500 shares. Not 228,500 in public hands 228,500 in existence, the entire company, against Rs 2.29 crore of paid-up capital. For scale, Nepal Re has 587 times as many shares listed. When a company is that small, "market price" stops being a measurement and becomes an accident of who traded last.
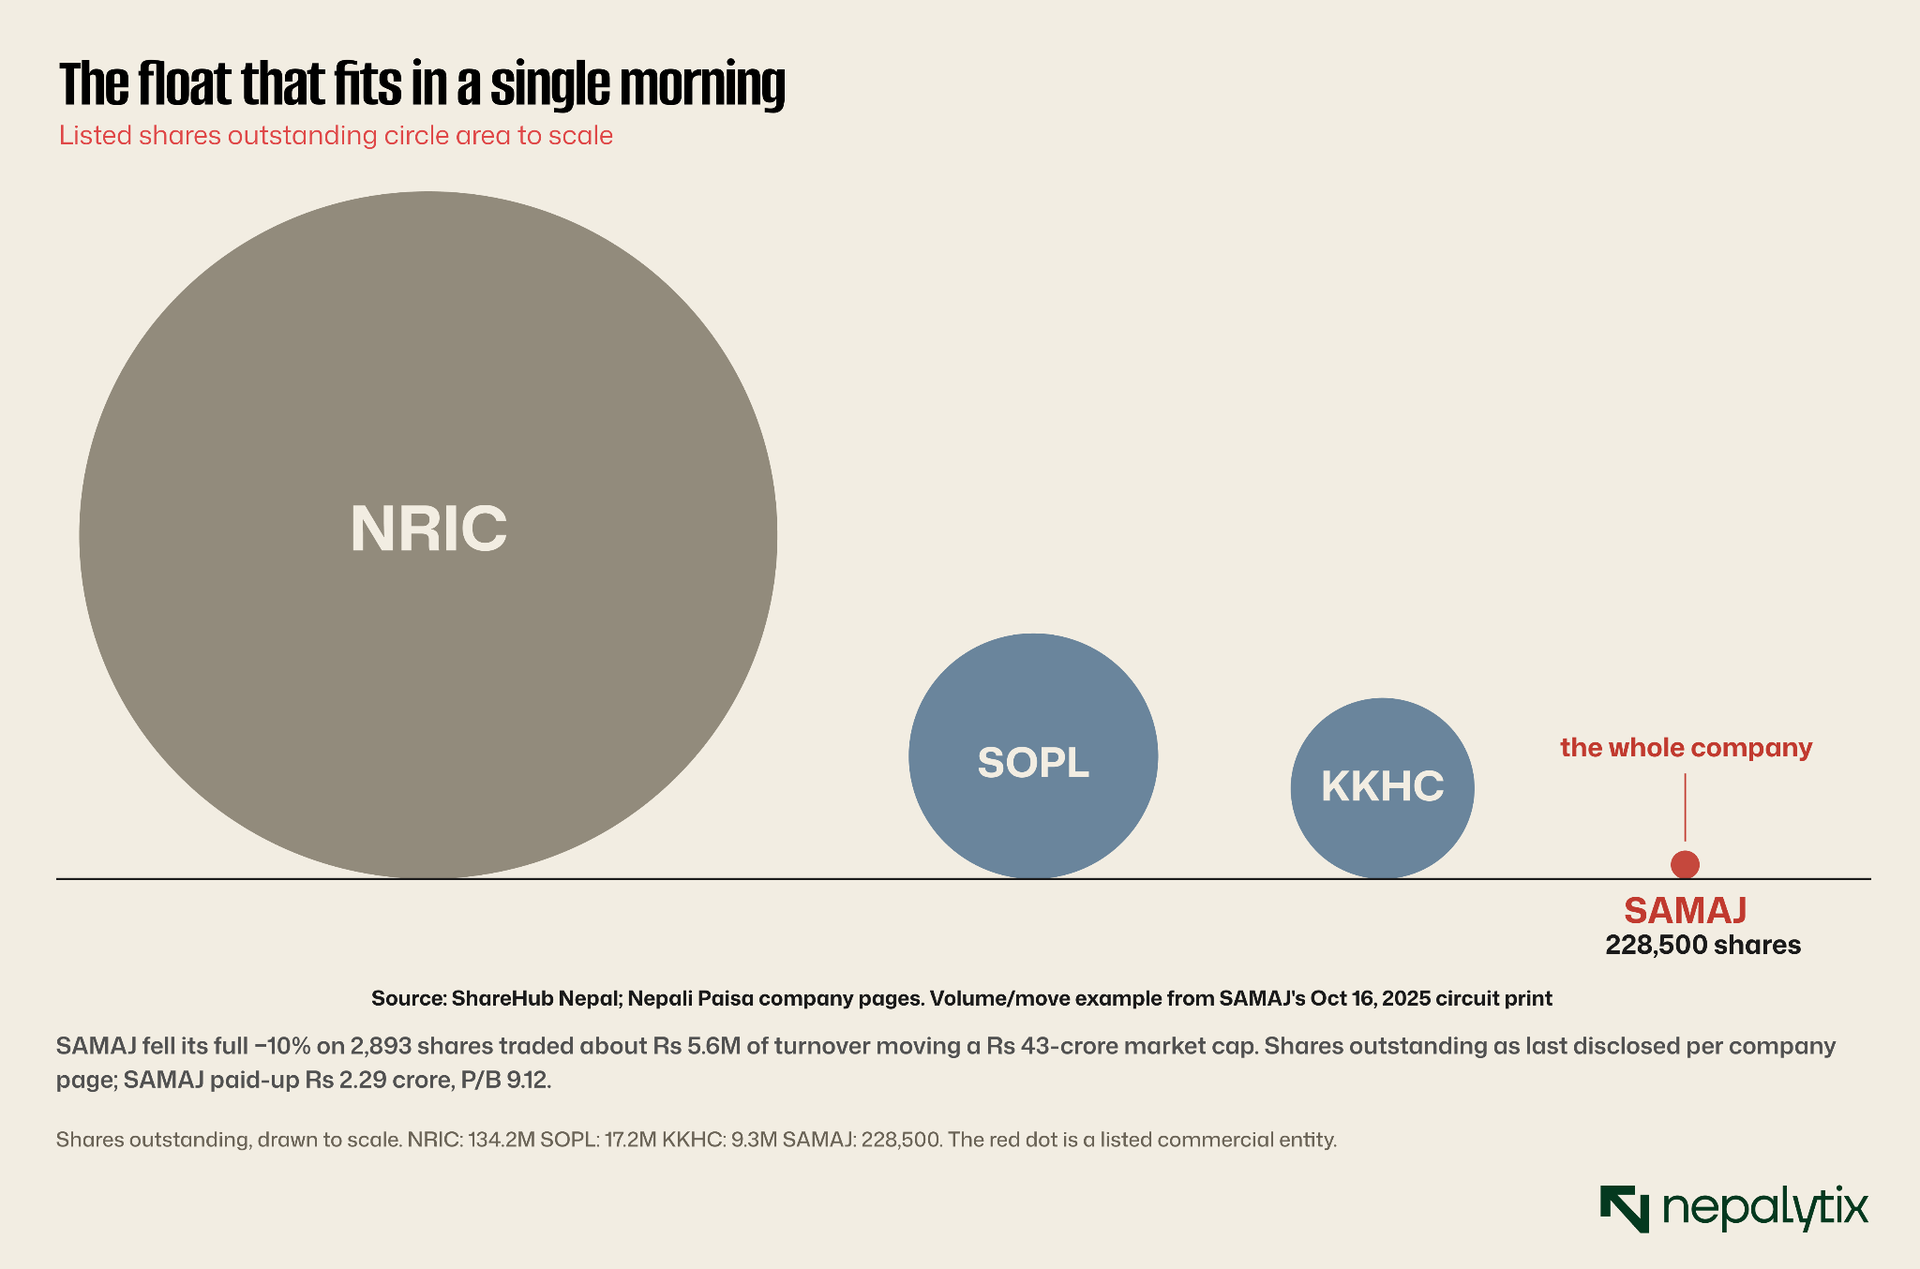
The dot you can barely see is an entire listed financial institution. And the consequences aren't cosmetic: the day SAMAJ printed its 52-week low, the full −10 percent circuit move happened on 2,893 shares. About Rs 5.6 million of trading, the price of a single Kathmandu apartment repriced the whole Rs 43-crore company by a tenth. There is no depth to absorb a seller and none to feed a buyer. The circuit breaker isn't protecting against volatility here; it's the only thing standing between this stock and a vertical line.
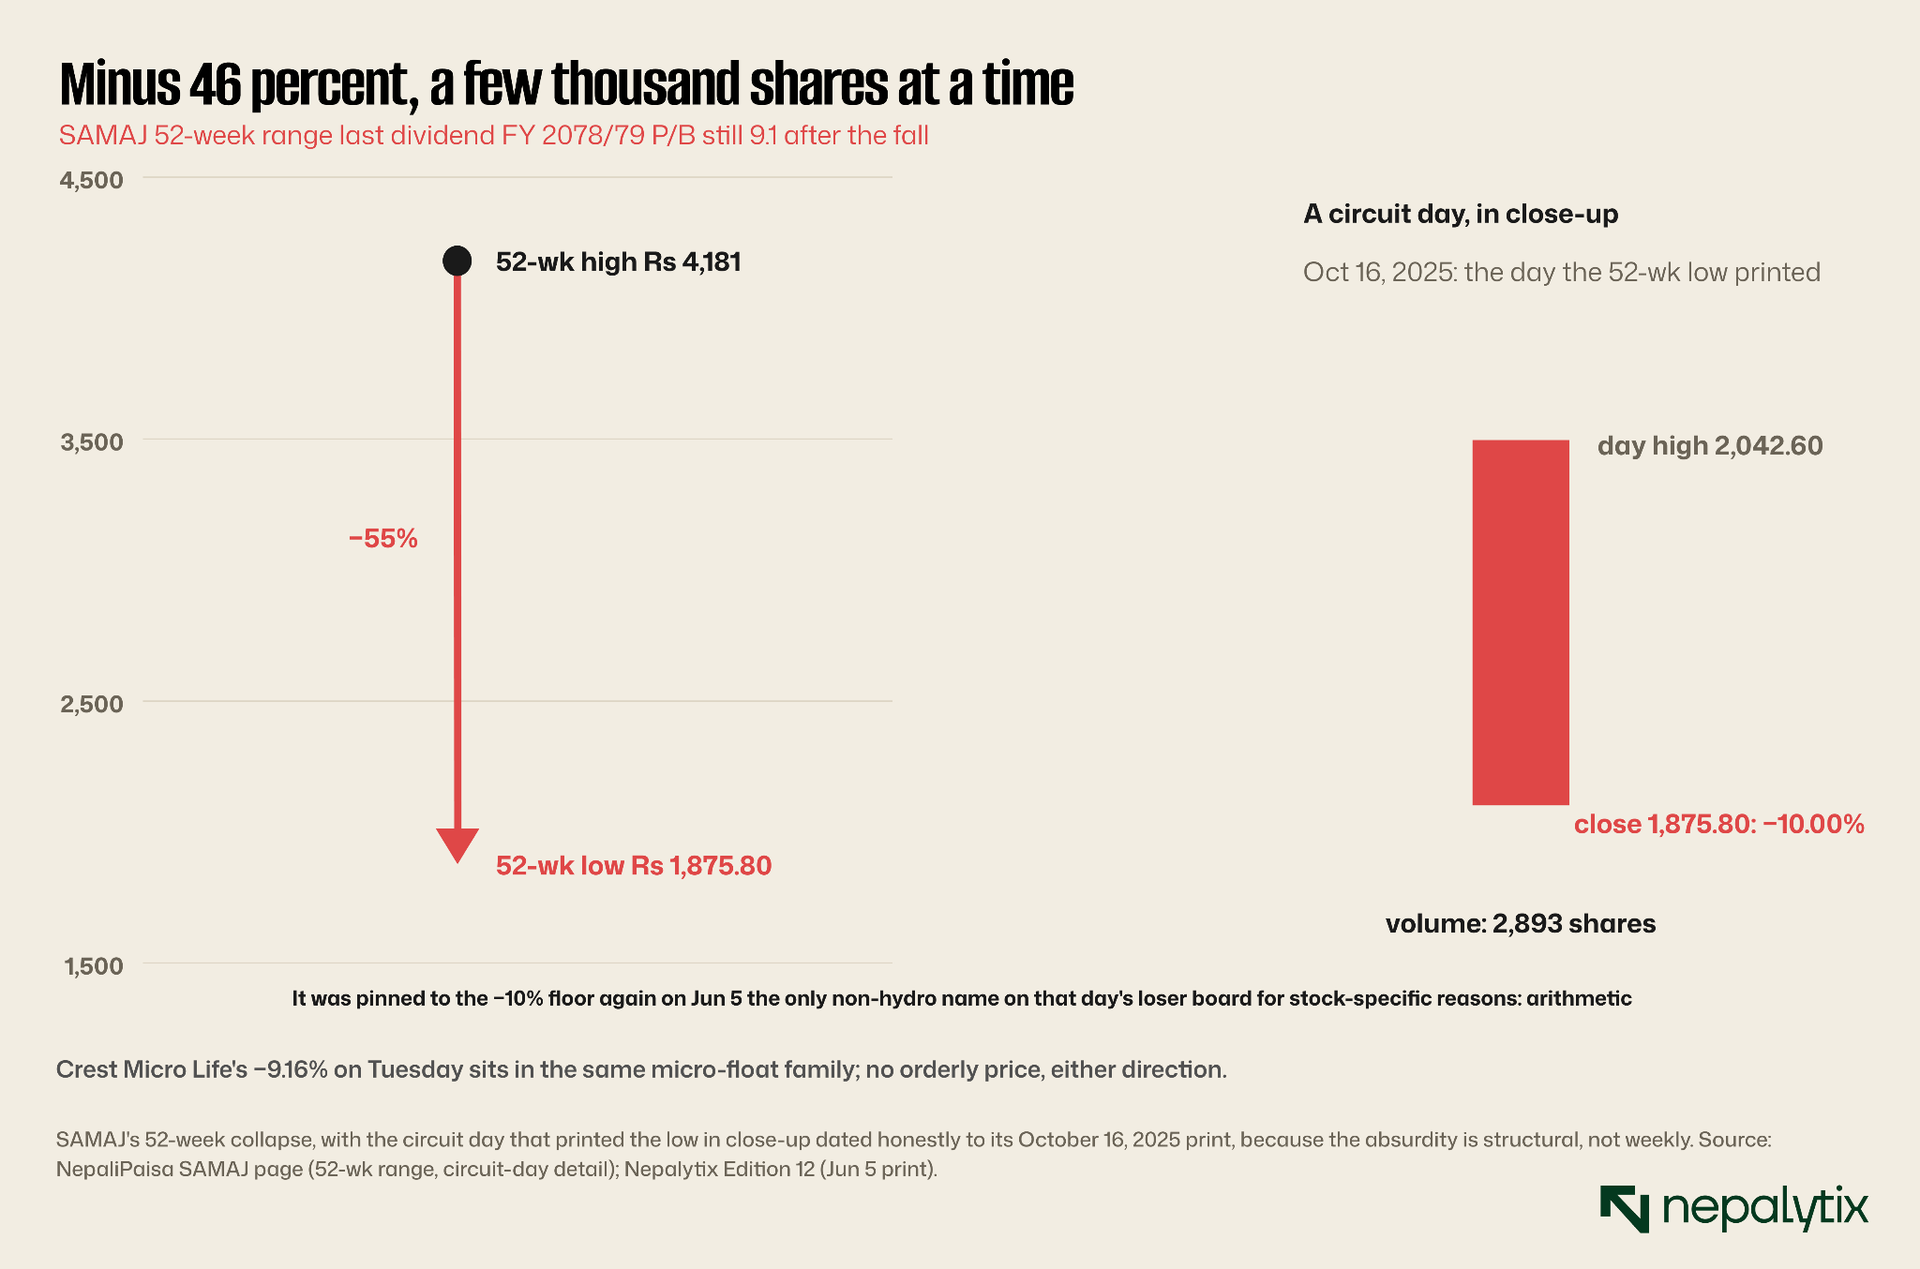
Down 46 percent over the year, SAMAJ still trades at 9.1 times book a multiple that's meaningless when three thousand shares set it, but revealing all the same: even after the collapse, almost nobody is willing to sell at a same price because the float is too thin for anyone to build a position worth selling. It got pinned to its −10 floor again on June 5, the only non-hydro name on that day's loser board. Crest Micro Life did the identical thing on Tuesday. Same family, same mechanics and as the next section shows, increasingly the same reason.
IV. Seven Consecutive Dividend Cuts
The sector retail investors bought for its dividends is, one board meeting at a time, deciding not to pay them. This week brought the seventh zero of the cycle. Aviyan Laghubitta's board met on Friday evening and told shareholders there would be no dividend for FY 2081/82. It joins NMB Laghubitta, FOWAD, Vijaya, NADEP, Swabhimaan and Nerude Mirmire seven Class-D microfinance institutions declaring nothing, and five of those seven landing in the last three weeks alone.
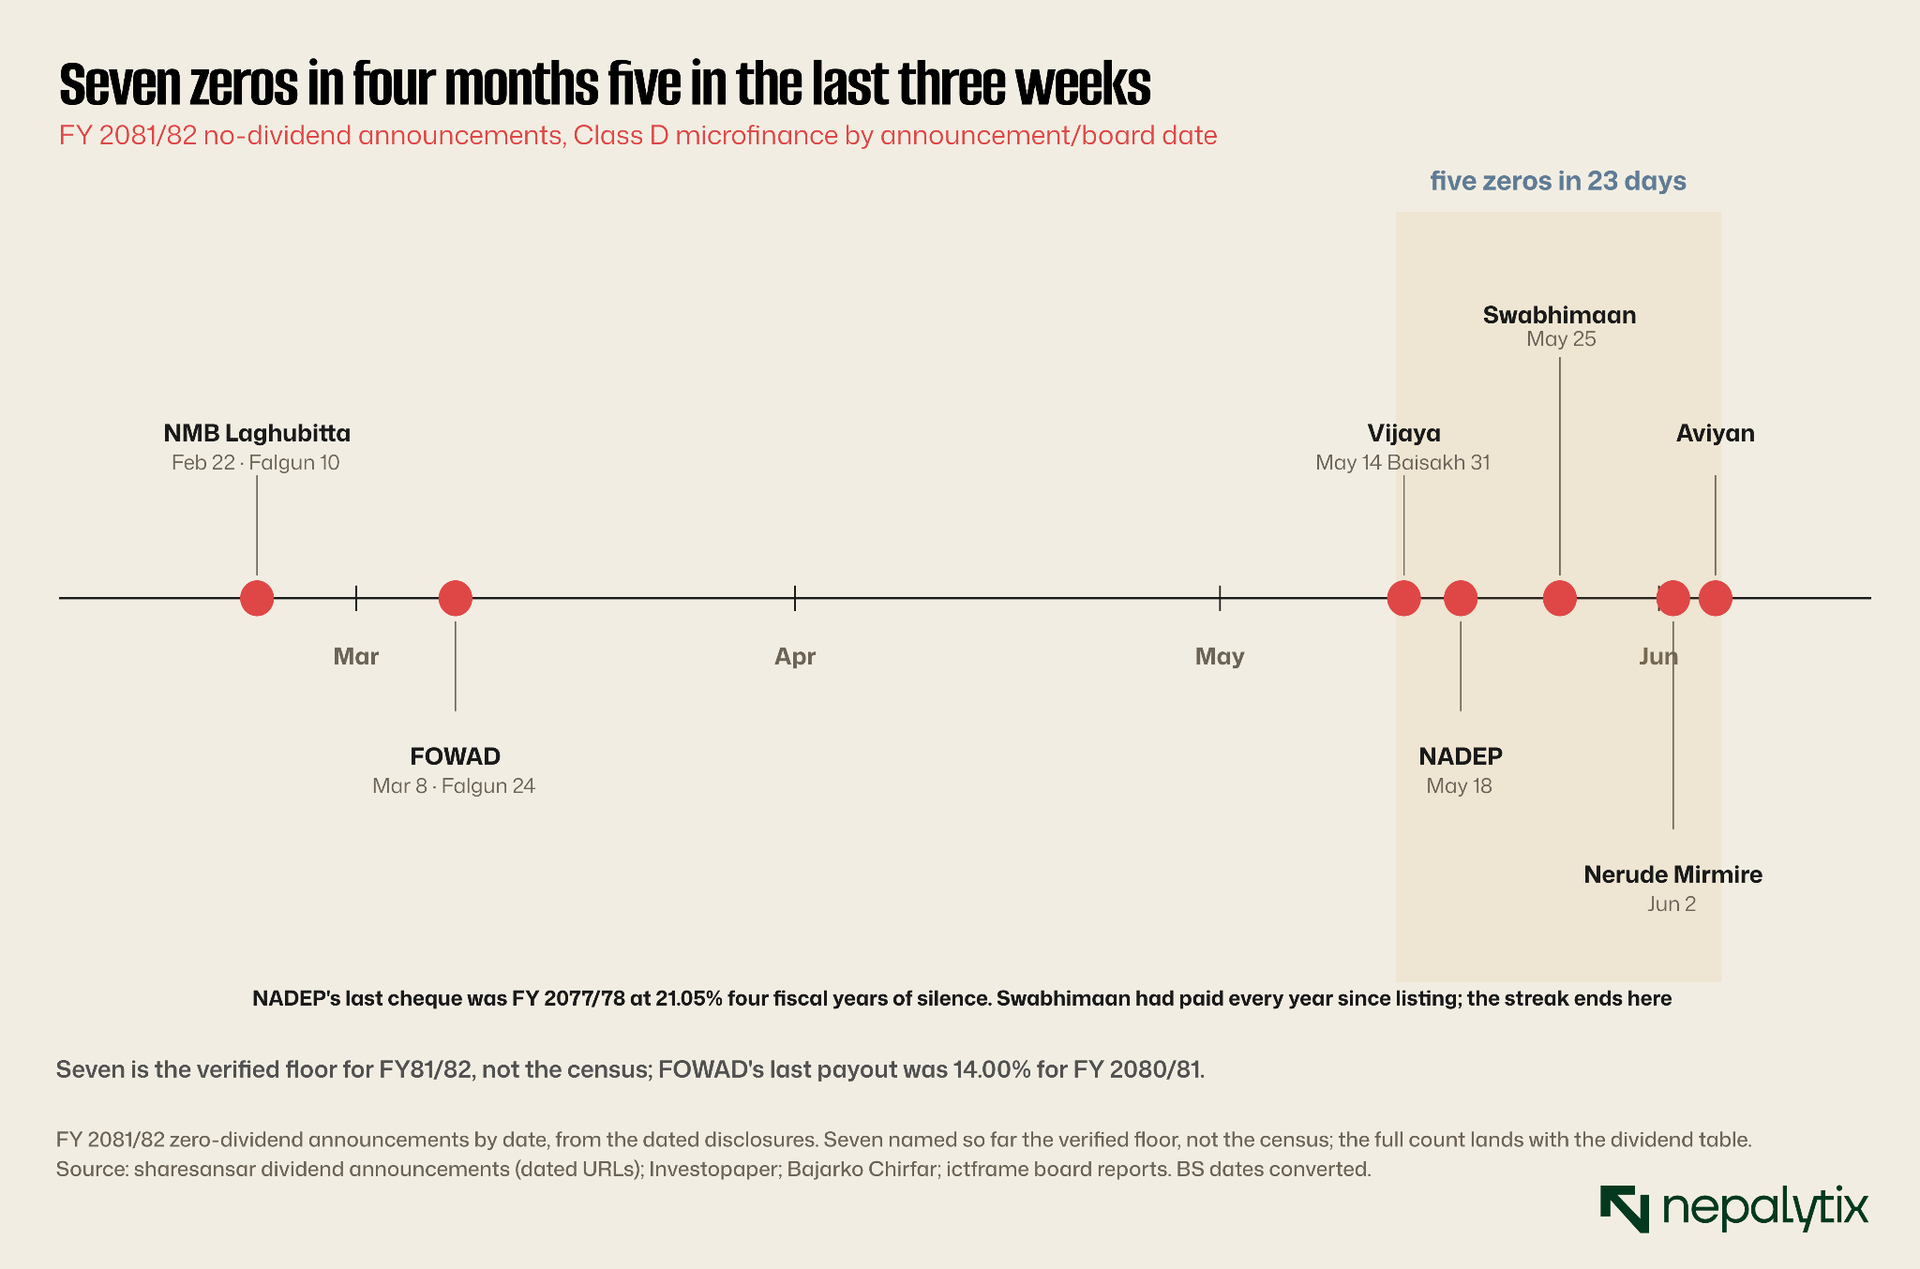
The pattern that matters isn't the total, it's the spacing. February to March produced two zeros across six weeks. Then late May into June produced five in twenty-three days. When the announcements bunch up like that, you're not watching a few weak names report in sequence, you're watching a sector hit the same wall at the same time, as a cohort. That's the difference between idiosyncratic and systemic and the dates say systemic.
The texture underneath is worse than the count. NADEP last paid a dividend in FY 2077/78, at 21.05 percent four full fiscal years of silence since. FOWAD paid 14 percent for FY 2080/81 and then stopped cold. Swabhimaan, a Prime Commercial Bank promoter had paid every single year since it listed; that streak ends here. These aren't chronic non-payers finally admitting it. Several are former reliable players turning the tap off now, together, citing the same pressures, thin margins, rising provisioning, the cost of chasing bad loans. The explanation is sound. The yield is still zero. And Section III already showed you what this sector's equity becomes once the dividends stop and the only investors left are the ones who can't get out: SAMAJ is a microfinance company.
V. What Nepal's Reinsurers Revealed
One reinsurer's results recovered and deteriorated at the same time. The other one's problem is its share register. Himalayan Re reported nine-month numbers that cut cleanly both ways. A year ago the company was Rs 326.67 million in the red. This year it's Rs 235.65 million in the black a Rs 562 million swing across the line. Taken alone, that's a clean recovery story. But the third quarter on its own lost Rs 44.35 million.
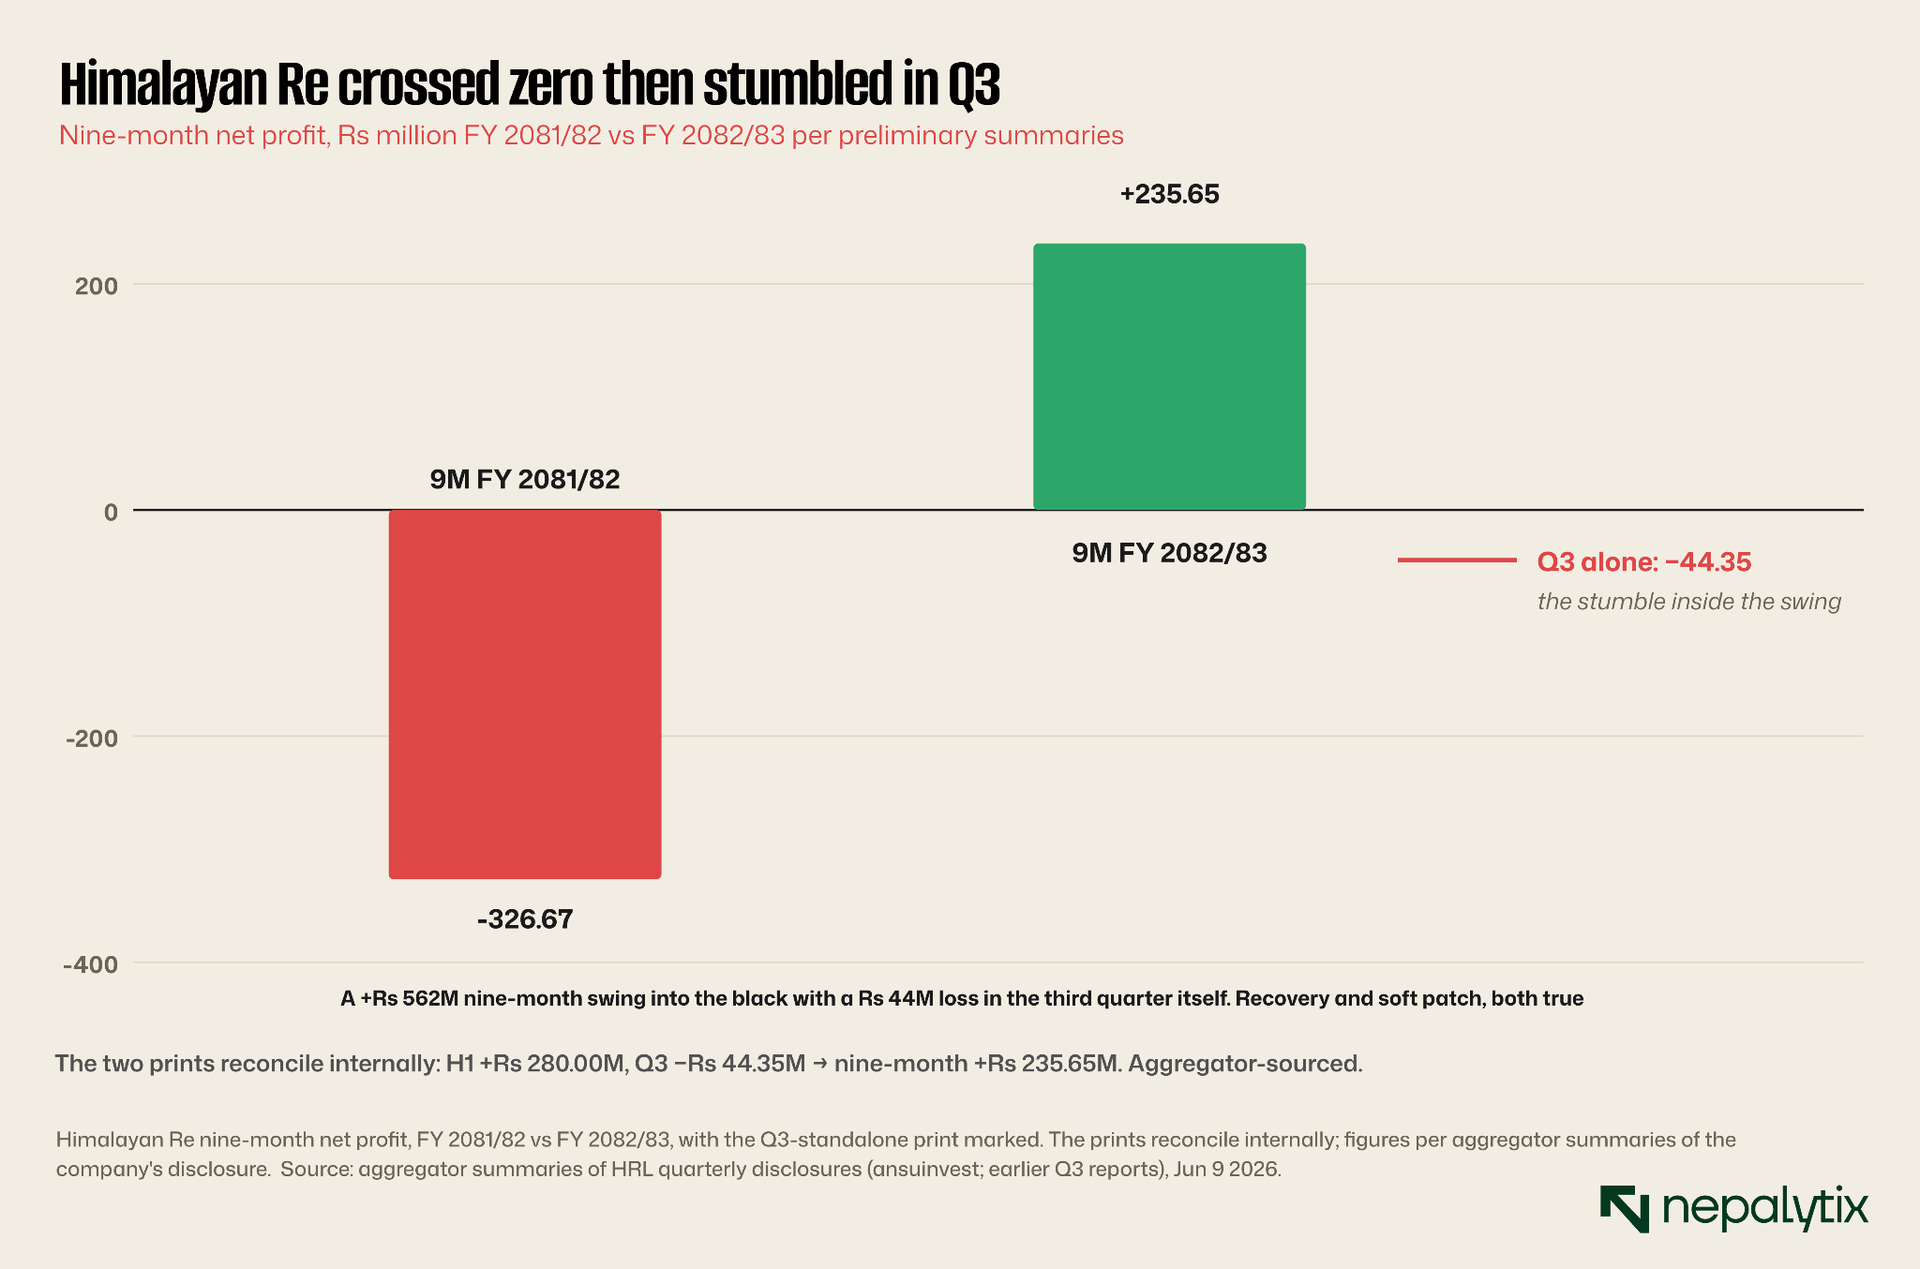
Both readings are true simultaneously, and the arithmetic forces you to hold them together: the first half earned roughly Rs 280 million, the third quarter gave Rs 44 million of it back. So the headline swing into profit is real, and the trajectory inside it a quarter that turned down is also real. A single number can be a recovery and a warning in the same filing, and this is one. It matters more than usual right now, because the budget just handed primary insurers legislated demand, and everything they underwrite eventually needs reinsuring.
The listed name to actually watch though is Nepal Re and its story isn't on the income statement. It's in who owns the shares.
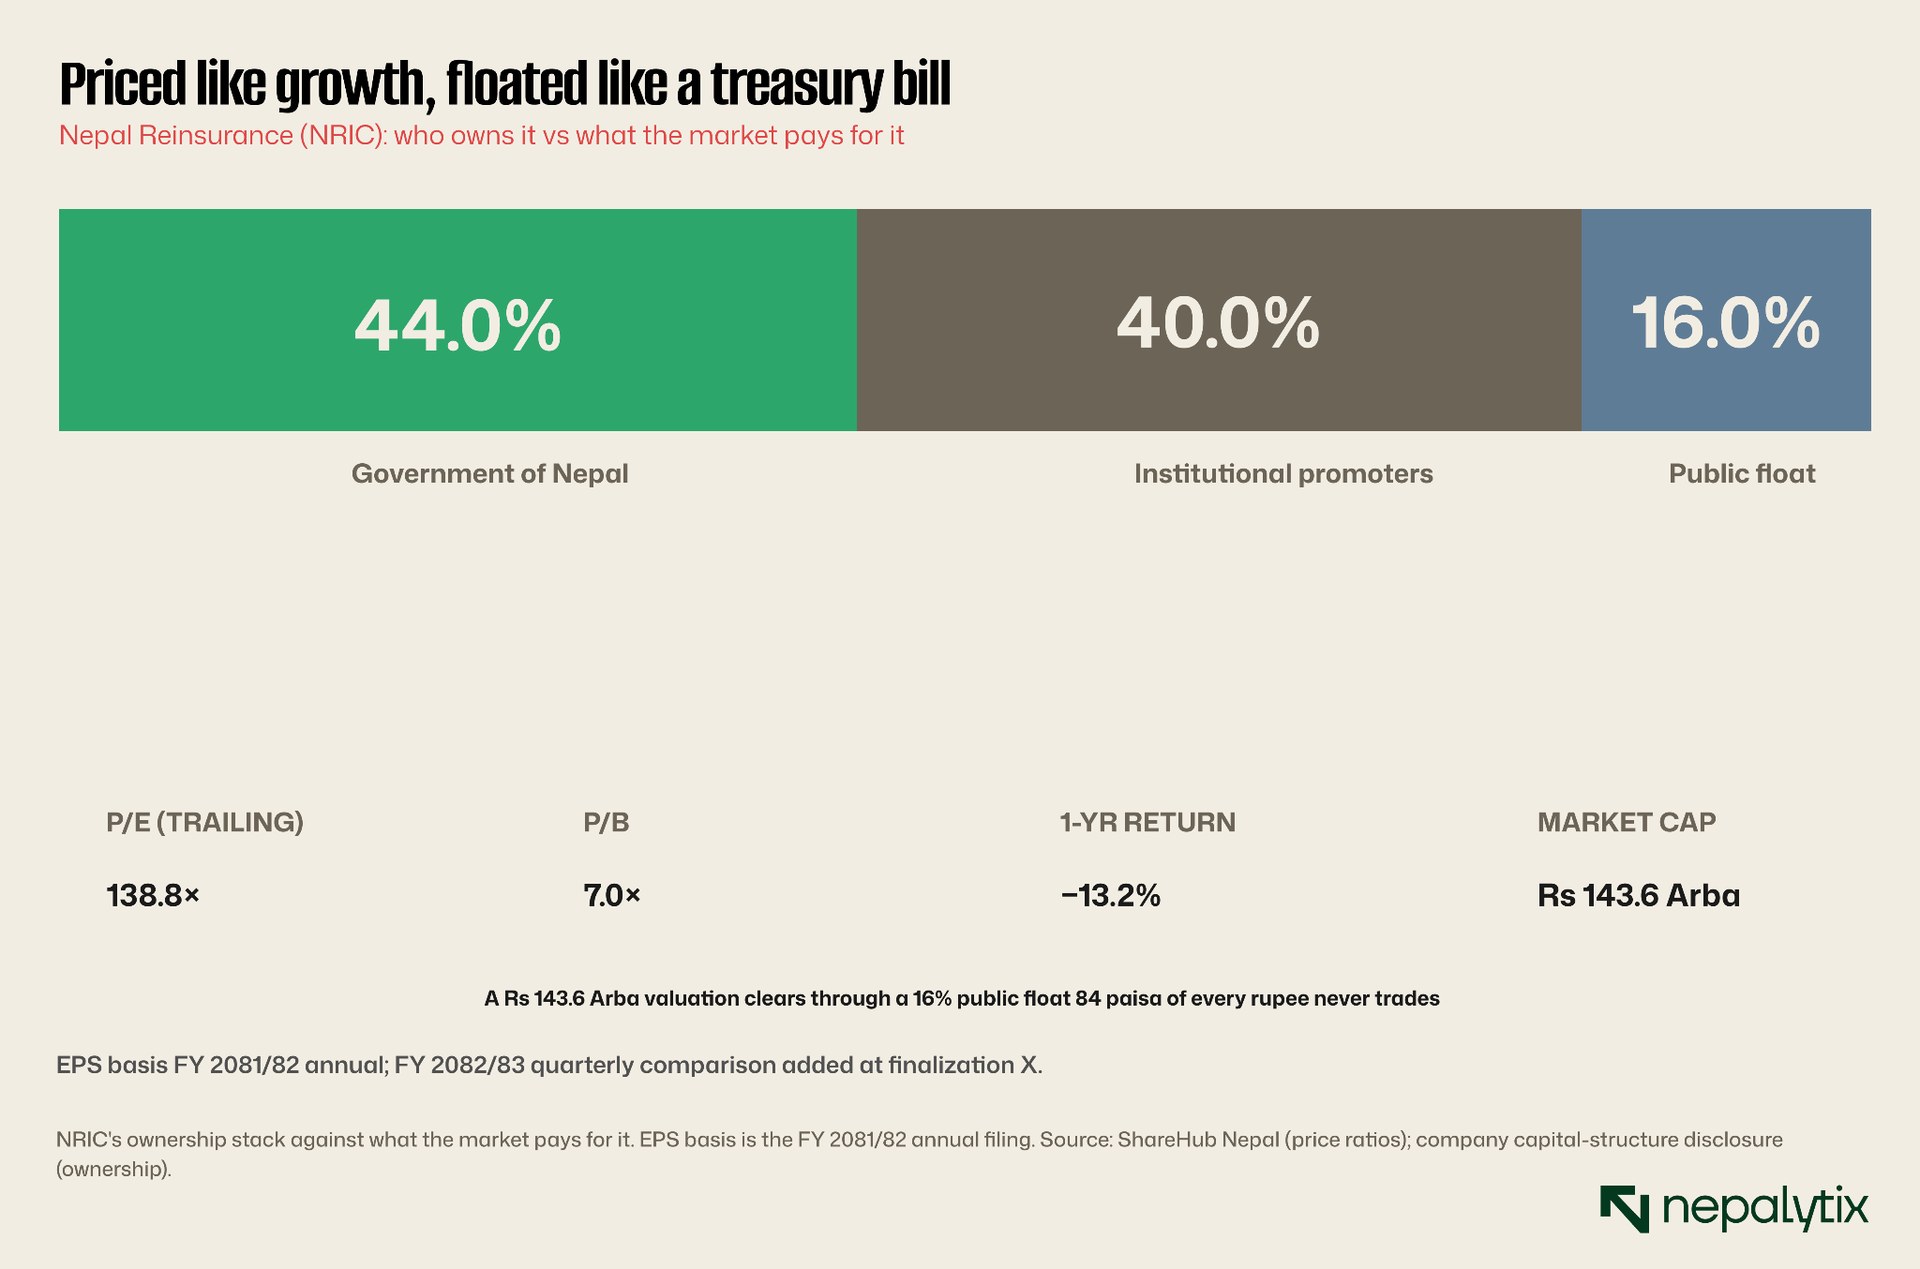
The government holds 44 percent of Nepal Re. Institutional promoters hold another 40. That leaves about 16 percent of the public float to do all the trading. On that thin sliver, the market clears a Rs 143.6 arba valuation at 138.8 times trailing earnings, for a stock that lost 13 percent over the past year. Eighty-four paisa of every rupee of this company never trades, so the price is set by the frantic sixteen that do. It's the exact mechanism from Section III a price discovered by too few shares wearing a Rs 143 arba market cap instead of a Rs 43 crore one. Thin floats distort small companies into lottery tickets and large ones into expensive mirages. Nepal Re is the second kind.
VI. What to Watch
The plumbing kept moving while the tape drifted
NRB's ten-month data landed this week and it reframes the July policy. Inflation is running at 5.04 percent fractionally through the 5 percent ceiling the policy is anchored to. Remittances are up 41.2 percent. Reserves cover 19.2 months of imports. The external account is, by any historical standard, drowning in money.
And yet the same week, NRB widened the SME digital-lending cap to Rs 1 million and the NRB Amendment Bill reached the floor of the House both pointed at getting credit moving, not at cooling prices. The contradiction is the story: the money is already here, the prices have already crossed the line and the central bank's instinct is still to open the pipes wider. Five weeks to policy.
The shelf. The index closed sitting on 2,702–2,726 after probing it four straight days. Monday opens with a fifth defense, or with the first break.
Sunday weekly. Fills the two gaps this edition flagged: Friday's turnover and full-week breadth.
July 16. The 10%/7.5% capital-gains rates switch on. The high-churn trade which is to say, every name in Section II finally gets a tax cost.
June 16–17. The Fed meets. Not Nepal's rate but the dollar leg of every remittance dollar in those reserves.
Everest Colour's allotment. Whether forty-times demand survives contact with a falling tape and where Sopan is trading by the time it does.
SEBON's chair. 98 companies, Rs 66.23 billion, eight weeks and counting with no one empowered to sign.
Makalu Wine. A winery appointed an issue manager this week. It is coming to NEPSE. The queue contains multitudes.
Disclaimer
This report has been prepared by Nepalytix for informational and educational purposes only and does not constitute investment advice, an offer, or a solicitation to buy or sell any securities.
The information contained in this report is based on sources believed to be reliable; however, Nepalytix does not guarantee its accuracy, completeness, or timeliness. Opinions, estimates, and projections expressed herein are those of the authors as of the date of publication and are subject to change without notice.
Investing in securities involves risks, including the possible loss of principal. Past performance is not indicative of future results. Readers are advised to conduct their own independent research and consult with a qualified financial advisor before making any investment decisions.
Nepalytix and its contributors may hold positions in the securities discussed in this report at the time of publication or thereafter.
Neither Nepalytix nor any of its affiliates accept any liability for any loss arising from the use of this report or its contents.