Nepal’s Bank Mergers: Bigger Banks But Better Banks?
Nepal has reduced its licensed banks and financial institutions from 220 in 2012 to 105 in 2026 through years of central-bank-driven consolidation. But an analysis of 152 completed mergers and five years of financial results raises a difficult question: have bigger banks actually delivered better results for shareholders?
Nepal had 220 licensed banks and financial institutions in 2012. It has 105 now. Most of the difference was made in boardrooms, under pressure from the central bank through 152 completed mergers and acquisitions. We went through every one of them, the share swaps that priced them, the market’s reaction when they were announced and five years of results for the 19 listed commercial banks. The banks that merged with each other in 2022 and 2023 have so far less to show for it than the banks that did not.
1. Too many licences
In the middle of 2012 Nepal Rastra Bank supervised 220 banks and financial institutions. There were 32 commercial banks, 88 development banks, 77 finance companies and 23 microfinance lenders for a country of fewer than 30 million people and an economy smaller than that of many single Indian states. By mid-March 2022 the count had fallen to 128. By mid-July 2026, it was 105: 20 commercial banks, 17 development banks, 16 finance companies, 51 microfinance institutions and one infrastructure bank.
Some of that decline came from licences that were revoked or surrendered and a few institutions were reclassified. But most of it came from mergers. The ShareSansar register of completed mergers and acquisitions which goes back to 2004 records 152 completed deals in which the surviving institution was a commercial bank, development bank, finance company or microfinance lender. Between them those deals folded 182 institutions into others. That is the merger decade and it is the largest change in the structure of Nepali finance since the licensing boom of the 2000s that created the crowd in the first place.
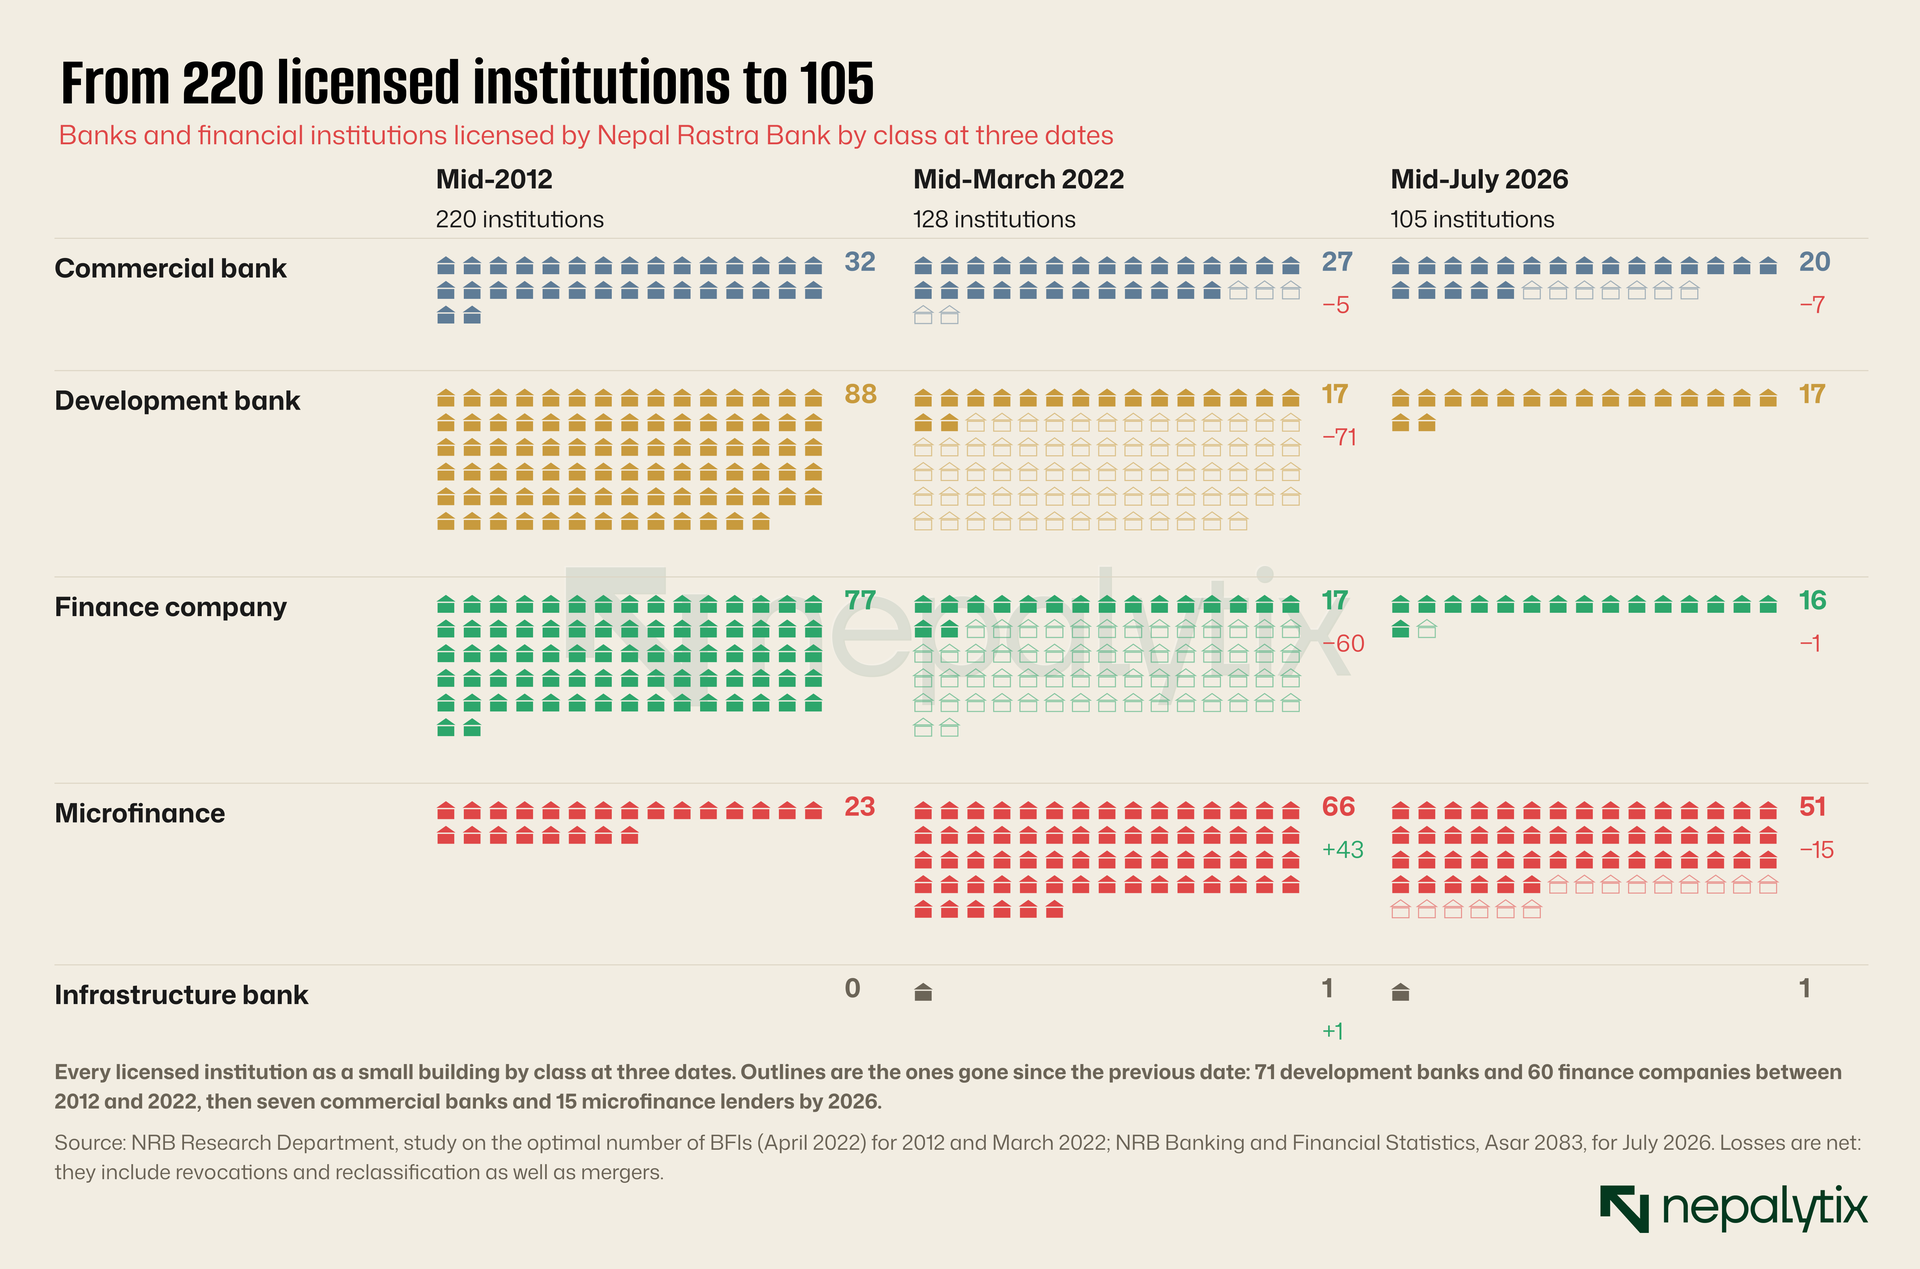
The exhibit shows three different stories inside one total. Development banks and finance companies collapsed in number between 2012 and 2022 from 165 between them to 34. They were the main targets of the first wave mostly bought by commercial banks. Commercial banks shrank more slowly from 32 to 27 by 2022 and then to 20 in a single year of bank-with-bank deals in 2022 and 2023. Microfinance moved the other way for most of the decade. The number of licensed microfinance lenders nearly tripled between 2012 and 2022 before a merger wave of their own cut it from 66 to 51.
The question this piece asks is a simple one. Was it worth it? Consolidation was sold by the central bank and by the banks themselves as a way to build bigger, safer, cheaper institutions. Bigger banks would be able to finance large projects. They would spread fixed costs over more customers. They would absorb shocks that would sink a small lender. A decade on, there is enough data to check at least some of that against what actually happened: in the prices at which the deals were done, in what the stock market thought of them and in the results of the banks that merged, compared with the banks that did not.
The data come from four places. The merger and acquisition register which gives the institutions involved, the swap ratio and the dates of the memorandum of understanding, the final approval and the share swap. Bank results are the fourth-quarter reports of the 19 listed commercial banks for each of the five fiscal years from FY2078/79 to FY2082/83 as compiled by nepsetrading. Share prices and the banking sub-index are daily closes from merolagani adjusted for bonus and rights issues. Institution counts come from Nepal Rastra Bank.The register has gaps and a few obvious errors which we note where they matter and the methods section at the end sets out exactly what we did.
2. Why the deals happened
Mergers in Nepal did not arrive because bankers suddenly discovered the economics of scale. They were pushed. The central bank issued its first merger bylaws in 2011 and rewrote them in 2016 to cover acquisitions as well. Neither set of rules did much on its own. What did was capital.
In the monetary policy of July 2015, Nepal Rastra Bank raised the minimum paid-up capital for a commercial bank from Rs 2 billion to Rs 8 billion, with higher floors for development banks and finance companies too and gave institutions until the end of FY2073/74, mid-July 2017 to comply. A bank could get there in three ways. It could issue rights shares to its existing shareholders, it could issue bonus shares out of retained earnings or it could merge and add another institution’s capital to its own. Most banks did some of all three. For the smaller institutions which had no hope of reaching the new floor on their own, merging was the only real option.
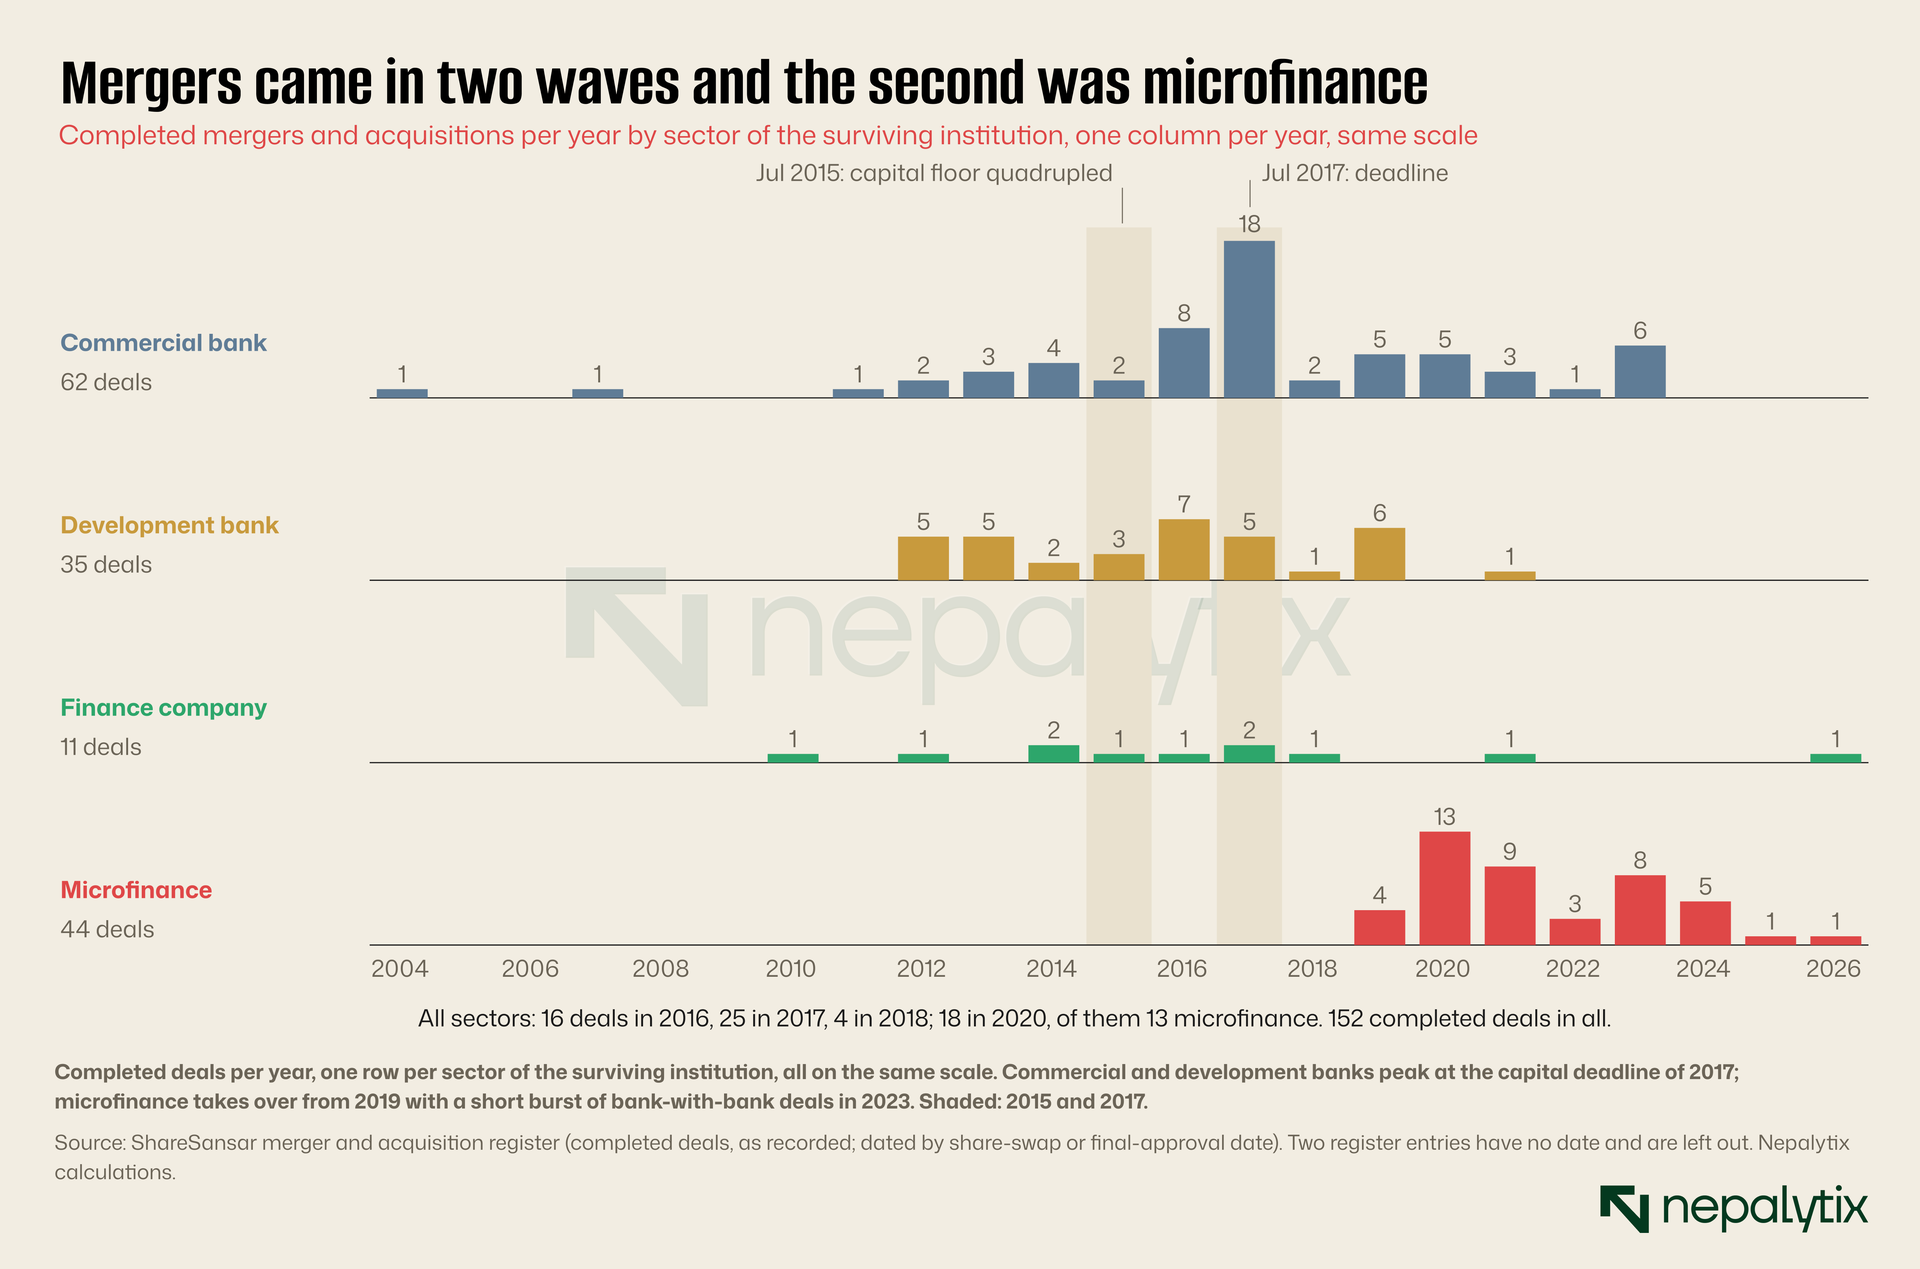
The timing is visible in the register. Before 2012 there was barely one deal a year. From 2012 to 2015 there were between six and eight. Then came the deadline. The register records 16 completed deals in 2016 and 25 in 2017, 18 of them by commercial banks. In 2018, with the deadline past, the count fell back to four.
The second wave was different in kind. From 2019 onwards most deals were among microfinance lenders. That followed a separate push from the central bank which had licensed microfinance institutions generously in the years after 2012 then found itself supervising dozens of small lenders competing for the same rural borrowers and began to encourage them to combine. The register records 13 microfinance deals in 2020 alone, out of 18 in total and 44 completed microfinance deals over the period. Of the four deals listed as still in progress in October 2026, three are between microfinance lenders. The fourth would combine Muktinath Bikas Bank with Janaki Finance and Sindhu Bikas Bank.
The third episode was short and for the stock market, the most important. Between July 2022 and July 2023 seven commercial banks absorbed another commercial bank. Nabil Bank acquired Nepal Bangladesh Bank. Nepal Investment Bank merged with Mega Bank to form Nepal Investment Mega Bank. Global IME acquired Bank of Kathmandu. Kumari Bank merged with Nepal Credit and Commerce Bank. Prabhu Bank acquired Century Commercial Bank. Himalayan Bank took in Civil Bank. Laxmi Bank merged with Sunrise Bank to form Laxmi Sunrise Bank. Seven deals took the number of commercial banks from 27 to 20 in about a year. There has not been another completed bank-with-bank deal since.
This was not driven by a new capital deadline. It came in a period when the central bank was openly saying it wanted fewer, larger banks when liquidity was tight and lending rates high, and when several of the absorbed banks had become weaker than their partners. A study by Nepal Rastra Bank’s research department published in April 2022, surveyed bankers and others on what the right number of institutions would be. Most respondents put the optimal number of commercial banks at between 11 and 15. Twenty is still well above that range which is one reason the question of further mergers has not gone away.
3. Who absorbed whom
The headline count of 152 deals hides a clear hierarchy. Commercial banks were the main buyers. Development banks and finance companies were the main targets. Microfinance lenders merged almost entirely among themselves.
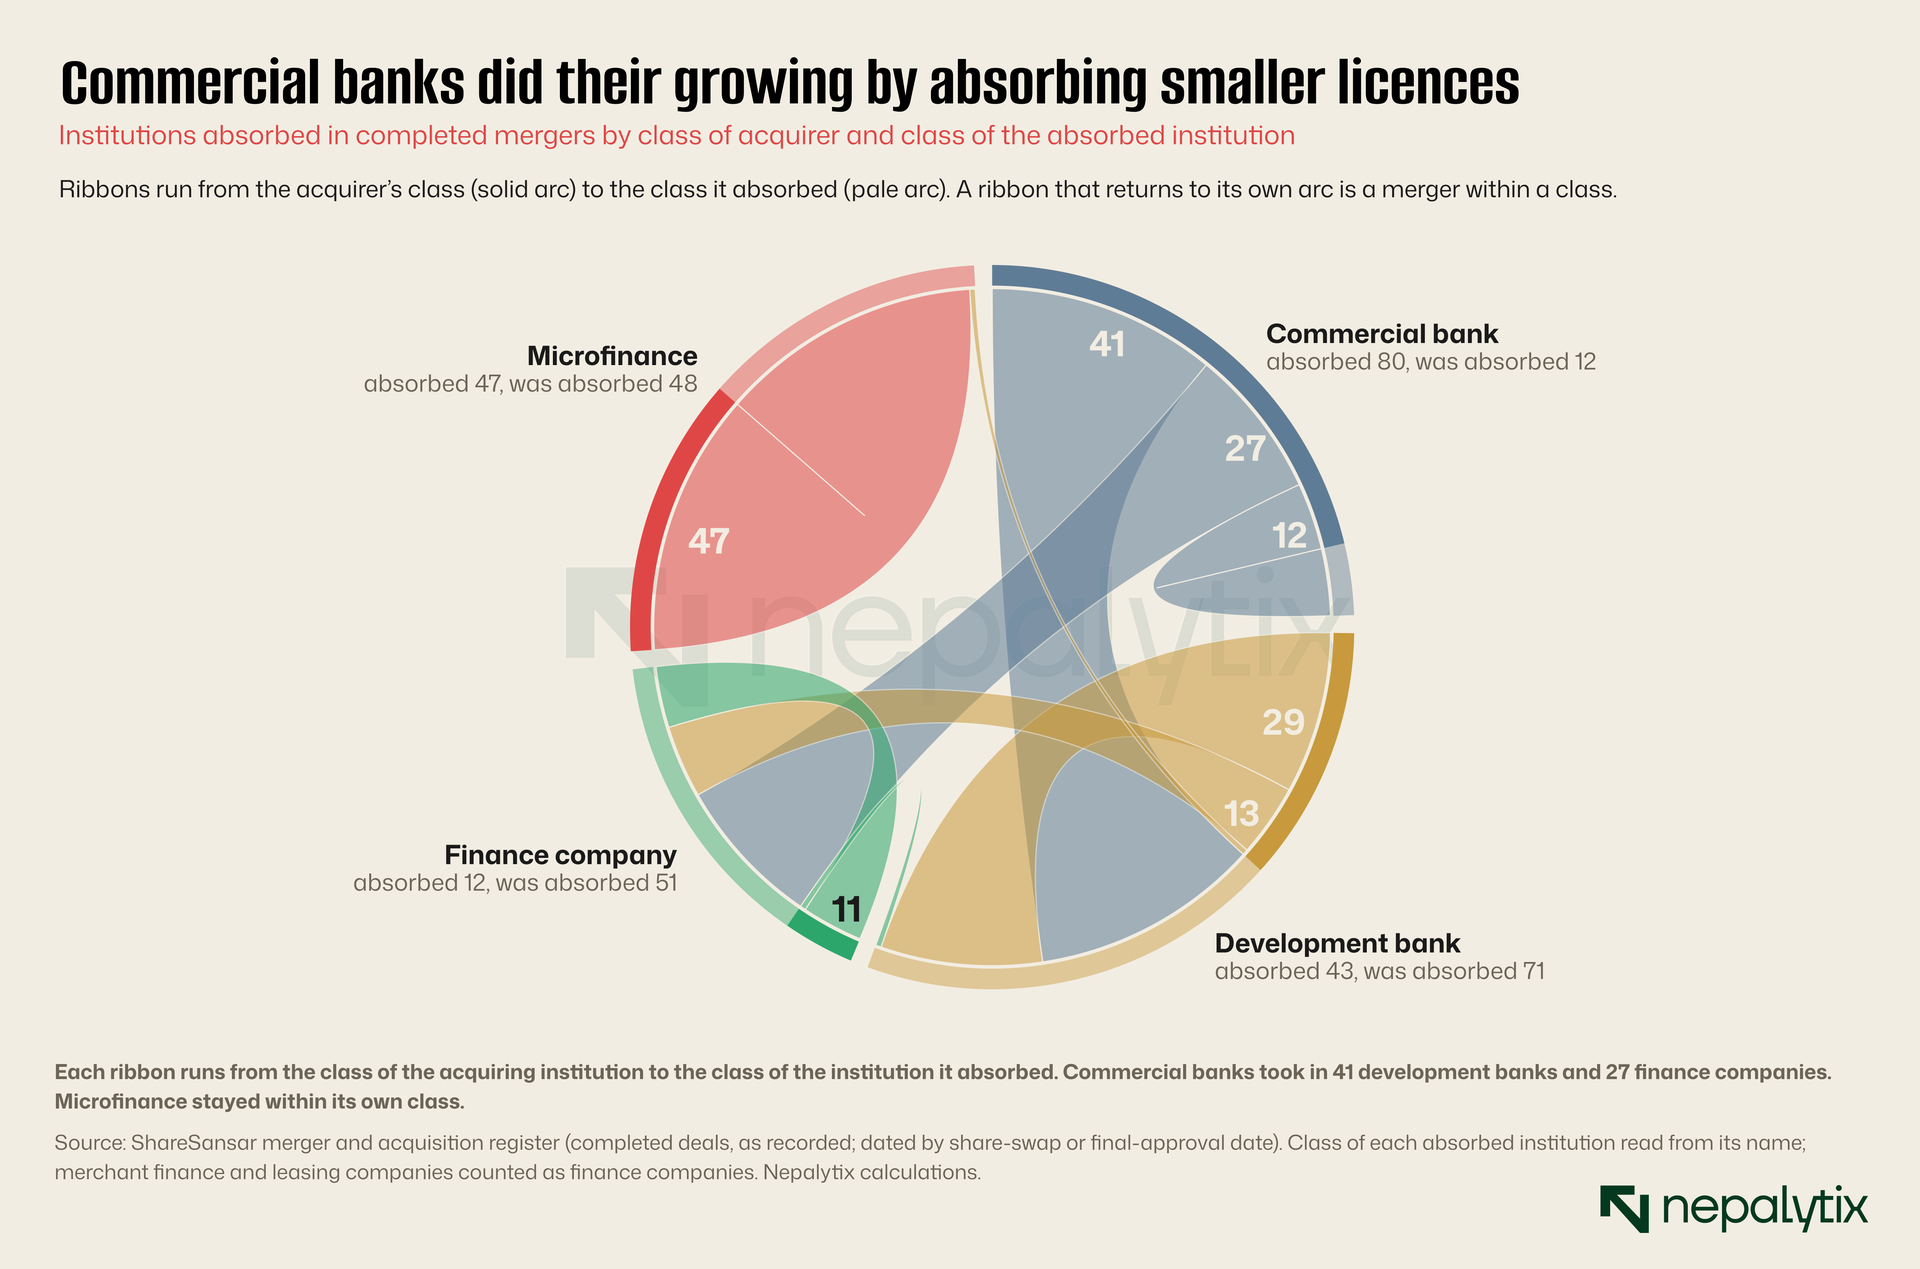
Of the 182 institutions absorbed in the period, commercial banks absorbed 80. The biggest single flow was from development banks into commercial banks: 41 development banks disappeared into commercial banks over the decade. Another 27 finance companies did the same. Only 12 of the institutions absorbed by commercial banks were themselves commercial banks, and seven of those came in the single wave of 2022 and 2023.
Development banks were both buyers and targets. They absorbed 43 institutions, mostly other development banks and finance companies, and were themselves absorbed 71 times. Finance companies were overwhelmingly targets. They were absorbed 51 times and did the absorbing only 12 times. Microfinance lenders absorbed 47 other microfinance lenders and, in the register, only one development bank ever merged into a microfinance institution.
The pattern makes sense given what drove it. A commercial bank short of the Rs 8 billion floor in 2016 could buy a development bank with Rs 1 billion or Rs 2 billion of paid-up capital and close part of the gap in one transaction. It also got a branch network, often outside the Kathmandu Valley, and a deposit base. A development bank or finance company with no realistic route to its own new capital floor got a buyer and its shareholders got shares in a bigger, more liquid institution. Whether either side got a good price is the next question.
4. The price of a licence
Every merger in Nepal is a share swap. No cash changes hands. The shareholders of the absorbed institution receive shares in the surviving institution at an agreed ratio and the ratio is the price. A swap ratio of 100:85 for example means that 100 shares of the absorbed institution are exchanged for 85 shares of the acquirer. Because all bank shares carry the same Rs 100 par value, the ratio is roughly a statement about relative net worth per share as set by valuers appointed by the two sides and approved by the central bank.
The register gives a usable swap ratio for 71 institutions absorbed by commercial banks. We count a ratio as usable when it is stated against 1, 2 or 100 shares of the acquirer and gives a value between zero and 1.2 shares per absorbed share; a handful of entries in other formats which we could not interpret with confidence are left out.
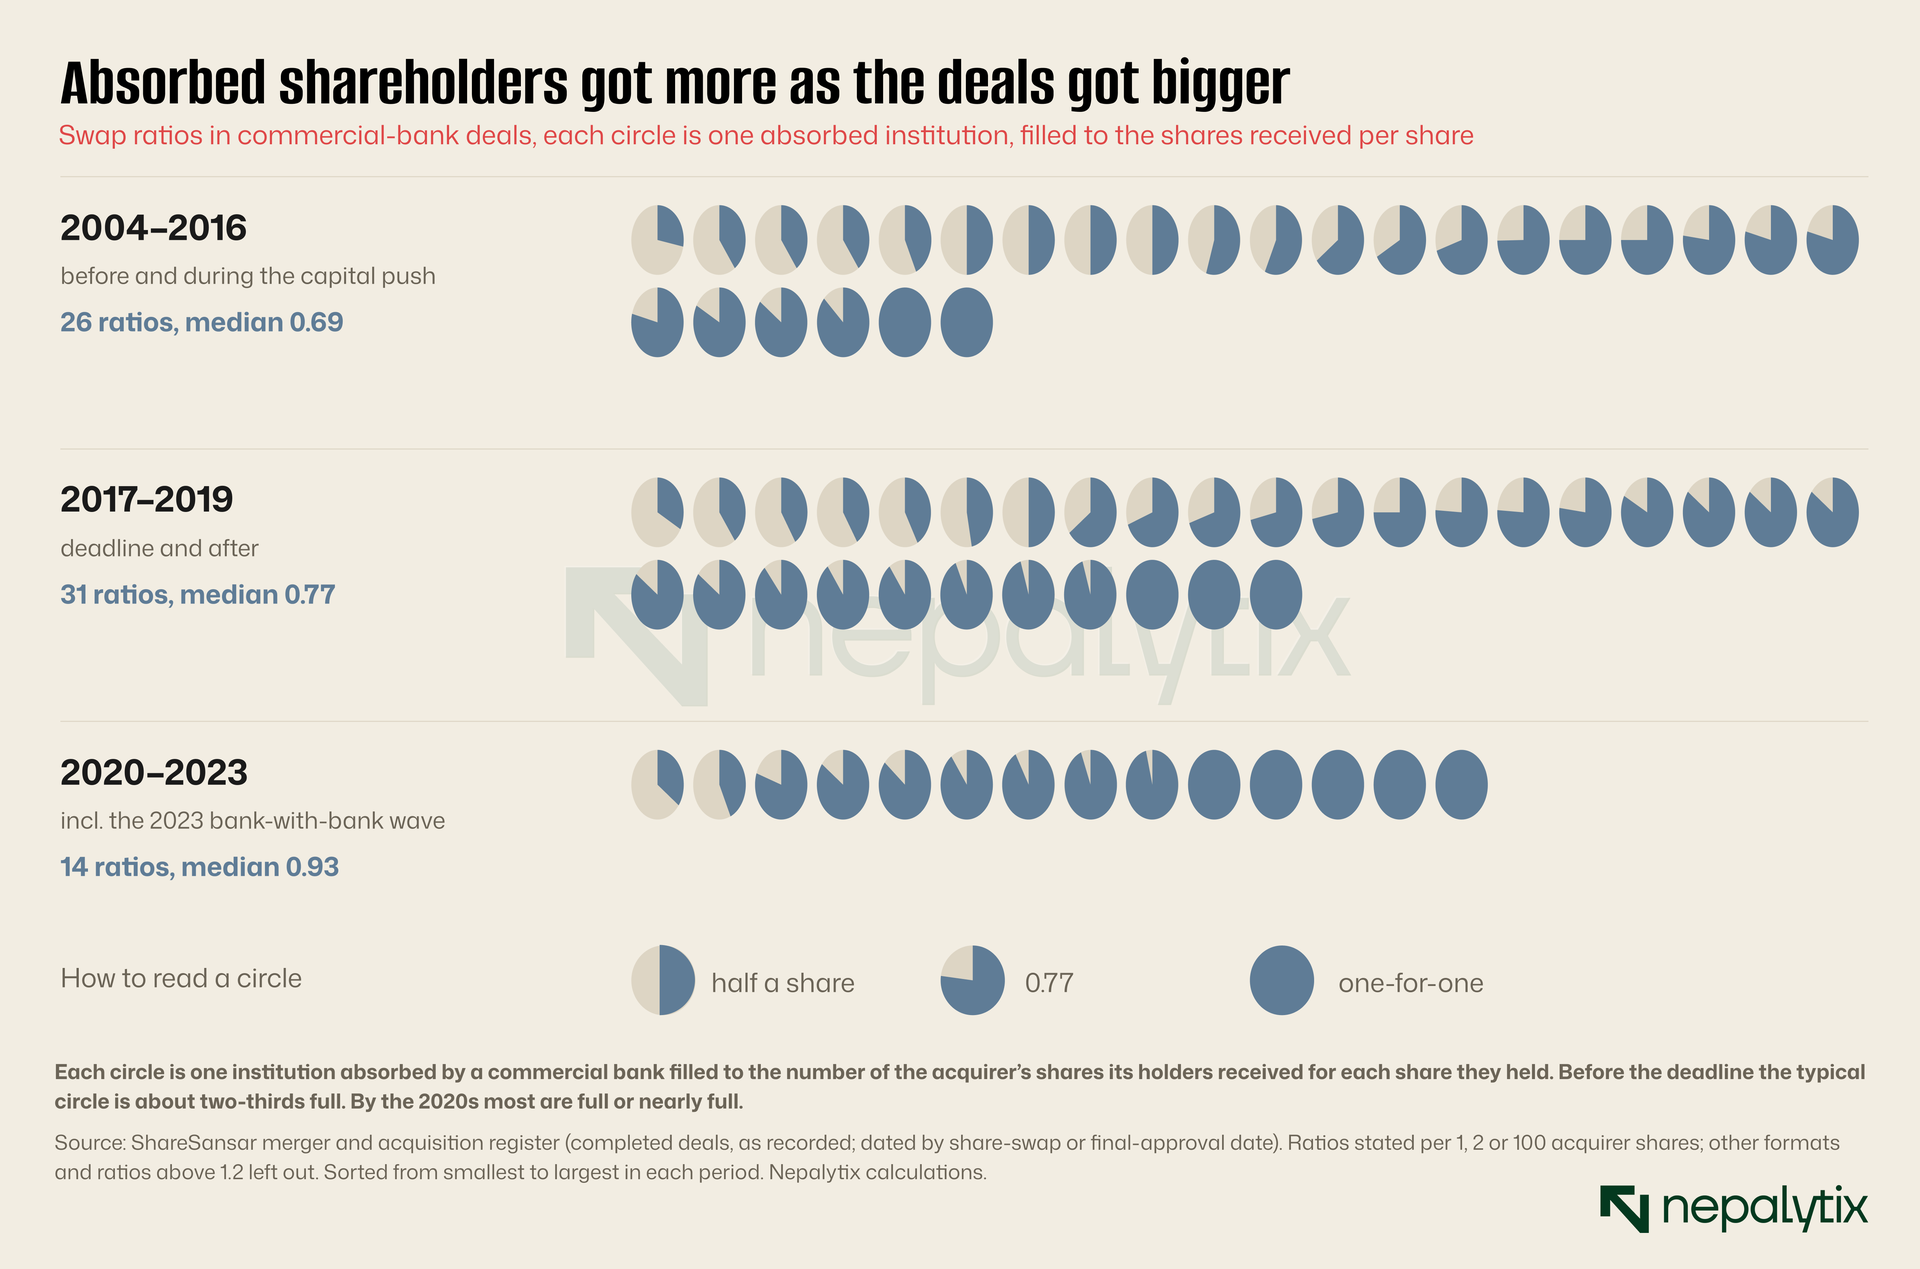
Two things stand out. The first is that the absorbed shareholders usually took a cut. Of the 71 ratios, 61 are below one-for-one. The median across all of them is 0.77: a holder of 100 shares in the absorbed institution typically came out with 77 shares of the bigger bank. That is what one would expect when most targets were development banks and finance companies whose book value per share was below that of the commercial banks buying them. The swap ratio did not mean their shareholders lost money; a share in a commercial bank traded at a higher price than a share in a small development bank. It did mean that the deal was priced as a takeover of a weaker institution by a stronger one.
The second is that the ratio drifted upward over time. Before and during the capital push, from 2004 to 2016, the median was 0.69. Through the deadline and its aftermath, from 2017 to 2019, it was 0.77. From 2020 onwards it was 0.93 and in the wave of 2022 and 2023 four of the seven deals were struck at exactly one-for-one. Nabil’s acquisition of Nepal Bangladesh Bank at 100:43 was the exception. Nepal Investment Bank and Mega Bank swapped at 100:90, and Himalayan and Civil at 100:80.28.
One-for-one swaps are what “mergers of equals” look like on paper. They are also, in several cases, generous to the absorbed side. If two banks have the same par value but different book values per share, a one-for-one swap transfers value from the shareholders of the bank with the higher book value to those of the bank with the lower one. Whether it did in each case depends on valuations that were never fully published. What can be said is that the ratios moved a long way from where they started, at a time when the absorbed banks were generally no stronger relative to their partners than the targets of the first wave had been.
There is a simpler explanation for the drift as well. In the first wave a large commercial bank was buying a small institution that had little choice. In the second, the two sides were of more similar size, both had boards and promoter groups with something to lose, and neither could be told to accept a heavy discount. Equal ratios made the deals easier to agree. They did not make them better for the shareholders of the stronger bank.
5. The market’s first verdict
If the market believed mergers created value for the acquirer, the acquirer’s share price would tend to rise relative to other banks when a deal was announced. The cleanest public date in the Nepali process is the memorandum of understanding, signed when two boards agree in principle to merge. The register records an MoU date for most deals since 2016.
We measured how each acquirer’s share price moved against the banking sub-index over a short window: from five trading sessions before the MoU date to one session after. The window catches any leak before the signing and the first reaction after it. We could do this for 24 deals. Others had no MoU date in the register or the acquirer’s shares were suspended from trading at the MoU and did not trade again for weeks or months. Global IME’s shares did not trade between 15 June and 7 December 2022 around its MoU with Bank of Kathmandu and Kumari Bank’s did not trade between 25 September and 27 November 2022 around its MoU with Nepal Credit and Commerce Bank. For those deals there is no clean reaction to measure.
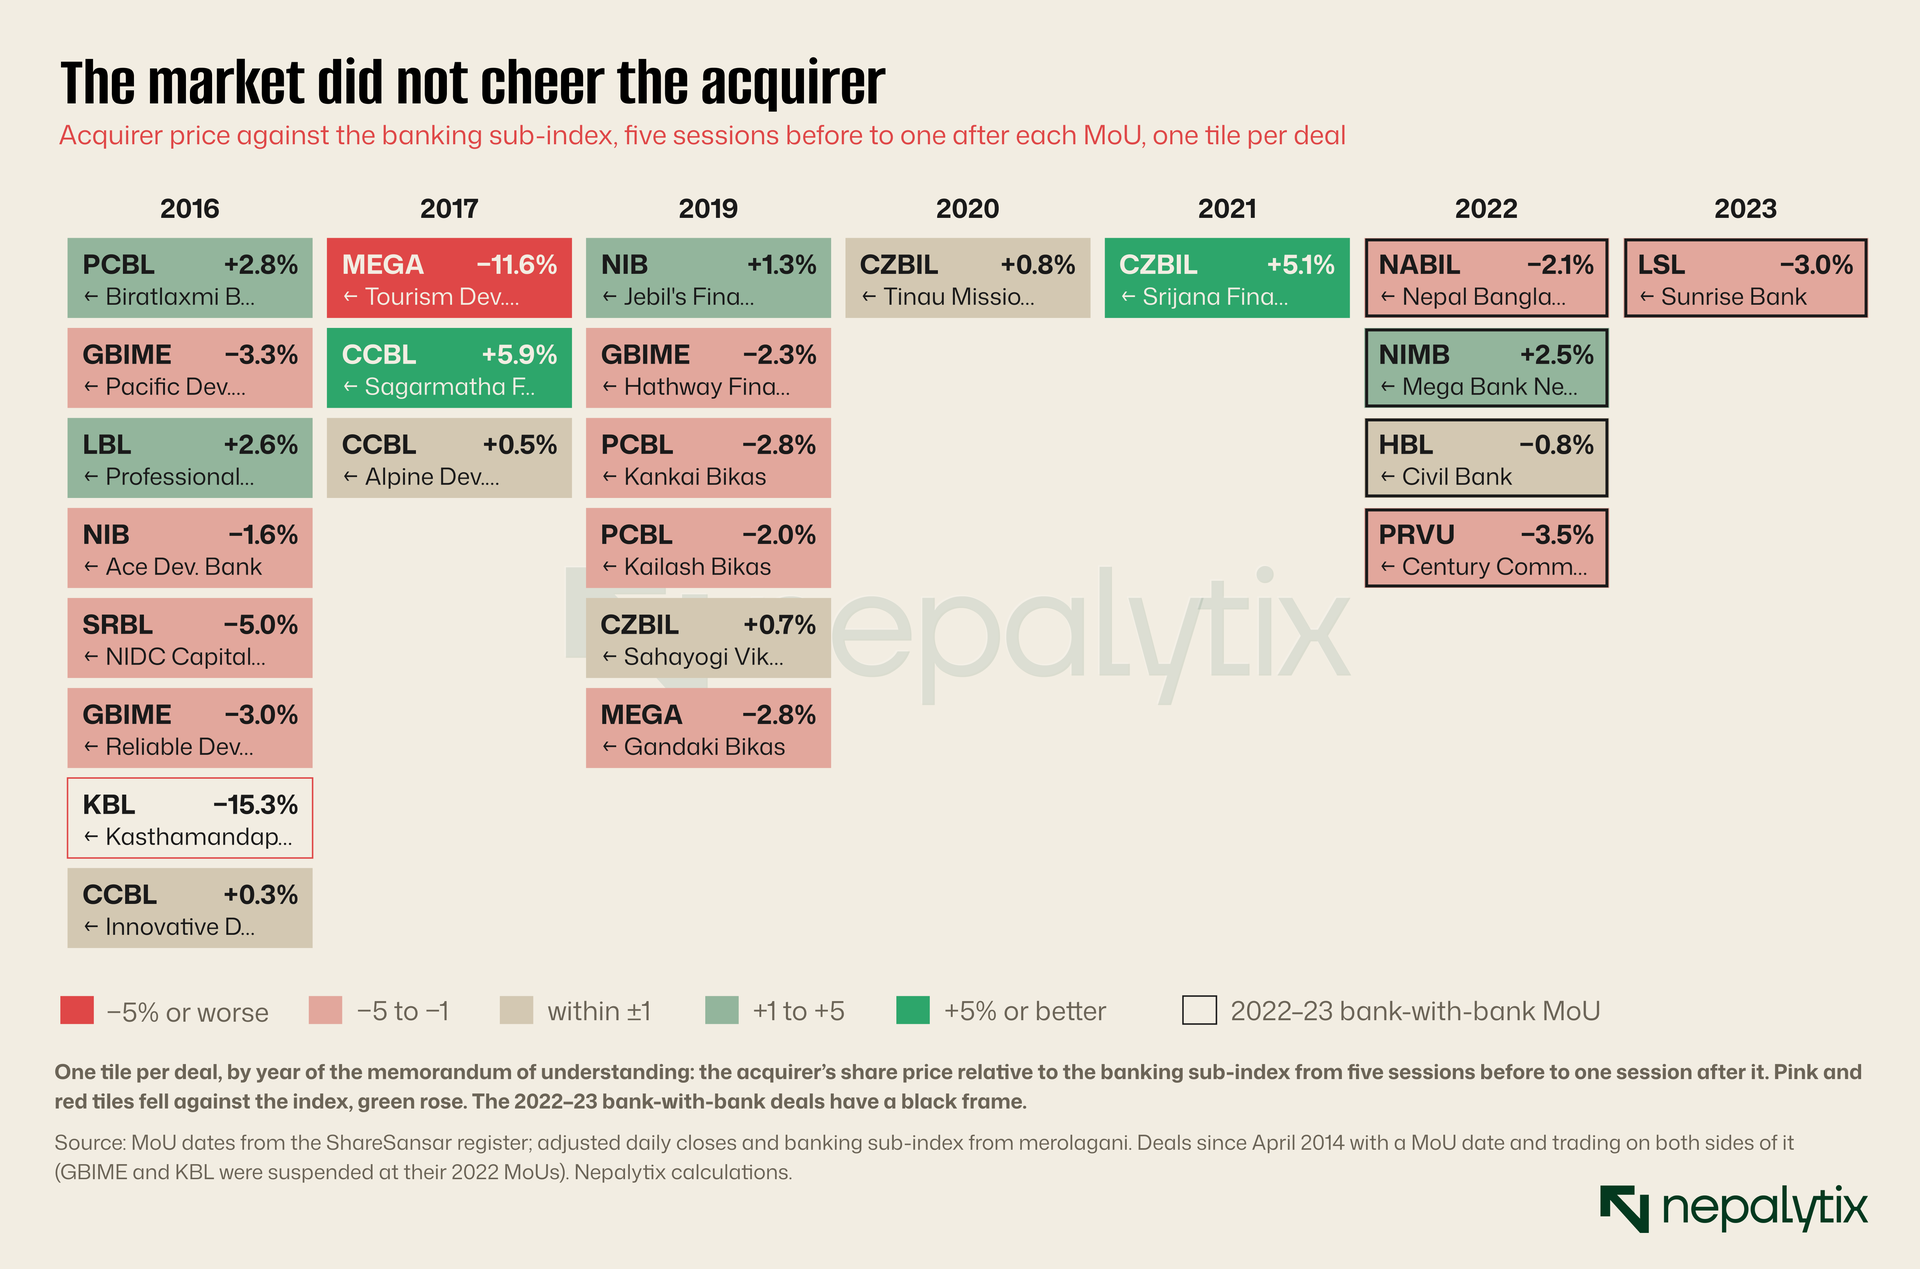
The result is not a celebration. Across the 24 windows the median move relative to the banking index was −1.8%. Only 10 of the 24 acquirers rose against the index. For the 19 deals before 2022 the median was −1.6% with nine rising. For the five 2022 and 2023 bank-with-bank MoUs we could measure, it was −2.1%; only Nepal Investment Bank which rose 2.5% around its MoU with Mega Bank outperformed.
These are small numbers, and a short window around a single date is a noisy instrument. Nepali bank shares can move several per cent in a week on nothing at all. Some of the largest moves in the chart such as Kumari Bank’s fall of 15.3% around its MoU with Kasthamandap Development Bank in October 2016, may include price adjustments for bonus or rights issues that the adjusted series did not fully capture; we leave those tiles pale. Nor does the window say anything about whether the deals worked in the long run. What it does say is that, at the moment of announcement, investors did not treat mergers as good news for the buyer. The typical reaction was a small decline relative to other bank shares.
That is consistent with what studies of bank mergers find in most countries. Target shareholders usually gain on announcement; acquirer shareholders usually do not. The Nepali twist is that in the 2022 and 2023 deals there was not much of a premium for the targets either because most were struck at one-for-one between banks of similar size. The market treated them less as takeovers than as reshuffles.
6. A bigger league, the same table
The most visible effect of the 2022 and 2023 deals was size. Since FY2079/80, the first year-end after most of the deals closed, the seven acquirers have held about half of the deposits of the 19 listed commercial banks: 50.3% that year and 49.3% in FY2082/83. At the end of FY2079/80 they reported combined paid-up capital of Rs 190 billion against Rs 164 billion for the other 12 together.
That looks like concentration. It is less than it seems because most of what the seven acquired was already in the 19-bank total in the form of the banks they absorbed. The right question is whether the merged banks then grew faster than the rest and pulled away. They did not.
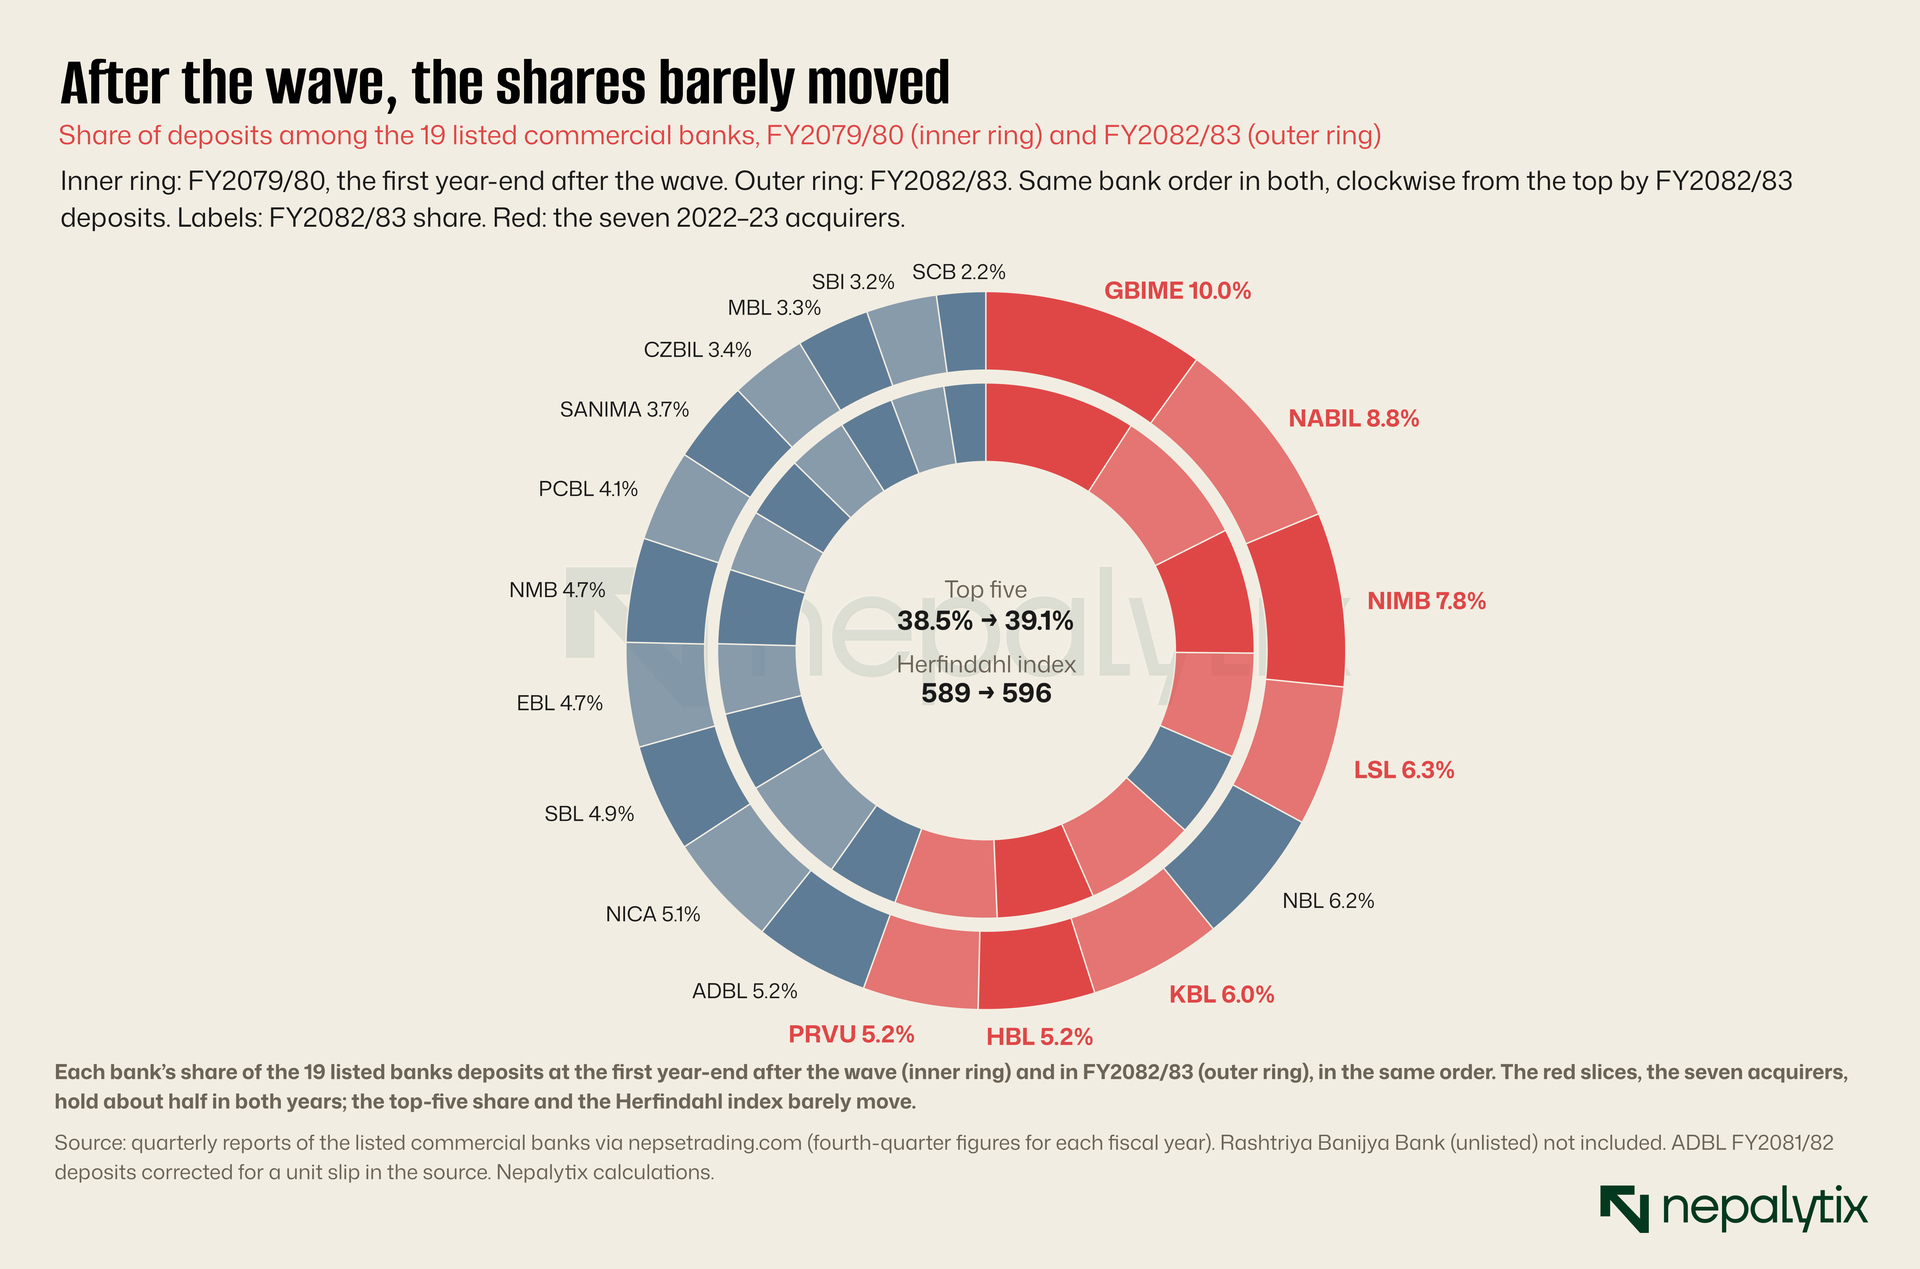
Global IME, Nabil and Nepal Investment Mega Bank have been the three largest listed banks by deposits at every year-end since FY2079/80, in that order. Below them the order shifts from year to year, and the merged banks have not consistently gained ground. Kumari Bank fell from fourth to sixth. Prabhu Bank, seventh after the wave was eighth in FY2082/83. Himalayan Bank dropped to ninth in FY2081/82 before recovering to seventh. Laxmi Sunrise climbed from sixth to fourth. Nepal Bank, which did not take part in the wave, rose from ninth to fifth.
The concentration measures barely move. The five largest banks held 38.5% of the 19 banks deposits in FY2079/80 and 39.1% in FY2082/83. The Herfindahl–Hirschman index, the sum of squared market shares that competition authorities use to judge concentration, went from 589 to 596. By the conventional reading, anything below 1,500 is an unconcentrated market. Even after the wave, Nepal’s listed commercial banks look less like an oligopoly than like a crowded field of similar-sized lenders, the largest of which holds about a tenth of the deposits.
That is worth saying because one of the arguments against further consolidation is that it will create banks too big to fail and too powerful for their customers. On these numbers, there is a long way to go before that becomes a serious concern. The more pressing question is the opposite one. If consolidation has not produced dominant banks, has it produced better ones?
7. Seven deals, one at a time
Averages across seven banks can hide as much as they show and the seven deals were not alike. Here is what the register and the banks own year-end reports say about each, in the order the swaps were completed. Figures for FY2078/79 are for the acquirer on its own, before the deal; figures from FY2079/80 onwards are for the combined bank.
Nabil and Nepal Bangladesh Bank. The first of the wave and the only one priced as a takeover. Final approval came on 29 June 2022 and the swap on 11 July 2022, at 100:43: holders of Nepal Bangladesh Bank received 43 Nabil shares for every 100 of their own. Nabil had already absorbed United Finance a year earlier, at 100:35. Its deposits went from Rs 326 billion in FY2078/79 to Rs 397 billion the following year and Rs 593 billion in FY2082/83. Its NPL ratio rose from 1.54% to 4.2%, roughly in line with the banks that did not merge. Net profit rose from Rs 4.97 billion to Rs 7.91 billion and profit per rupee of paid-up capital from 21.8% to 24.6%. On the accounts, this is the one deal of the seven that looks like it worked. The share price tells a different story: down 17% since July 2022 although Nabil still trades at 2.2 times book among the highest valuations of any Nepali bank.
Nepal Investment Bank and Mega Bank. The MoU was signed on 10 June 2022, final approval came on 29 November and the swap on 11 January 2023 at 100:90. The combined bank, Nepal Investment Mega Bank, reported deposits of Rs 354 billion at the end of FY2079/80 and Rs 527 billion at the end of FY2082/83, keeping it third among the listed banks throughout. Its NPL ratio climbed every year from 4.35% to 8.66%. Net profit reached Rs 6.76 billion in FY2081/82 and then fell to Rs 2.75 billion in FY2082/83 when the bank charged Rs 6.19 billion for impairment, the largest charge of any listed bank that year. Its paid-up capital has stayed at Rs 34.1 billion, second only to Global IME’s. The share price, carried through from Nepal Investment Bank’s, is down 45% since July 2022 and the bank trades at almost exactly its book value.
Global IME and Bank of Kathmandu. The MoU was dated 16 June 2022. Global IME’s shares then stopped trading until 7 December. Final approval came on 3 January 2023 and the swap six days later at one-for-one. Global IME had been the most active acquirer of the decade: the register lists it as the survivor in eight deals, including Janata Bank in 2019. After Bank of Kathmandu it became the largest listed bank with deposits of Rs 426 billion at the end of FY2079/80 and Rs 669 billion in FY2082/83. Its NPL ratio rose from 1.22% before the deal to 4.96%, close to the middle of the pack. Net profit went from Rs 5.21 billion to Rs 6.23 billion but paid-up capital went from Rs 23.8 billion to Rs 38.1 billion so profit per rupee of capital fell from 21.9% to 16.4%. The share price has roughly tracked the banking sub-index.
Kumari Bank and Nepal Credit and Commerce Bank. The MoU was dated 26 September 2022 and Kumari’s shares did not trade again until 27 November. Final approval came on 26 December and the swap on 1 January 2023, at one-for-one. The merged bank kept Kumari’s name. Deposits rose from Rs 177 billion to Rs 316 billion with the merger and to Rs 403 billion by FY2082/83. The NPL ratio went from 0.96% before the deal to 4.77% in the first year and 7.46% in FY2082/83. Net profit fell from Rs 2.84 billion to Rs 1.96 billion in the first year on almost double the capital, and stayed near Rs 2 billion for two more years. In FY2082/83 it jumped to Rs 7.39 billion, helped by a net write-back of Rs 1.44 billion of impairment provisions at the same time as the NPL ratio rose. A profit driven by releasing provisions while bad loans increase is not the same thing as a recovery.
Prabhu Bank and Century Commercial Bank. MoU on 31 July 2022, final approval on 3 January 2023 and the swap on 10 January, at one-for-one. Deposits went from Rs 179 billion to Rs 289 billion and then grew more slowly than at any other merged bank, to Rs 348 billion. For three years the NPL ratio sat close to 5%. In FY2082/83 it jumped to 15.55%, the bank charged Rs 4.94 billion for impairment and reported a net loss of Rs 0.24 billion. Its loan-loss provisions covered only 69% of its non-performing loans against more than 100% at every other merged bank. Of all seven, Prabhu’s is the case where the absorbed and existing loan books together have clearly turned into a problem.
Himalayan Bank and Civil Bank. The MoU was signed on 13 July 2022 and the swap completed on 24 February 2023, at 100:80.28. Deposits rose from Rs 168 billion to Rs 275 billion and to Rs 352 billion by FY2082/83. The NPL ratio went from 0.77% before the deal, one of the lowest in the system, to 7.96%. Net profit was Rs 3.27 billion in the first year after the merger and has fallen in each year since to Rs 1.48 billion. Profit per rupee of paid-up capital went from 19.1% to 6.5%. The share price is down 26% since July 2022 and the bank trades at 1.14 times book.
Laxmi Bank and Sunrise Bank. The last of the wave. MoU on 9 January 2023, final approval on 7 July and the swap on 14 July 2023, at one-for-one. The combined bank, Laxmi Sunrise, reported deposits of Rs 296 billion at the end of FY2079/80 and Rs 424 billion in FY2082/83, rising from sixth to fourth by deposits. Its NPL ratio rose from 2.81% to 5.23%. Net profit rose from Rs 2.26 billion to Rs 3.12 billion. It is the only one of the seven whose share price has comfortably beaten the banking sub-index up 69% since July 2022.
Taken together, the seven cases do not support a single story. Nabil, the one acquirer that paid a takeover price has the best accounts. Laxmi Sunrise and Global IME are middling. Himalayan, Nepal Investment Mega and Prabhu have deteriorated badly, and Kumari’s latest profit rests on released provisions. Nor did the merged banks grow faster. From FY2079/80 to FY2082/83 the seven acquirers combined deposits rose 40.8%; those of the other 12 rose 46.2%.
8. What merging did to the books
For the seven banks of the 2022 and 2023 wave, there are now four full fiscal years of results since the deals and one before them. We compare the seven with the 12 other listed commercial banks. The comparison is imperfect in ways we discuss below, but it is the only like-for-like test available. Both groups faced the same economy, the same interest-rate cycle and the same regulator over the same five years.
Start with bad loans. The non-performing loan ratio, the share of loans on which borrowers have stopped paying as agreed, rose at almost every bank in Nepal between FY2078/79 and FY2082/83. Weak demand, a slump in construction and real estate and the end of a period of easy credit all played a part. The question is whether the merged banks did better or worse than the rest. They did worse.
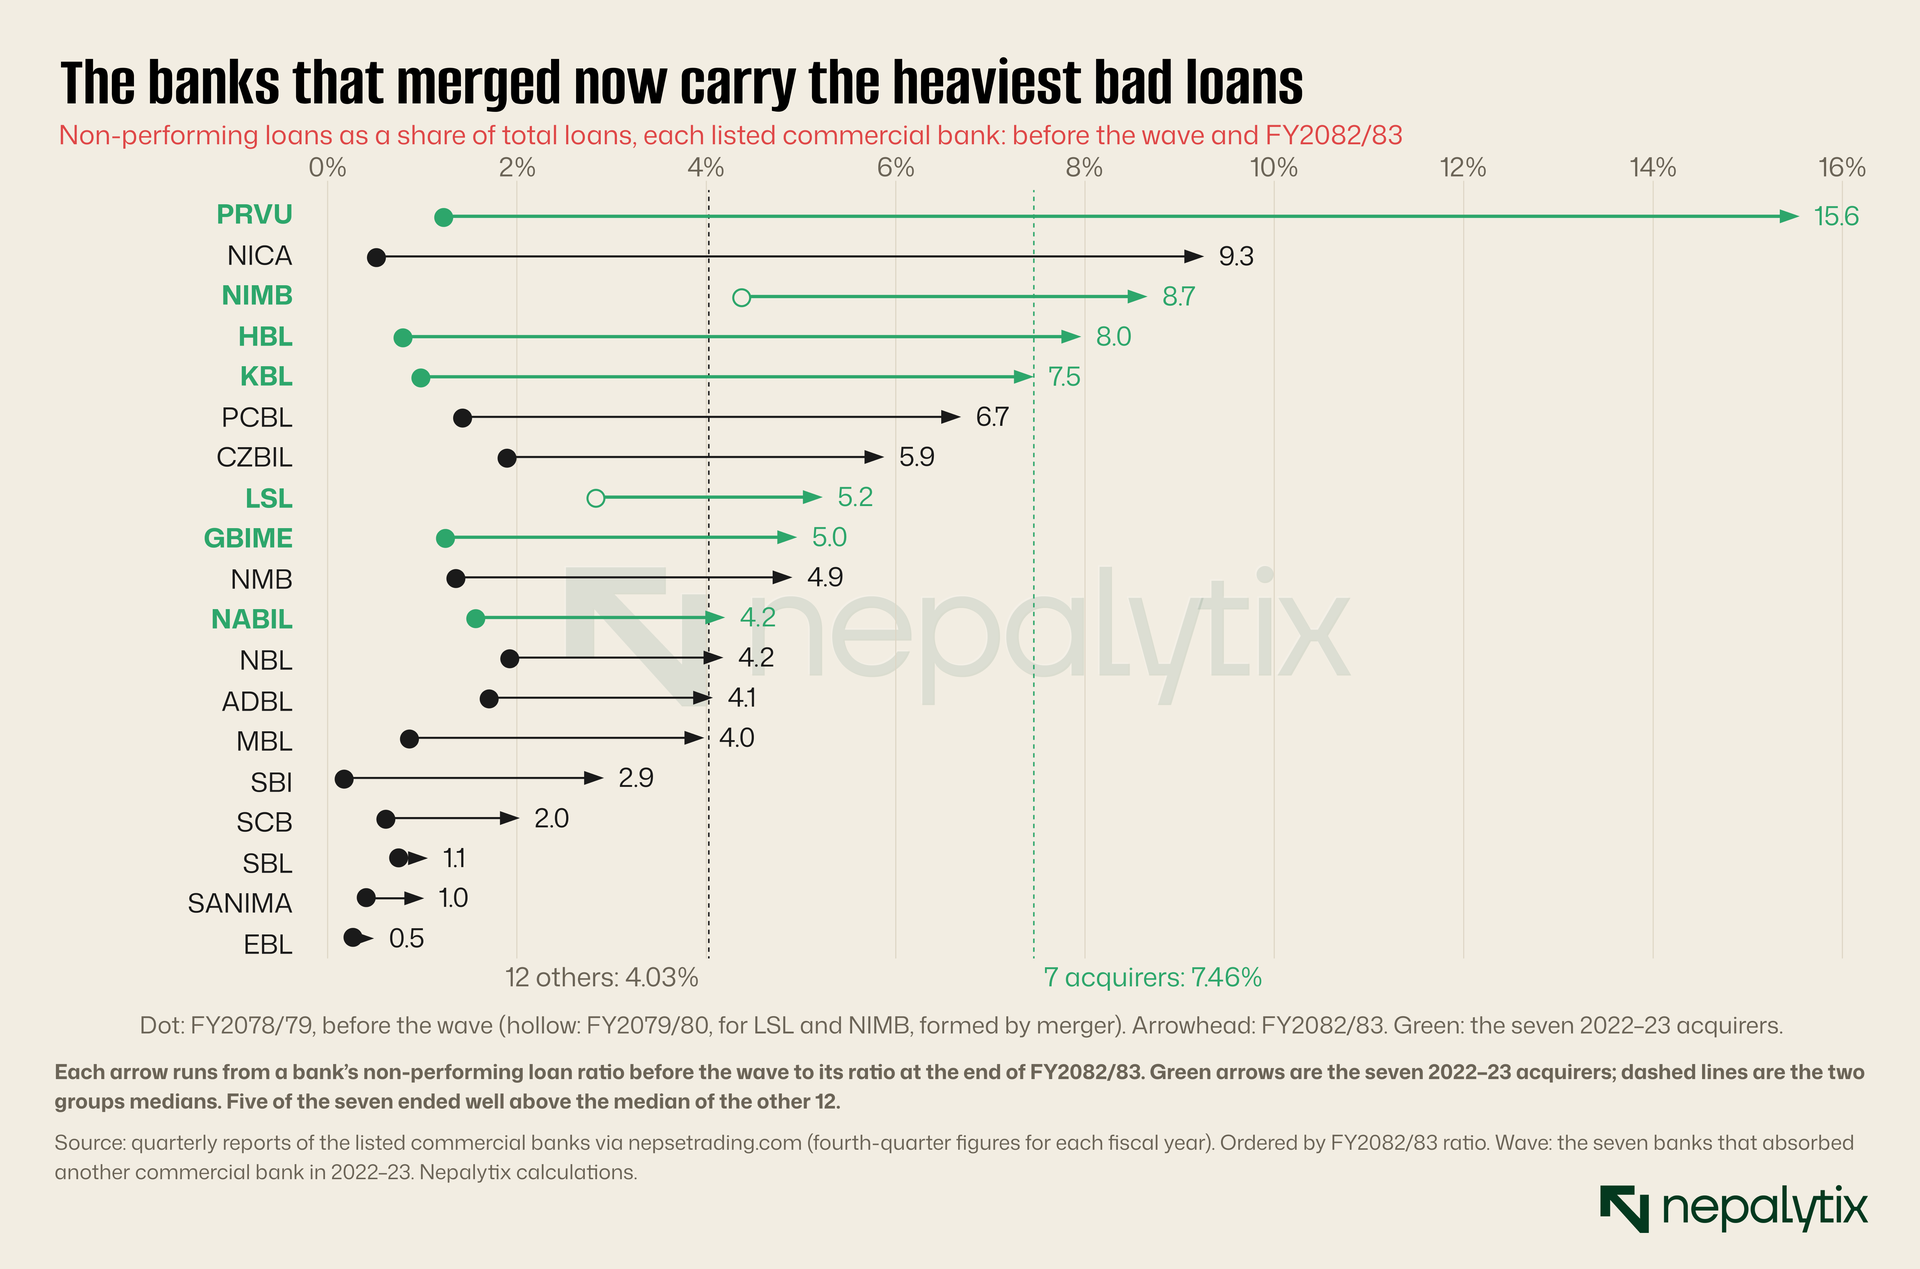
At the end of FY2078/79, before the wave, the five future acquirers for which we have a figure had a median NPL ratio of 1.2%, against 0.94% for the other 12. The gap was small. By FY2079/80, the first year-end after the deals, the seven acquirers had a median ratio of 4.16% against 2.28% for the others. By FY2082/83 it was 7.46% against 4.03%. Prabhu Bank reported 15.55%, the highest of any listed commercial bank. Nepal Investment Mega Bank reported 8.66%, Himalayan 7.96% and Kumari 7.46%. Of the 12 other banks, only NIC Asia, at 9.26%, was worse than any of those four.
Not every merged bank looks like this. Nabil ended FY2082/83 with an NPL ratio of 4.2%, close to the median of the non-merged group. Global IME was at 4.96% and Laxmi Sunrise at 5.23%. And the non-merged group includes its own problems: NIC Asia’s ratio jumped from 1.87% to 9.26% in a single year without any merger to blame. But on the median and on the spread, the merged banks carry the heavier load. The impairment charges tell the same story in rupees. In FY2082/83 the seven acquirers between them charged Rs 23.6 billion to profit for expected credit losses. The 12 others charged Rs 13.0 billion. The two groups hold roughly equal shares of the 19 banks deposits.
Profit follows. A simple and comparable measure across banks is net profit divided by paid-up capital which for a Nepali bank with Rs 100 par shares is the same as earnings per share divided by 100.
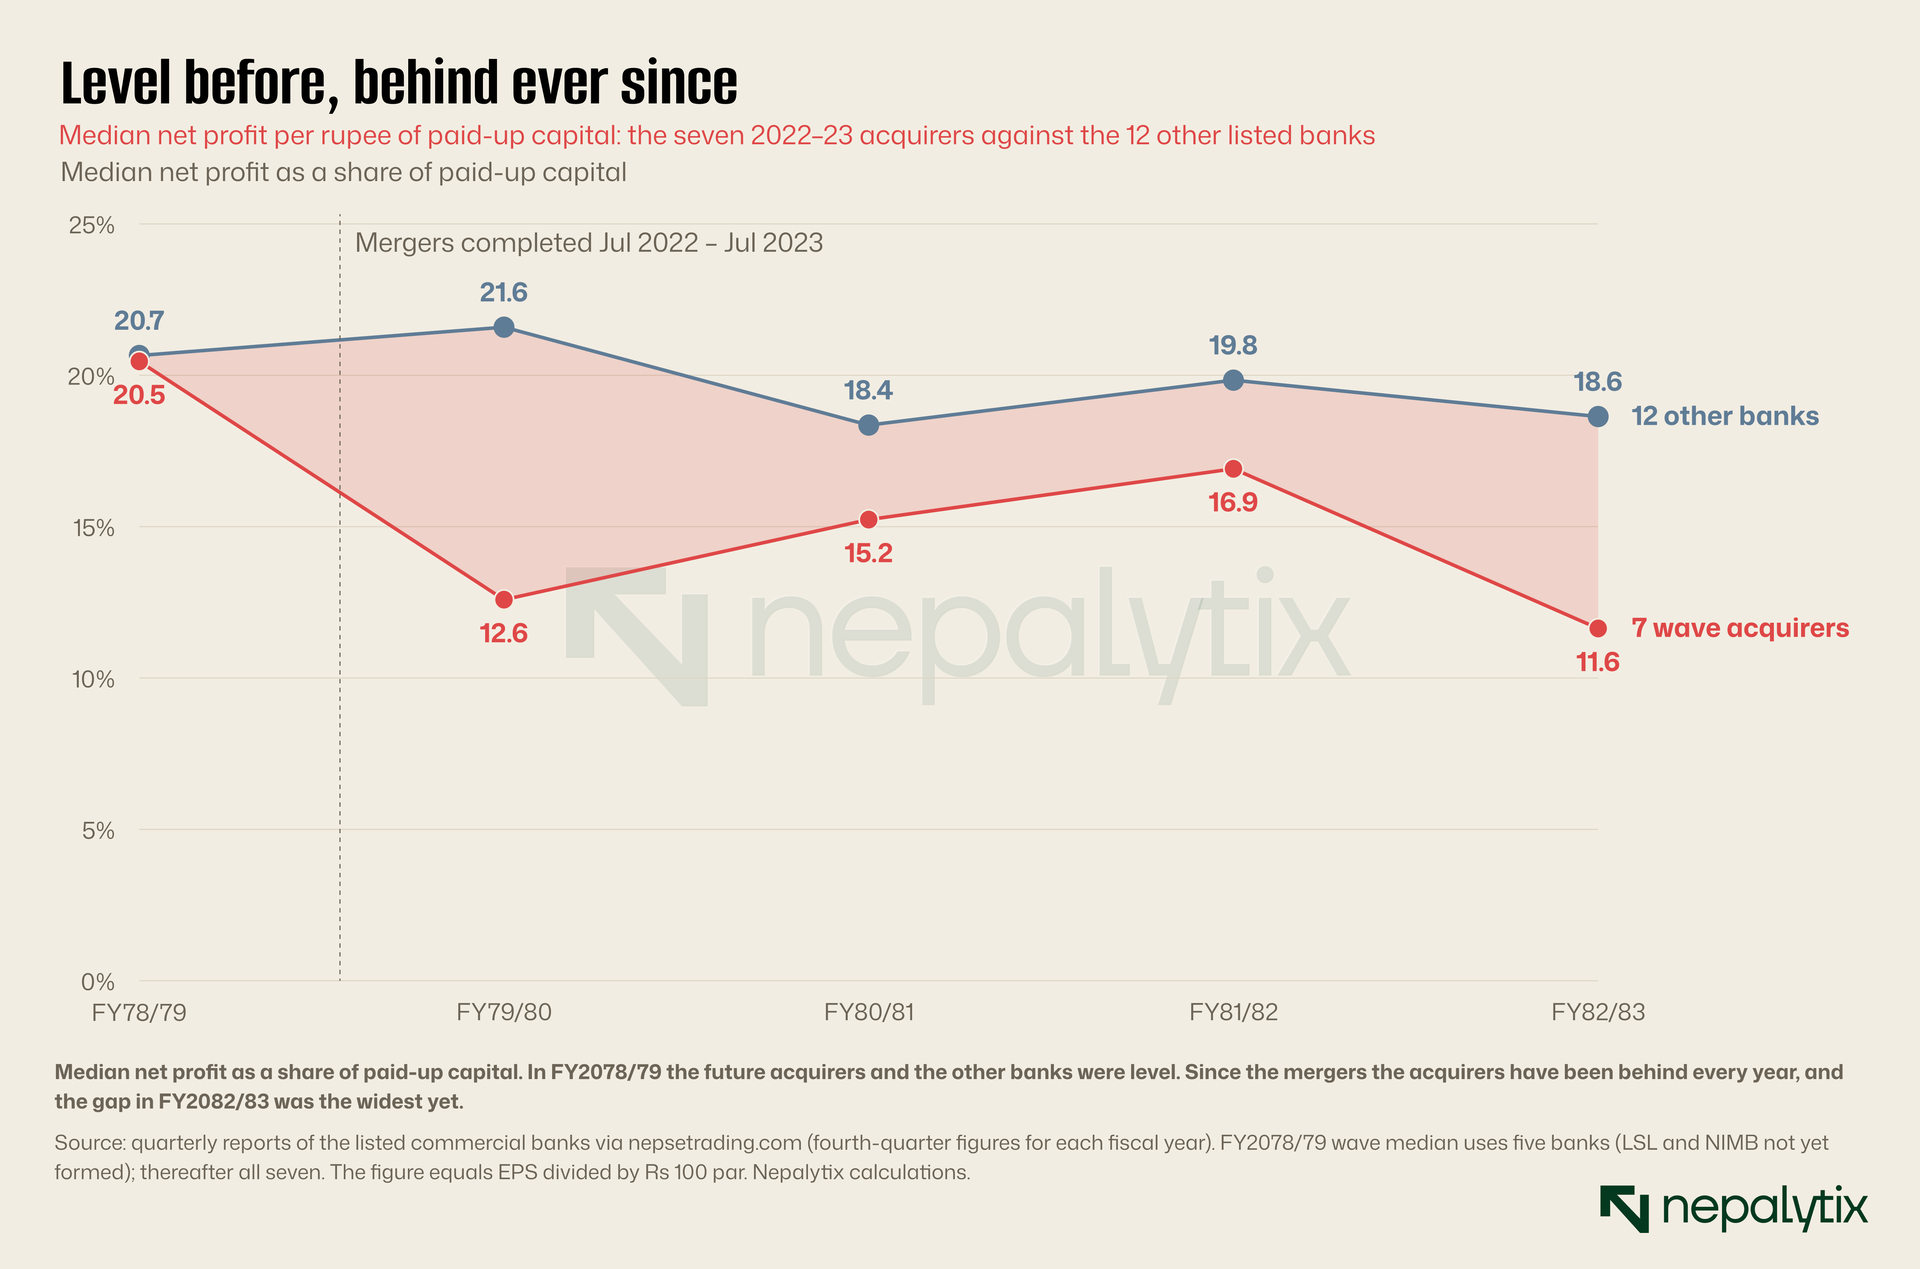
Before the wave, the two groups earned the same: a median of 20.5% of paid-up capital for the future acquirers and 20.7% for the others. In FY2079/80, the year of the deals, the merged banks median fell to 12.6% while the others rose to 21.6%. The gap narrowed over the next two years, to 15.2% against 18.4% and then 16.9% against 19.8%. In FY2082/83 it widened again to 11.6% against 18.6%. Put in rupees, the seven acquirers earned Rs 28.6 billion in FY2082/83 on Rs 203 billion of paid-up capital. The 12 others earned Rs 36.7 billion on Rs 192 billion.
Part of this is arithmetic. When a bank absorbs another, it takes on that bank’s paid-up capital in full and it issues new shares to the absorbed bank’s shareholders. If the absorbed bank was earning less per rupee of capital, the combined bank will too, at least until the merger produces savings. But that is precisely the point. The case for merging was that it would produce those savings: fewer duplicate branches, one head office instead of two, one IT system, more bargaining power with depositors. Four years on, there is little sign of them in the medians.
The funding side tells the same story more quietly. The merged banks did not get cheaper money. Their median cost of funds in FY2082/83 was 3.28%, against 3.39% for the others: a difference of a tenth of a percentage point which is small enough to be noise. In FY2079/80 it was 8.18% against 7.79% slightly worse for the merged banks. A bigger balance sheet did not translate into noticeably cheaper deposits which is what one would expect in a market where deposit rates have often moved within a narrow band set by bankers agreements and central-bank guidance, and where depositors move on rate rather than size.
9. What investors think now
The share market has had four years to digest the results. Its verdict is in the prices.
From 15 July 2022 to 16 October 2026 the banking sub-index rose 15%. The median wave acquirer’s share price, adjusted for bonus and rights issues was down 1% over the same period. The median of the other 12 banks was up 27%. Nepal Investment Mega Bank fell 45%, Himalayan Bank 26% and Nabil 17%. Laxmi Sunrise, up 69% is the only one of the seven to have outperformed the sub-index by a wide margin. The best performers were banks that stayed out of the wave altogether: Everest Bank up 149%, Siddhartha 85% and Standard Chartered 83%. Staying out was no guarantee: NIC Asia fell about 40%.
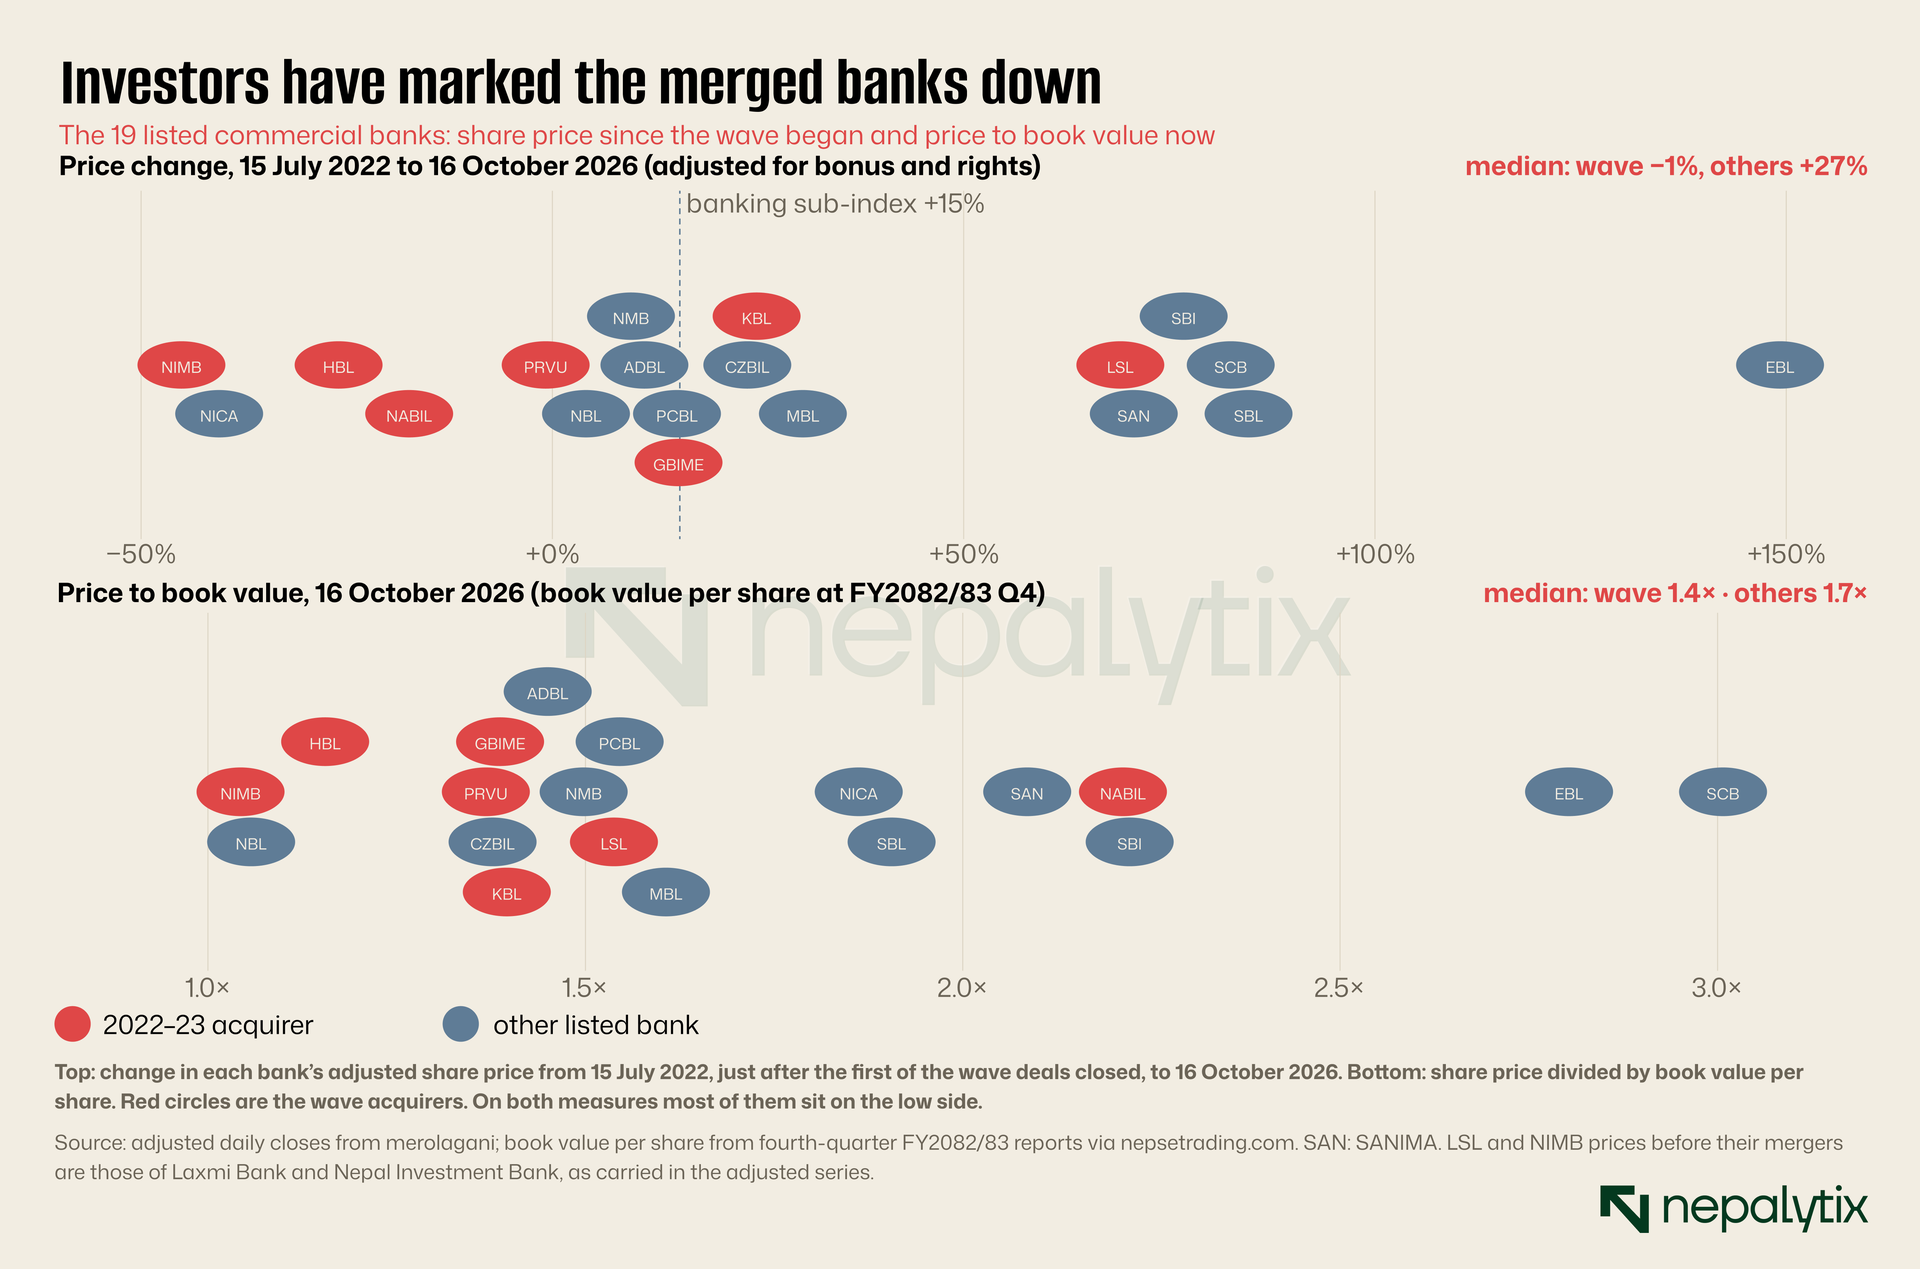
Valuations point the same way. At the 16 October close, the seven wave acquirers traded at a median of 1.4 times their book value per share. The 12 other banks traded at a median of 1.7 times. Nepal Investment Mega Bank traded at almost exactly book value. Himalayan traded at 1.14 times. Only Nabil, at 2.2 times is valued like the market’s favourite banks and Nabil’s premium long predates its acquisition of Nepal Bangladesh Bank.
A price-to-book ratio is a rough judgement on how much a bank will earn on its equity in future. A bank that is expected to earn well above its cost of capital trades at a premium to book. One expected to earn less, or whose book value is suspected of including loans that will never be repaid, trades closer to book or below it. The market is saying that it expects the merged banks to earn less on their equity than the others or that it trusts their book values less, or both.
10. Is it the merger or the partner?
All of this is a comparison between two groups of banks, not a controlled experiment. Before concluding that merging made the seven banks worse, it is worth asking what else could explain the gap.
The most obvious answer is selection. The banks absorbed in 2022 and 2023 were not chosen at random. Several were known to be under strain. Merging was for some of them, a way out of a problem the regulator wanted solved quietly. If the acquirers took on partners with weak loan books, the merged banks would report higher bad loans afterwards whether or not the merger itself did anything. In that reading, the high NPL ratios of the merged banks are the absorbed banks old problems resurfacing under a new name not a failure of the merger.
That reading has support in the numbers. The gap in NPL ratios opened up immediately: the merged banks median jumped to 4.16% in the first year-end after the deals against 2.28% for the others. It is hard to see how a merger could create that many bad loans in a few months. It is easy to see how combining two loan books, one of them weaker and then applying a single, consistent classification to the combined book could reveal them.
The seven individual cases add some weight to this reading. The one deal priced as a takeover, Nabil’s at 100:43 implies that the valuers judged Nepal Bangladesh Bank’s shares to be worth well under half of Nabil’s. A price that low leaves room for bad news in the absorbed loan book and Nabil’s results since have held up. The one-for-one deals left no such room. If the absorbed banks in those deals were weaker than their partners, the swap ratio did not say so and the shareholders of the stronger bank absorbed the difference when the loans went bad. That is a pattern consistent with selection and with generous pricing at once and it is the combination that should worry shareholders most because it means the weakness was there to be found before the vote.
The second explanation is integration. Combining two banks is expensive. There are severance and retirement costs, duplicate branches to close, IT systems to merge and staff from different cultures to bring together. Those costs fall in the first years after a merger and would depress profits even if the deal eventually paid off. That fits the dip in FY2079/80 and the partial recovery after. It does not fit the renewed widening of the gap in FY2082/83, four years after the deals when integration costs should be largely behind the banks.
The third is the economy. FY2079/80 to FY2082/83 was a hard period for Nepali banks in general, with slow credit growth, a property slowdown and rising bad loans everywhere. The merged banks are on average bigger and have more exposure to the sectors that suffered most. But the comparison group faced the same economy, and its NPL ratios and profits held up better.
None of these explanations is flattering to the case for consolidation. If the merged banks are doing worse because they took on weak partners then the mergers were partly a way of hiding problems inside bigger balance sheets rather than solving them, and the shareholders of the stronger banks paid for it, in some cases at one-for-one swap ratios. If they are doing worse because integration is harder and slower than promised then the promised efficiencies have not yet materialised four years on. If it is the economy then size did not provide the resilience it was supposed to.
What would settle the question is information that is not public: the due-diligence reports on the absorbed banks, their loan books at the date of the merger and the valuation reports behind the swap ratios. Nepal Rastra Bank approves every merger and receives all of this. It does not publish it, and neither do the banks beyond the summary figures in their prospectuses and annual reports.
11. The first wave, ten years on
The 2016 and 2017 deals are harder to judge with the data available because most of the acquirers have since been through further mergers and several no longer exist under their own names. Of the commercial banks that led deals in that first wave, Civil Bank, Century Commercial Bank, Mega Bank, Bank of Kathmandu, Janata Bank, Nepal Credit and Commerce Bank and Sunrise Bank have all since been absorbed themselves. Six of the seven were acquirers in 2016 or 2017 and targets in 2022 or 2023; Janata was absorbed by Global IME in 2019.
That sequence is itself informative. A bank that bought two or three development banks to reach the Rs 8 billion capital floor in 2017 was, five years later, being absorbed by a bigger bank. The capital requirement had been met. The underlying problem that there were too many small commercial banks with similar business models chasing the same customers had not been solved by making each of them slightly larger. It was solved to the extent it has been by the second wave.
The first wave did achieve something important. It removed most of the very small development banks and finance companies, many of which had weak governance and thin capital. The development-bank and finance-company sectors that remain are smaller and by the central bank’s supervisory reports, generally healthier than the ones that existed in 2012. The cost was borne largely by the acquirers which absorbed small institutions at swap ratios that gave the target shareholders a share of a more liquid institution.
12. Microfinance, the unfinished wave
Microfinance is where most of the merger activity has been since 2019 and where it continues. The register records 44 completed microfinance deals with a date: four in 2019, 13 in 2020, nine in 2021, three in 2022, eight in 2023, five in 2024 and one each in 2025 and 2026. Between them they absorbed 47 institutions and three of the deals combined three lenders at once. Three of the four deals listed as in progress in October 2026 are microfinance mergers: Mahila Laghubitta with First Microfinance, Samudayik Laghubitta with Sanjeevani Laghubitta and Jeevan Bikas with Unique Nepal and Manushi Laghubitta.
The microfinance sector has had a difficult few years. Borrower protests over interest rates and collection practices, rising arrears and political pressure on the sector have all hit profits. Merging is one response to that pressure: fewer, larger lenders with more diversified loan books and lower overheads per borrower. Whether it works better than it has in commercial banking will depend on whether the mergers are used to cut costs and clean up loan books, or simply to combine weak institutions into larger weak institutions.
The evidence from commercial banking is a reason for caution. Mergers pushed by a regulator, struck at ratios that suit both boards and followed by little public disclosure about what was found in the absorbed loan books, have not produced obviously better banks. There is no reason to assume that the same process will work better among microfinance lenders, whose loan books are harder to value and whose borrowers are more vulnerable.
13. What should change
Nepal will probably have fewer banks in five years than it has now. The central bank’s own study suggests it would like to see between 11 and 15 commercial banks and reports of further talks surface from time to time. If that is where the system is heading, the experience of the last decade suggests a few things that would make the next round work better for depositors and shareholders.
Publish the valuations. Every merger rests on a valuation of both institutions, prepared by valuers and reviewed by the central bank. The swap ratio is the only part the public sees. Publishing the valuation reports or at least a summary of the key assumptions, the loan-book adjustments and the resulting net worth per share would let shareholders judge whether a ratio is fair before they vote on it. It would also make it much harder to strike a one-for-one ratio between banks whose books are not equal.
Publish what was found. After every merger, the combined bank should report, once, what the due diligence found in the absorbed bank’s loan book: how much was reclassified, how much additional provisioning was needed and how that compares with what the absorbed bank had reported before. That is the information needed to tell whether a merged bank’s higher NPL ratio reflects the merger or the partner.
Report merged banks against their own baseline. The central bank could require each merged bank to report, for three years after the merger, a small set of indicators against the combined figures of the two banks in the year before: branches, staff, cost-to-income ratio, cost of funds, NPL ratio and return on equity. That would show whether the promised savings materialise.
Limit trading suspensions. Shares of merging banks can be suspended for long periods around the merger. Global IME’s shares did not trade for almost six months in 2022. Long suspensions trap investors in a stock at exactly the moment when the most important information about it is being produced. A shorter, fixed suspension around the swap itself would be enough.
Set the target by quality, not count. The central bank’s own research found that most respondents would put the right number of commercial banks at 11 to 15. A target of that kind is easy to state and easy to measure which is why it is tempting. But a number of banks says nothing about whether the banks that remain are well capitalised, well run and honest about their loans. A merger that takes the count from 20 to 19 by joining a sound bank to an unsound one may make the system weaker not stronger. The supervisory test for approving a merger should be whether the combined bank will be better capitalised and better provisioned than the two banks were apart, judged on loan books that have been independently reviewed not whether it moves the count towards a target.
Stop treating merger as a goal in itself. The most important lesson of the decade is that merging did not, by itself, make banks stronger. The capital deadline of 2017 produced a burst of deals that met a numerical target and created banks that were absorbed again five years later. The wave of 2022 and 2023 produced bigger banks that on the evidence so far, earn less, carry more bad loans and are valued lower than the banks that stayed out. Fewer banks may still be the right goal. But the measure of success should be the quality of the banks that remain, not the number that have gone.
Disclaimer
This report has been prepared by Nepalytix for informational and educational purposes only and does not constitute investment advice, an offer, or a solicitation to buy or sell any securities.
The information contained in this report is based on sources believed to be reliable; however, Nepalytix does not guarantee its accuracy, completeness, or timeliness. Opinions, estimates, and projections expressed herein are those of the authors as of the date of publication and are subject to change without notice.
Investing in securities involves risks, including the possible loss of principal. Past performance is not indicative of future results. Readers are advised to conduct their own independent research and consult with a qualified financial advisor before making any investment decisions.
Nepalytix and its contributors may hold positions in the securities discussed in this report at the time of publication or thereafter.
Neither Nepalytix nor any of its affiliates accept any liability for any loss arising from the use of this report or its contents.