Nepal’s Banks Are Paying Less Than Inflation
Nepali bank deposits now earn 3.21% while inflation stands at 5.14%, leaving savers with a negative real return of 1.93%. With households holding Rs 5.35 trillion of deposits, the widening gap is putting pressure on Nepal’s savings and financial markets.
Nepali bank deposits pay 3.21%. Inflation is 5.14%. The two crossed in March and the gap is still widening. Rs 8.28 trillion is now losing value in the bank and two thirds of it belongs to households.
THE SIGNAL
In Falgun the average deposit rate at a Nepali commercial bank fell below inflation. It has stayed there for five months and the gap is still widening. At mid-July a saver was losing 1.93% a year in purchasing power, the worst reading in four years.
Rs 8.28 trillion sits in Nepali banks. Households hold two thirds of it and added 17.3% over the year, faster than any other holder. Meanwhile they moved twenty-one percentage points of it out of fixed deposits and into accounts they can empty on demand.
A very large amount of money is now parked at a negative real return, in its most liquid form, in a country whose entire stock market is worth about half of it.
Where the rate crossed
The weighted average deposit rate at Nepali commercial banks was 3.21% at mid-July. Year-on-year inflation was 5.14%. The difference is the real return and it is negative.
That much is in the summary release. What the summary does not show is when it happened.
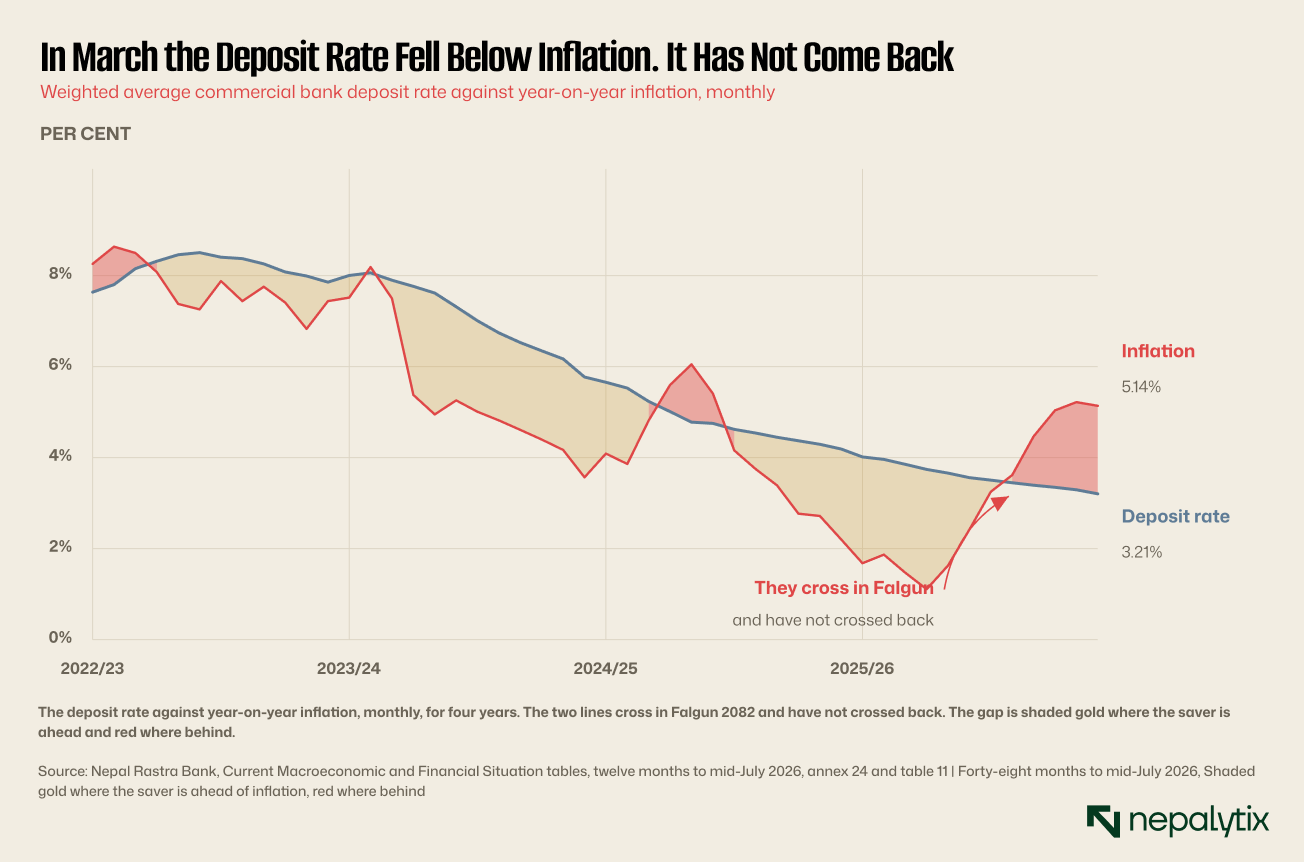
The crossing was in Falgun, which is March. Before that the saver had been comfortably ahead for most of two years. In Mangsir the real return was plus 2.63%. Eight months later it was minus 1.93%. That is a swing of 4.57 percentage points.
What makes the swing unusual is that both sides moved against the saver at once. The deposit rate fell from 3.74% to 3.21% which is half a point. Inflation rose from 1.11% to 5.14%, which is four points. Inflation did most of the work.
That matters for what happens next. A falling deposit rate is a decision banks make and can reverse. Rising inflation is not.
It is worth being precise about what a negative real rate means because the phrase gets used loosely. It does not mean a saver loses rupees. A Rs 100,000 fixed deposit at 3.21% becomes Rs 103,210 after a year. Nobody's balance falls.
It means the Rs 103,210 buys less than the Rs 100,000 did. At 5.14% inflation the same basket of goods now costs Rs 105,140. The saver is Rs 1,930 short of standing still. That is the 1.93%, and it is invisible on a bank statement.
This invisibility is the whole reason the position persists. A loss you can see prompts action. A loss that shows up as a smaller number of goods next year does not.
Look also at what the shading in Figure 1 does over the four years. The saver was behind for three months in late 2022 when inflation was above eight per cent and the deposit rate had not caught up. Then ahead for a long stretch through 2023 and 2024 at one point by 2.67 points. Then three months behind in the winter of 2024/25. Then ahead again through most of 2025.
Twelve of the forty-eight months are negative. Five of those twelve are the most recent five. The current run is the longest unbroken stretch in the series and the only one where the gap has widened every month.
Why the annual figure does not show it
Take the same data and average it over the fiscal year and the alarm disappears.
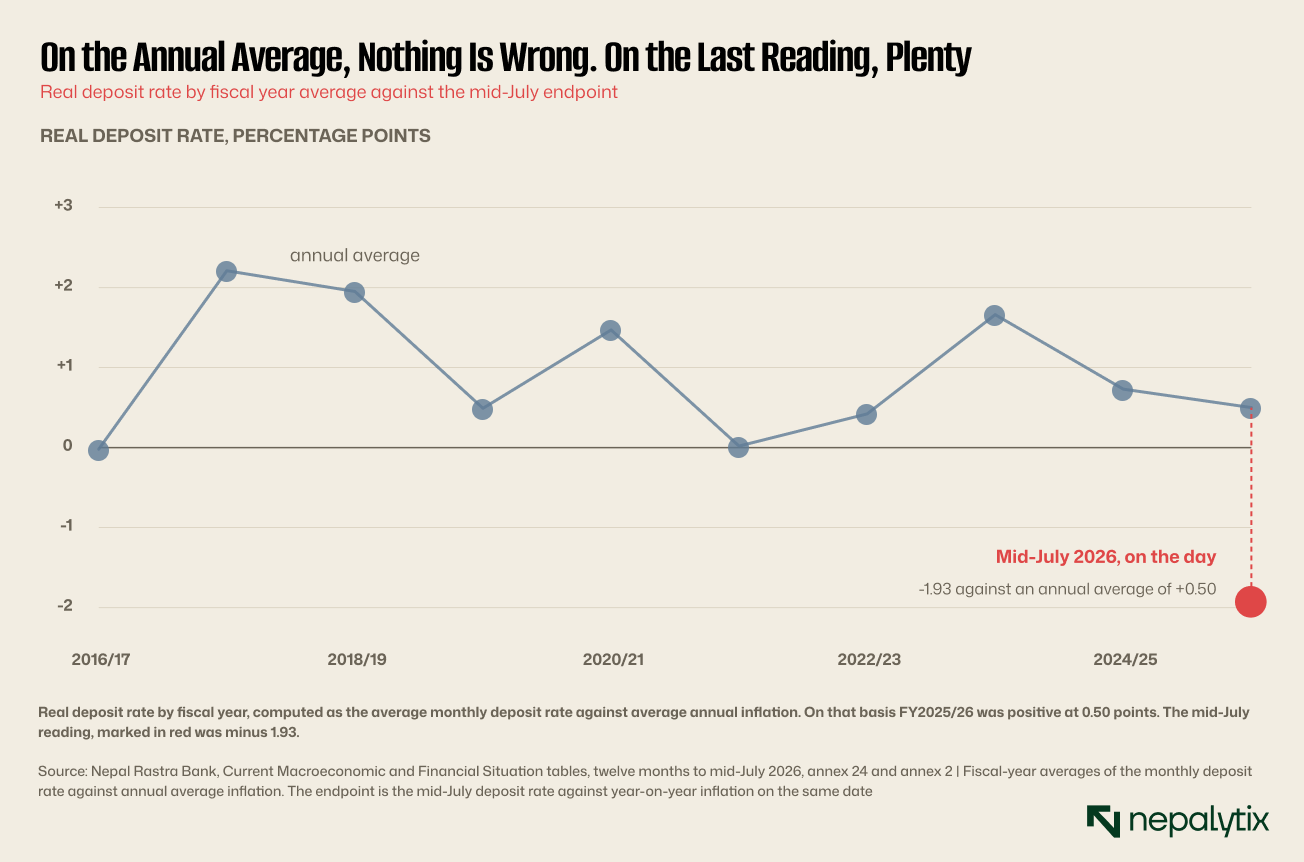
On the annual average the real deposit rate in FY2025/26 was plus 0.50%. Unremarkable, and in line with most of the last decade. Only one fiscal year in ten shows a negative average and that was 2016/17 at minus 0.02%.
The endpoint says minus 1.93%. The average conceals 2.43 percentage points.
Both numbers are correct. They answer different questions. The average tells you what the year was like. The endpoint tells you what today is like and today is what a saver deciding where to put money is actually facing.
Nepal Rastra Bank publishes both. Almost all the coverage quotes the average.
There is a second reason the average understates the problem and it has nothing to do with arithmetic. Inflation for the year averaged 3.08% while food inflation averaged 1.04%. But at the endpoint food inflation was 5.25%, having been minus 1.19% a year earlier.
Food is 35.5% of the Nepali consumer price basket, the largest single component. A basket that weighted toward food and a food price line that swung six and a half points in a year is why the headline moved as fast as it did. It is also why the reversal if it comes could be quick.
How far the problem spreads
The deposit rate is not the only rate below inflation
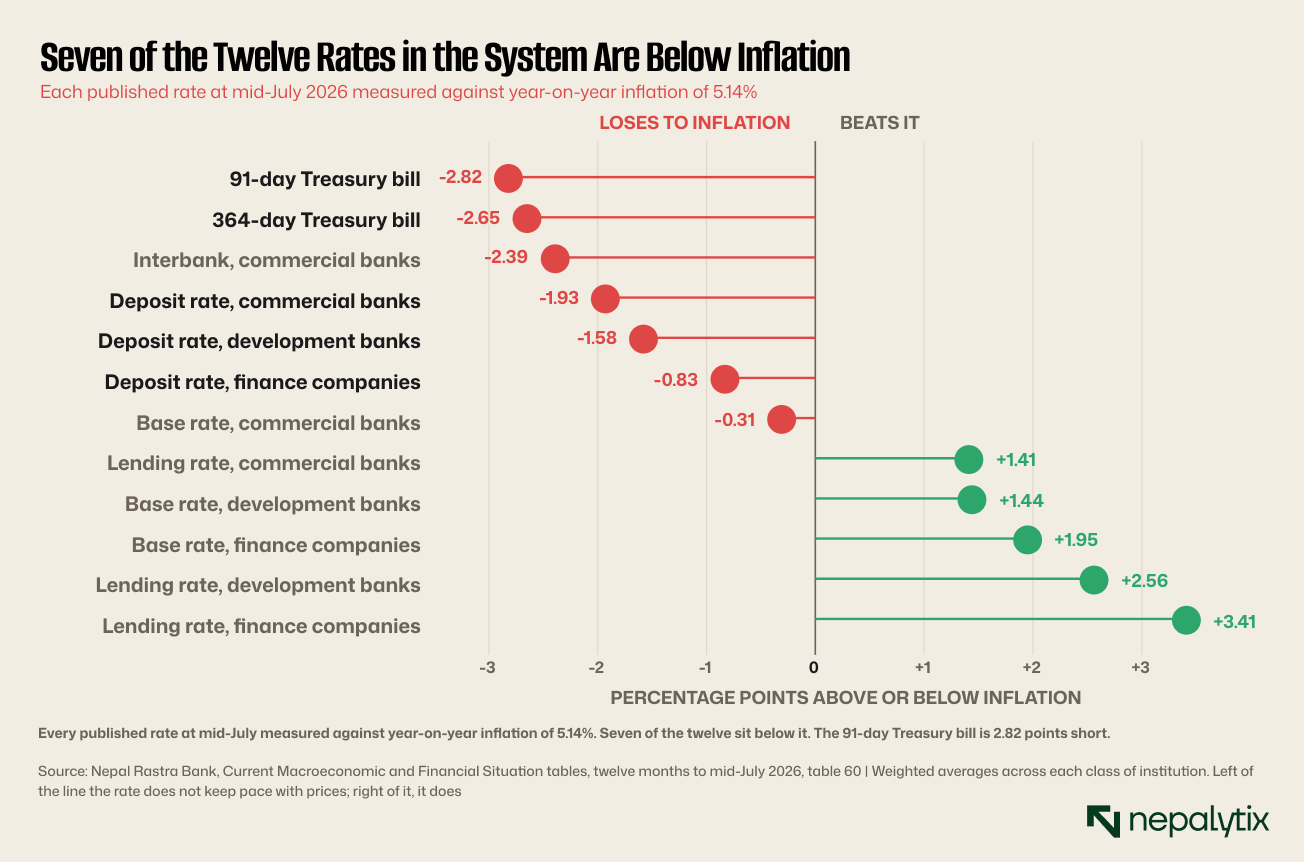
Seven of the twelve rates the central bank publishes are below inflation. The 91-day Treasury bill at 2.32% is 2.82 points short. The interbank rate is 2.39 short. Deposit rates at commercial banks, development banks and finance companies are all below.
What sits above the line is lending. The lending rate at a commercial bank is 6.55% or 1.41 points above inflation. At a finance company it is 8.55% or 3.41 above.
Read together, the ladder describes who is being paid and who is paying. A borrower with a term loan is repaying in rupees that are losing value faster than the rate on the loan for part of the ladder. A depositor is funding that at a loss.
Why banks cannot simply pay more
The obvious question is why banks do not raise deposit rates. They have Rs 8.28 trillion of funding and a queue of savers losing money on it.
The answer is that they do not need it. Deposits grew Rs 1,013 billion over the year. Credit to the private sector grew Rs 359 billion. Deposits grew 2.82 times faster than lending which left about Rs 654 billion of new funding with no borrower attached to it.
A bank that cannot lend what it already has does not bid for more. It does the opposite. That is exactly what the deposit rate falling from 4.19% to 3.21% over the year describes.
Nepal Rastra Bank absorbed Rs 42,504 billion of net liquidity on a transaction basis over the year, against Rs 24,648 billion the year before. Reserve money grew 5.6%, down from 16.1%. The central bank spent the year mopping up what the banking system could not put to work.
So the negative real rate is not a pricing decision anyone made. It is what happens when a banking system takes in far more than it can lend and inflation turns while that is happening.
Who is holding the money
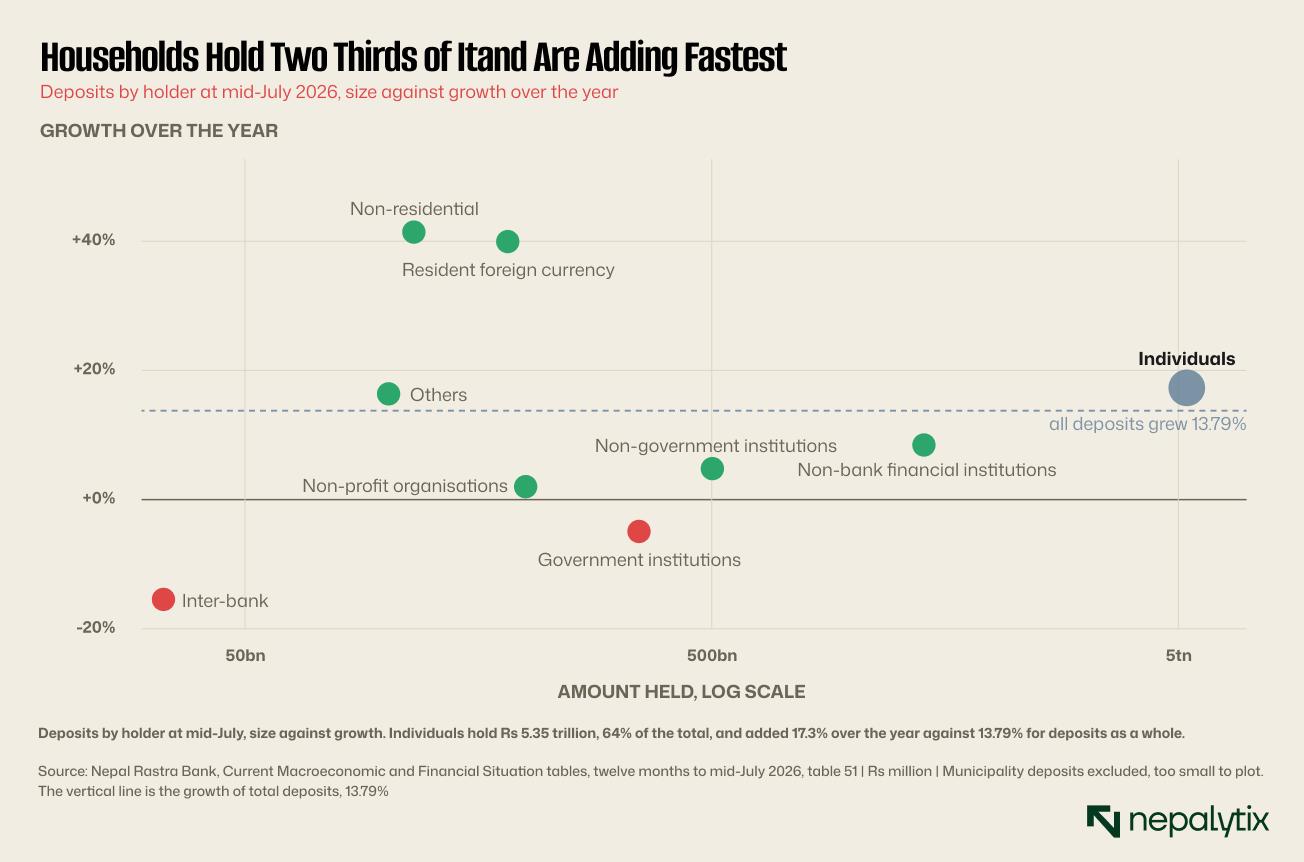
This is the part that turns an interest rate observation into a market one.
Individuals hold Rs 5,349.7 billion, which is 64% of all deposits in the Nepali banking system. That balance grew 17.3% over the year faster than the 13.79% for deposits overall and faster than every large institutional holder.
Insurance companies, by contrast added 0.3%. Government institutions withdrew 4.9%. Inter-bank deposits fell 15.4%. The Employees Provident Fund added 22.5% and Citizen Investment Trust 15.3% but they are small next to households.
So the money accumulating at a negative real return is overwhelmingly household savings, and households are adding to it faster than anyone else. Whatever they do next, they do at scale.
The counterpoint deserves stating. Household deposits growing 17.3% at a negative real return is not obviously irrational. Nepali households save through banks because the alternatives are thin: no broad pension system outside the Employees Provident Fund and Citizen Investment Trust, no household bond market, a property market with high transaction costs and no price transparency and an equity market where as this publication has documented, a quarter of the closed-end fund universe does not trade in a given week.
Money accumulates in banks because there is nowhere else that is both safe and accessible. The negative real return is the price of that and for most households it is a price worth paying.
What that argument does not explain is the composition shift.
One holder worth singling out. Insurance companies hold Rs 665.5 billion of deposits and added 0.3% over the year, effectively nothing. That is a striking contrast with households at 17.3% and it comes in the year this publication documented the sector posting a 39% fall in profit and paying Rs 19.8 billion of claims in nine months.
An insurer whose deposits are flat while the system grows 13.8% is an insurer using its cash rather than accumulating it. That is what a claims year looks like from the banking side of the ledger.
What they have already done
They have not moved the money out of banks. They have moved it within them.
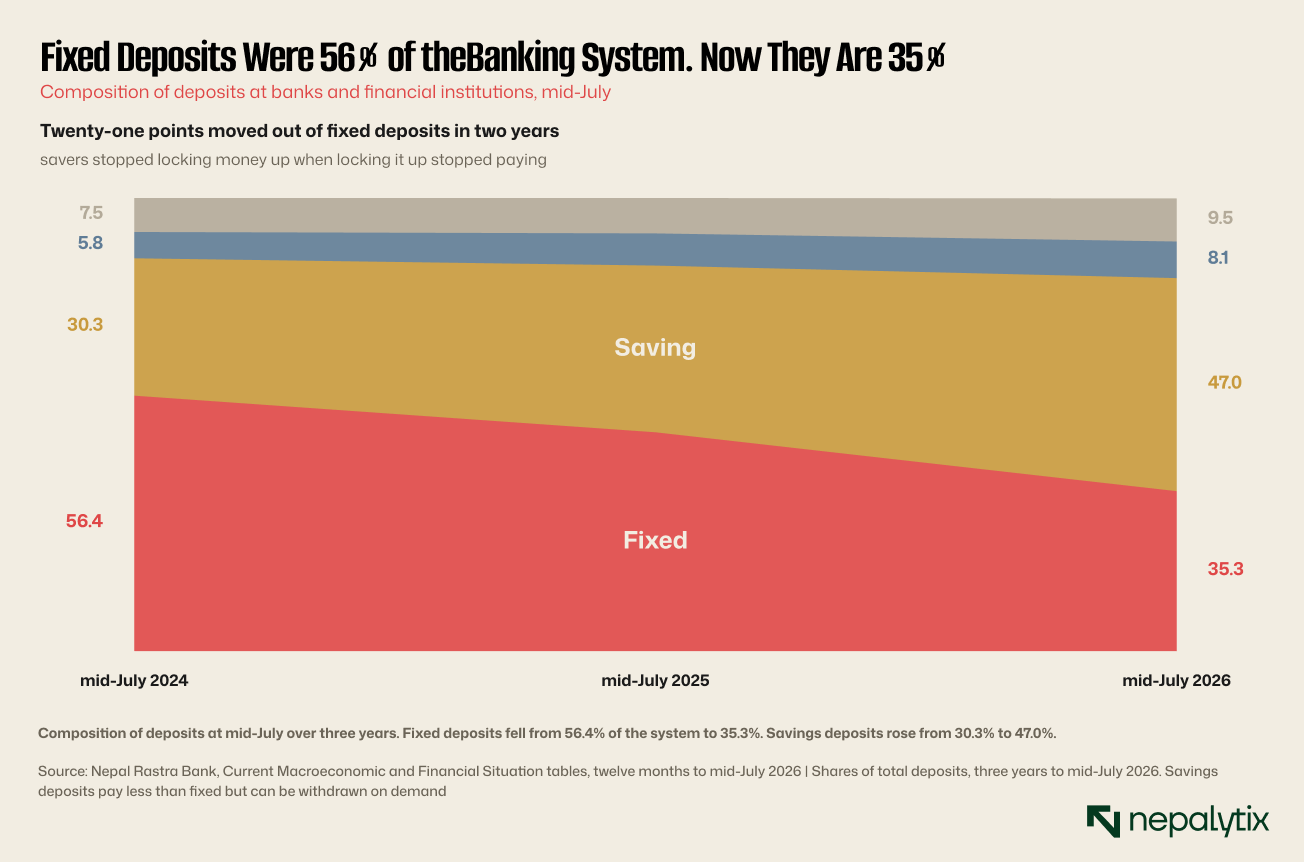
Two years ago fixed deposits were 56.4% of the Nepali banking system. They are now 35.3%. Savings deposits went from 30.3% to 47.0%. Demand deposits rose from 5.8% to 8.1%.
Twenty-one percentage points moved out of money that is locked up and into money that is not. On a Rs 8.28 trillion base that is a very large amount of savings that has been made available at short notice.
The reason is not mysterious. A fixed deposit pays more than a savings account in exchange for committing the money. When the premium for committing shrinks, the commitment stops being worth making. Savers have quietly repriced that trade.
The consequence for banks is that their funding is now much shorter-dated than it was, while their lending is not. Nothing in the published soundness indicators captures that mismatch.
One more consequence of the shift that is easy to miss. Savings deposits pay less than fixed deposits. So a saver moving from a fixed deposit to a savings account is accepting a lower nominal rate in exchange for liquidity, at a moment when the nominal rate is already below inflation.
That is not the behaviour of someone optimising a return. It is the behaviour of someone keeping their options open. And keeping options open costs something which means a lot of Nepali households are paying to be able to move quickly.
Whether they intend to move and where, is not in the data. That they have positioned to be able to is.
The size of the pipe
Now put the two markets side by side.
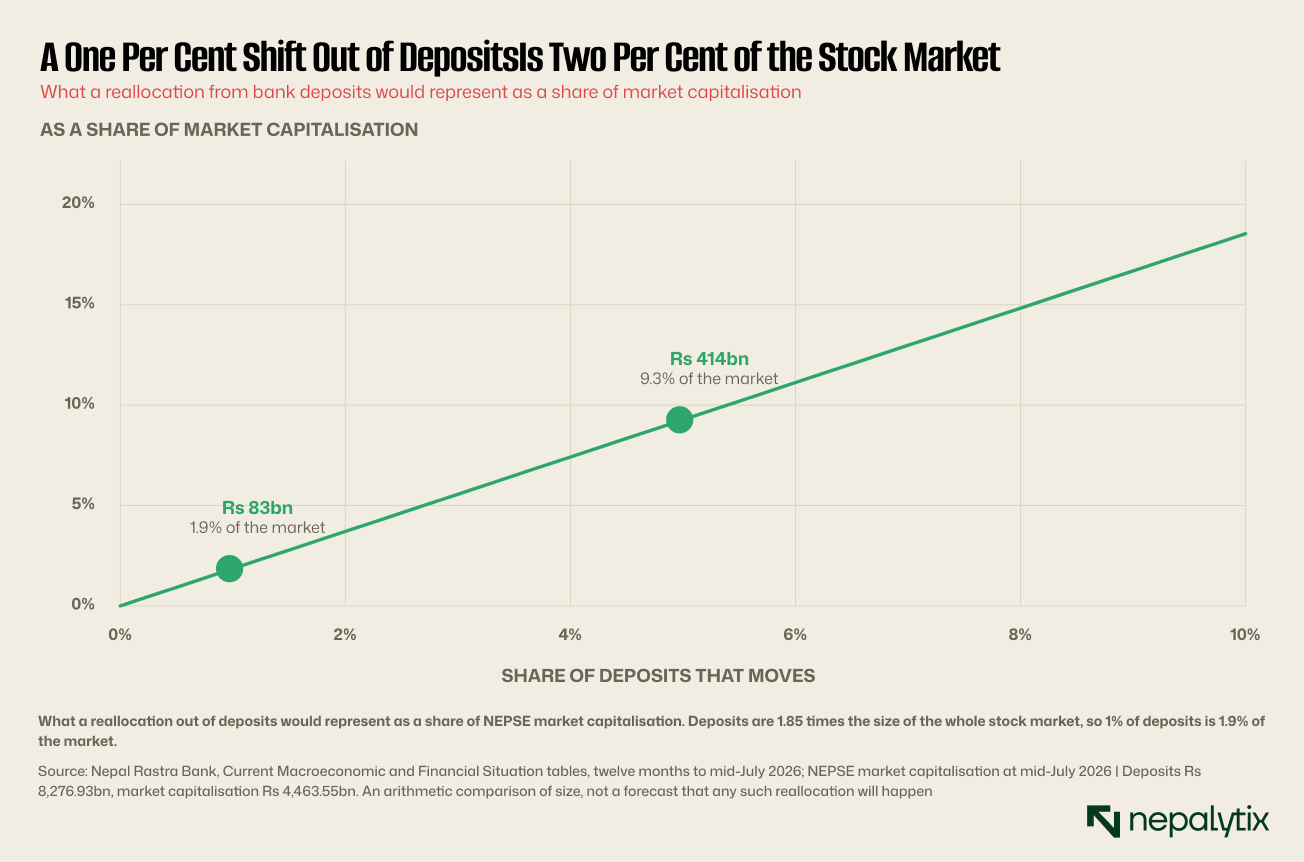
Deposits are Rs 8,276.93 billion. NEPSE's market capitalisation is Rs 4,463.55 billion. Deposits are 1.85 times the entire stock market.
So the arithmetic is unforgiving in both directions. One per cent of deposits is Rs 82.8 billion which is 1.9% of the market. Five per cent is Rs 414 billion which is 9.3%.
Two cautions before anyone reads this as a forecast. It is a statement about relative size and nothing else. Money does not move between these two pools freely, most household deposits are transactional balances that are never going anywhere and the plumbing between a savings account in Nepalgunj and a share purchase on TMS is thinner than the arithmetic suggests.
But the direction of the pressure is not in doubt and neither is the fact that the pool under pressure is nearly twice the size of the one it might flow toward.
What the savings numbers say
One figure from the national accounts frames all of this. Nepal's gross national savings were 44.8% of GDP in FY2025/26 up from 38.4%. Gross domestic savings were 9.7%.
The gap between those two is remittances. Nepalis abroad sent home Rs 2,363 billion and the national accounts count that as national saving even though nothing domestic produced it.
Gross fixed capital formation was 26.3% of GDP. So the country saves 44.8% and invests 26.3%, and the difference shows up as the external surplus and as bank deposits nobody can lend.
Seen that way the deposit pile is not a banking story at all. It is the domestic end of a remittance economy that generates more savings than it has projects to absorb and the negative real rate is the price signal that condition eventually produces.
A final way to size the pressure. Rs 8.28 trillion losing 1.93% a year in purchasing power is about Rs 160 billion of real value a year. That is roughly a fifth of the annual remittance inflow, and it is close to the entire market capitalisation of several listed sectors.
Nobody writes a cheque for it and it appears in no statement. It is simply the amount by which Nepali savings buy less each year while they sit where they are.
What would reverse it
Three things, in order of likelihood.
Inflation falls back. It did most of the damage and it is the most volatile part. Year-on-year inflation was 1.11% in Mangsir and 5.14% in Asar. A number that moved four points in eight months can move back. Food inflation went from minus 1.19% to plus 5.25% over the year, and food is 35.5% of the basket.
Deposit rates rise. Unlikely soon. Banks are sitting on more deposits than they can lend with credit growing 6.5% against deposits at 13.9%. A bank with surplus funding does not bid up for more.
Credit demand returns. This is the one that fixes the whole thing. If borrowing picked up, banks would compete for deposits, rates would rise and the wedge would close from the other side. Nothing in the current data suggests it is happening. Domestic credit grew 2.09% for the year.
Absent all three, the position holds: a very large, very liquid pool of household savings losing purchasing power every month in a market where the alternatives are a stock exchange worth half as much, property, and gold.
That is the signal. Not a prediction about what savers will do but a statement about the pressure they are under and about how much money is under it.
What to watch
The monthly inflation print. It is the volatile half of the calculation and it moved four points in eight months. Food, at 35.5% of the basket, is where the movement came from.
Whether the deposit mix keeps shifting. Fixed deposits at 35.3% of the system is already a two-year fall of twenty-one points. If the next reading is lower again, the funding mismatch on bank balance sheets deepens.
Credit growth. At 6.5% against deposits at 13.9%, this is the variable that would fix everything and the one showing least sign of moving.
Whether anything appears on the household side. Nepal publishes no measure of household financial asset allocation outside the banking system. If money leaves deposits, the first visible sign will be in NEPSE turnover, property registration volumes or gold imports rather than in any statistic designed to capture it.
Disclaimer
This report has been prepared by Nepalytix for informational and educational purposes only and does not constitute investment advice, an offer, or a solicitation to buy or sell any securities.
The information contained in this report is based on sources believed to be reliable; however, Nepalytix does not guarantee its accuracy, completeness, or timeliness. Opinions, estimates, and projections expressed herein are those of the authors as of the date of publication and are subject to change without notice.
Investing in securities involves risks, including the possible loss of principal. Past performance is not indicative of future results. Readers are advised to conduct their own independent research and consult with a qualified financial advisor before making any investment decisions.
Nepalytix and its contributors may hold positions in the securities discussed in this report at the time of publication or thereafter.
Neither Nepalytix nor any of its affiliates accept any liability for any loss arising from the use of this report or its contents.