Nepal’s Banks Report Strong Q4 Profits as Interest Income Falls
Nepal’s commercial banks posted their strongest profit growth in three years but much of the improvement came from provisioning, deferred tax and accounting adjustments rather than stronger cash earnings.
Nepali commercial banking reported its best profit growth in three years. Very little of it was cash and the market is not pricing the difference.
The sector's twenty Class A commercial banks hold Rs 7,405 arba of customer deposits against roughly Rs 4,943 arba of loans. A third of the deposit base is not lent. That surplus is the precondition for everything that follows.
Against it, the banks reported a strong year. Two posted profit growth above 300%. Nine of nineteen released loan-loss provisions in the fourth quarter. Return on equity improved at fourteen.
Read the filings and a different year appears. Interest income fell at nineteen of twenty banks. The largest single driver of profit at most of them was a provisioning line that moves on loan classification rather than on any estimate of loss and that line swung 165 percentage points of pre-tax profit between the most and least aggressive banks in the same quarter. At four banks, reported earnings are positive or near-positive while the legally distributable figure is negative. Common equity fell at fourteen of nineteen.
The question that matters this year is not who earned the most. It is whose earnings were real.
We build that ranking, stress-test it against five weighting schemes, and then price it. We also build a second index the market does not have, a measure of what each bank actually discloses and find it carries more information about earnings quality than the share price does.
What we found
1. The squeeze is a yield event and nothing a bank did changed it. Interest income fell across a 28-point spread in loan growth, at the cleanest credit book in the sector and the most damaged, at the bank that lent hardest and the one that stopped lending. Spread compressed at eighteen of nineteen.
2. The provisioning line is a classification output, not a loss estimate and three banks prove it. Nepal Bank, Machhapuchchhre and NIC ASIA disclose both the NRB Directive 2 provision and their own NFRS 9 model. The regulatory figure binds at all three by 86.7%, 62% and 45.5%, a range, not a constant which means the impairment line is not comparable across banks at all.
3. Reported EPS is not dividend capacity. Distributable profit per share runs from 10.7% of EPS to 103.7%. Four banks carry Rs 36.1bn of combined accumulated deficits and cannot legally pay a dividend.
4. Seven banks bought regulatory capital. All seven lost the core. Rs 16.5 arba of AT1 preference shares and Rs 6.0bn of Tier 2 debentures lifted headline ratios; CET-1 fell at every one. The four banks that raised common equity distributed nothing and three were legally barred from distributing at all.
5. The sector's earnings-quality tailwind reversed in unison. NRB strips interest booked but never collected. Last year it added to distributable profit almost everywhere; this year it subtracts at seventeen of nineteen.
6. A correction we are carrying publicly. The provision coverage ratio does not mean what the market reads it to mean and there is no 100% regulatory floor. Standard Chartered's Basel III disclosure separates the components: headline coverage 134.35%, actual cover of the impaired book 80.69%.
7. What a bank discloses predicts what it earned, better than its price does. Our disclosure index explains 11% of the variation in earnings quality across all twenty banks. The share price explains 6%, across eleven.
A sector that cannot deploy its funding
Rs 7,405 arba of deposits. Roughly Rs 4,943 arba of loans. A sector loan-to-deposit ratio near 67% against a 90% regulatory ceiling.
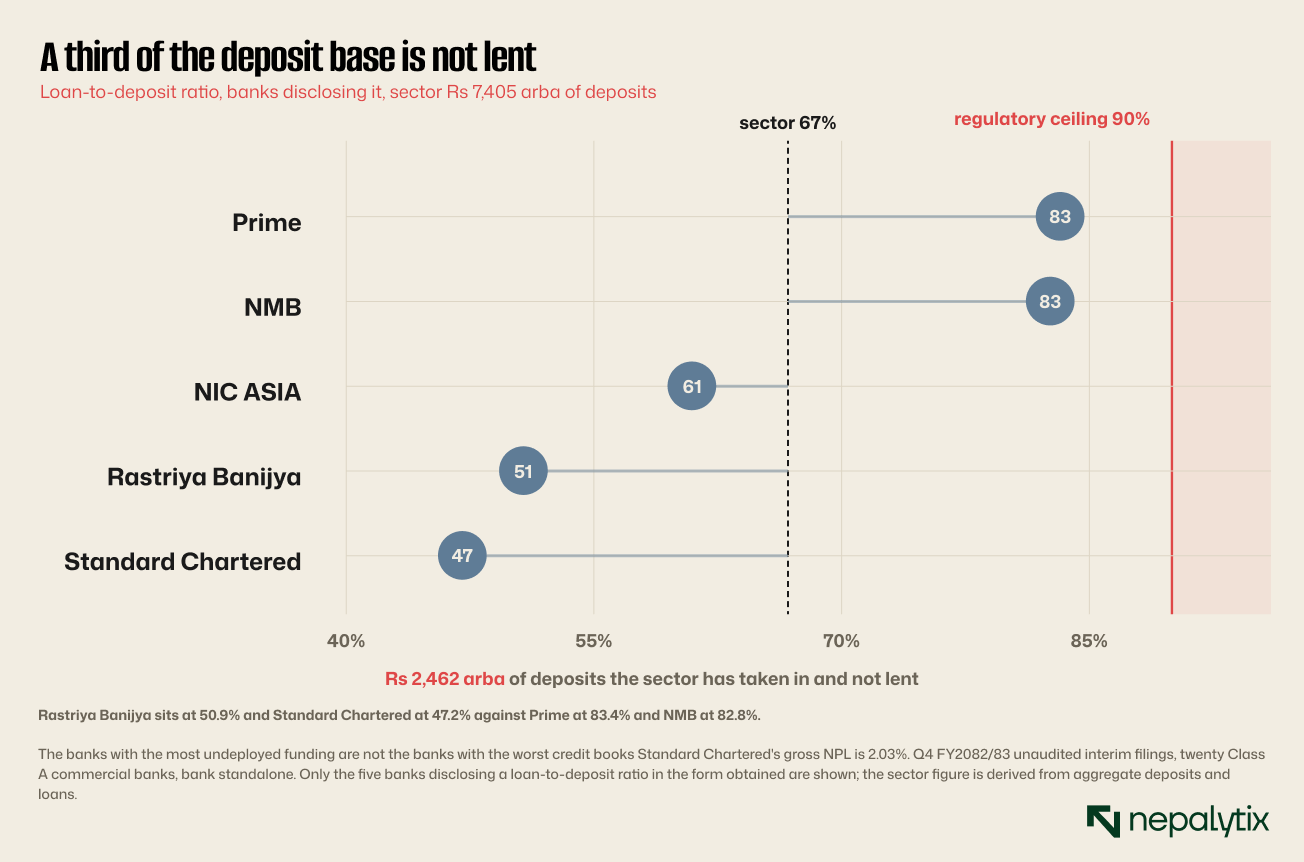
That last point is the first sign that the glut is a demand problem rather than a risk-appetite problem. It is also where this report connects to work we published on 6 August which argued that Nepal's credit drought is caused by idle industrial capacity and a blocked collateral channel rather than by anything banks decided.
Two banks absorbed the surplus in ways worth naming. Rastriya Banijya took in Rs 185.7bn of deposits in a single year, a 37.1% increase and lent Rs 39.7bn of it putting Rs 144.5bn into securities and nearly doubling its investment book. NIC ASIA went the other way: its loan book shrank Rs 26.4bn and it parked Rs 91bn at the central bank, 23.1% of total assets.
Neither is disclosed with any commentary. At Rastriya Banijya, a wholly state-owned bank whose deposit base grew a third in twelve months, the composition and stickiness of that inflow is the single most important undisclosed fact in the sector.
Why a glut is not the same as caution
The distinction matters because the two have opposite implications for what happens next.
A cautious bank is holding back deliberately. It has borrowers it could lend to and is choosing not to usually because it expects credit conditions to worsen. When its view changes, the money is deployed and earnings recover quickly.
A bank in a glut has no such option. The deposits arrive whether or not there is anything to do with them and the alternatives government securities, placements at the central bank, interbank lending, all yield less than a loan. Its earnings do not recover on a change of view. They recover when borrowers reappear.
The evidence in these filings points to the second. Standard Chartered runs the cleanest book in the sector at 2.03% gross NPL and deploys the least. Rastriya Banijya took in Rs 185.7bn and put Rs 144.5bn into securities. Neither looks like a bank rationing credit to protect itself.
What that means for the year ahead is that the sector's revenue problem is not in its own hands, and the levers most often discussed: pricing, risk appetite, branch expansion do not reach it.
A yield event, not a lending event
Interest income fell at nineteen of twenty banks. The exception proves the mechanism: Rastriya Banijya's earning asset base grew roughly a third while interest income grew 7.5%, which means its implied yield fell about 104 basis points in line with everyone else. It outran the squeeze on volume, not on price.
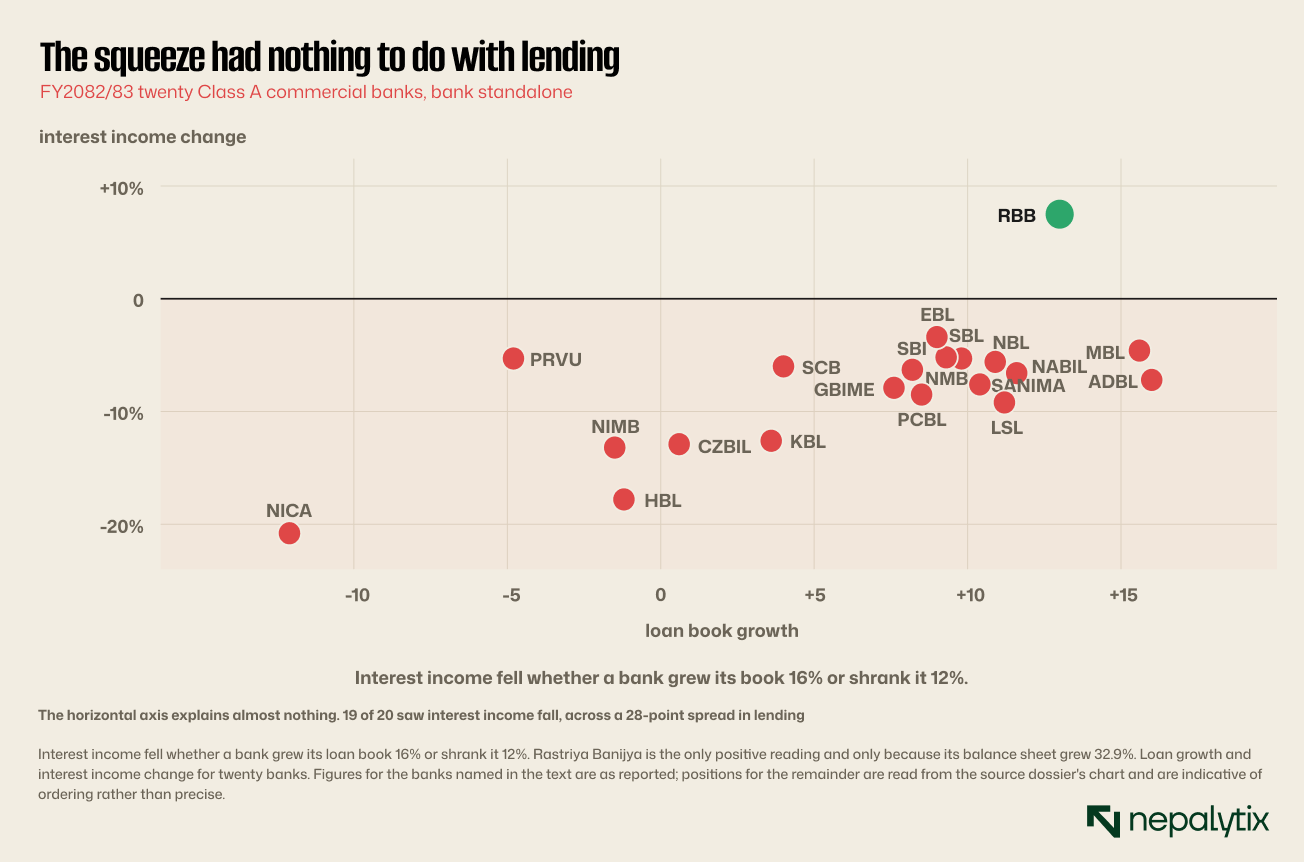
Three pairings isolate the variables a reader would expect to matter. All three come back negative.
Credit quality does not explain it. Everest carries the cleanest book at 0.49% gross NPL; interest income fell 3.4%. Himalayan carries 7.96%; interest income fell 17.8%.
Deployment does not explain it. Nepal SBI grew loans faster than deposits and let its securities book shrink, the only bank to do so and interest income fell 6.3%. NIC ASIA shrank its loan book 12.1%; interest income fell 20.8%.
Spread does not explain it. Prime held spread compression to three basis points while running the sector's highest credit-to-deposit ratio and lowest liquidity ratio. Interest income fell 8.5%.
What varied was how much each bank clawed back on funding. Prabhu entered the year paying 69 paisa of interest for every rupee earned, the most expensive funding structure in the sector and its net interest income rose 28.7% on repricing alone while its loan book shrank 4.8%. That is a windfall on an expensive liability base, not a franchise improvement. Net interest income outcomes range from −22.6% to +28.7% while interest income fell almost everywhere. The variance is a funding-mix artefact.
The fourth quarter is where this turns
Funding relief broke in four directions across four banks. NIC ASIA's decelerated from −22.9% to −8.5% and fourth-quarter net interest income collapsed 29.1%. Prime's accelerated from −13.7% to −21.3%. Rastriya Banijya's reversed outright, with interest expense rising 13.7% year on year in the quarter. Sanima held while the asset yield fell away, producing a 32-point intra-year swing.
Deposit repricing is close to exhausted at the banks that have already taken it, and cost of funds below 3% leaves nothing left to give.
The impairment line is not a credit signal
Ten banks charged impairment in the fourth quarter. Nine released.
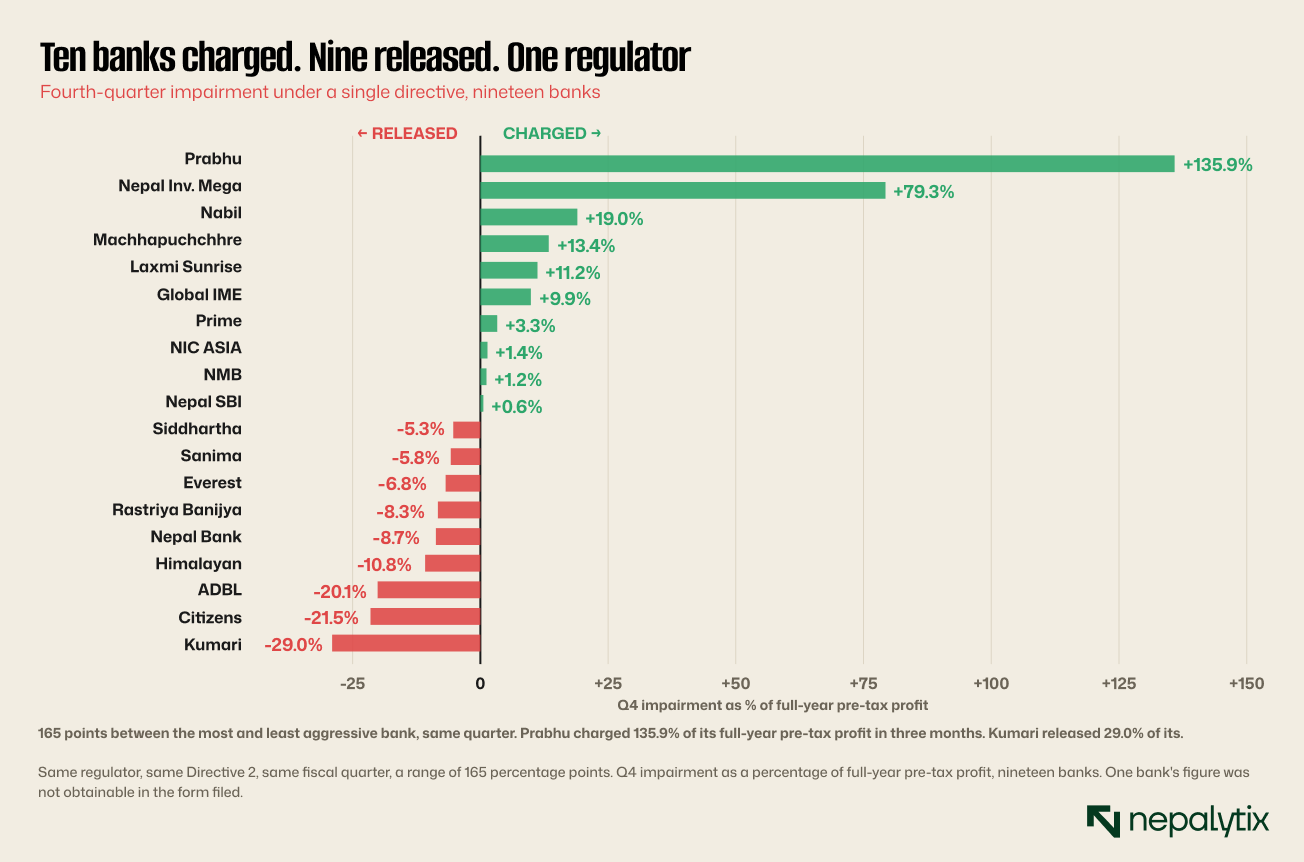
That dispersion is not a credit signal because the credit books do not disperse that way. It is a classification signal, loans migrating between NRB buckets each carrying a fixed provision rate.
Three banks let us prove it
Banks must hold the higher of the NRB Directive 2 provision and their own NFRS 9 expected credit loss model. At all three that disclose both, the regulatory figure binds.
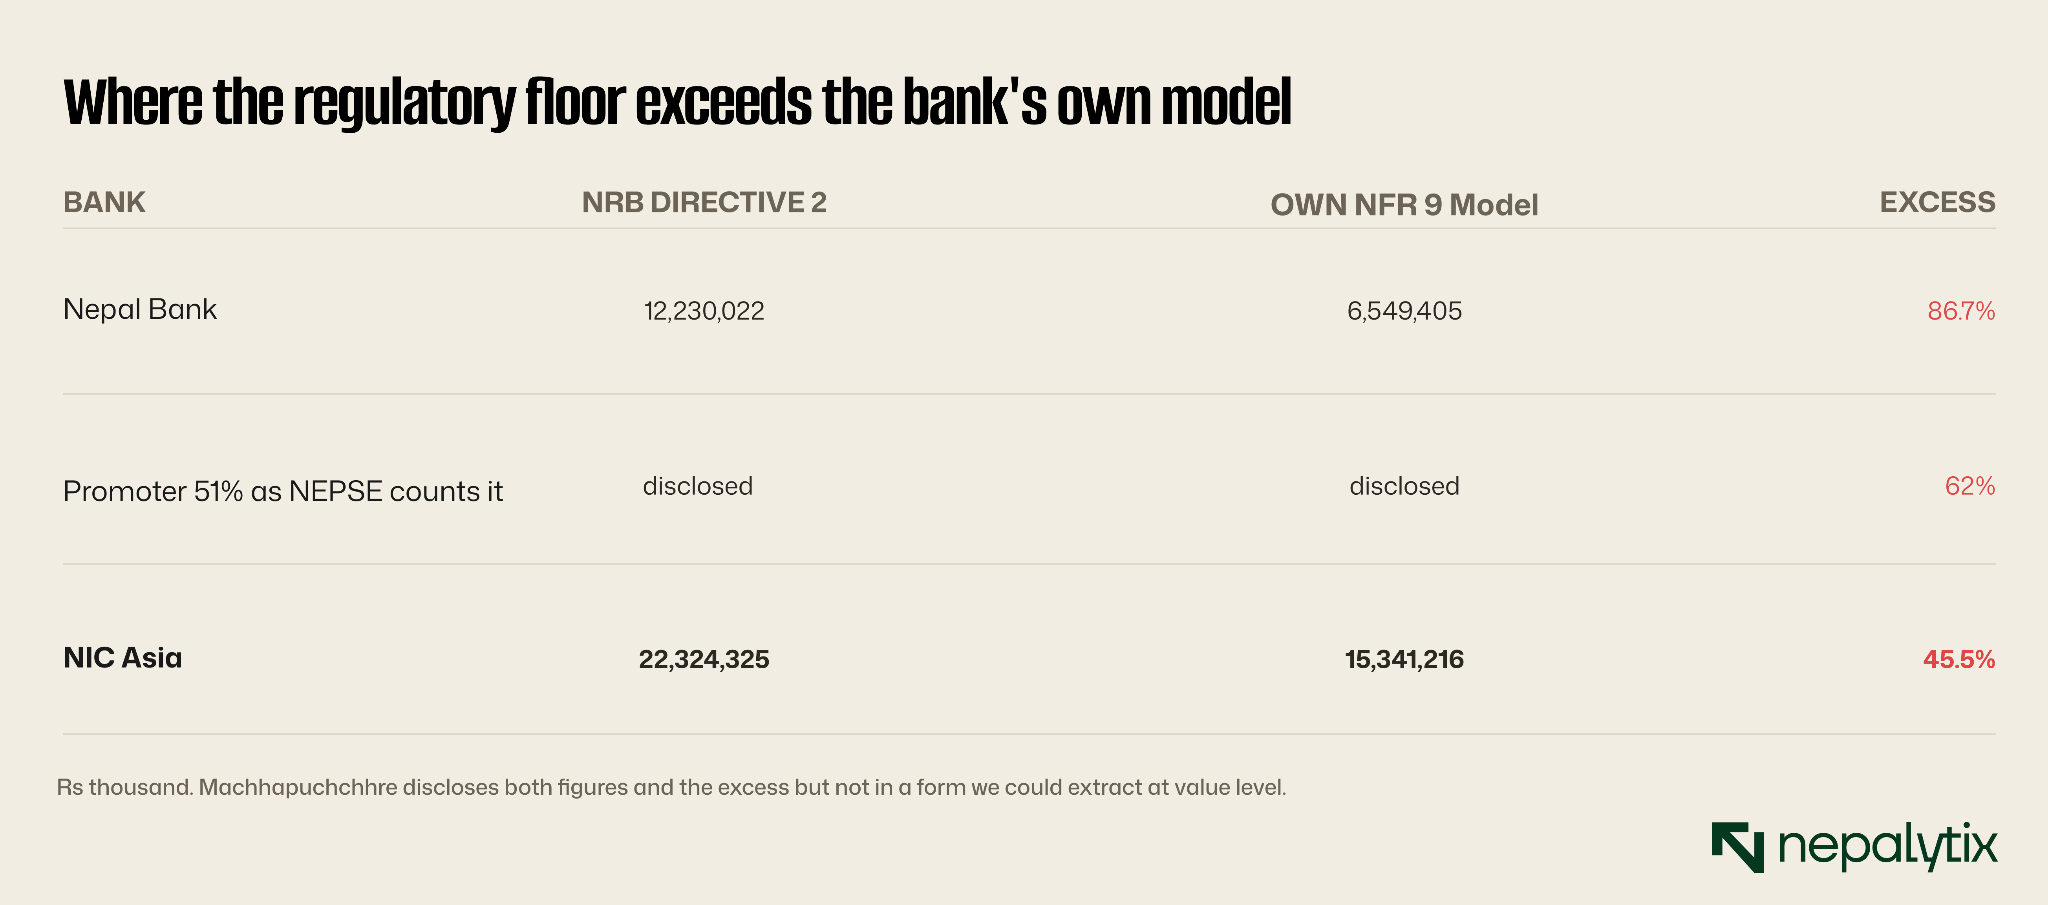
The variation matters more than the direction. If the gap were a constant multiple, the regulatory provision could be read as a scaled proxy for economic loss. It is not, it ranges from roughly 1.46× to 1.87× the bank's own model.
Nepal Bank is the sharpest case. Its regulatory requirement exceeds its own worst-case-weighted model by Rs 5.68bn, more than its entire pre-tax profit. Its staging table implies it expects to recover roughly 64% of its non-performing book; the regulator requires it to provide as though it will recover almost none.
Seventeen of twenty banks state the higher-of methodology and withhold both figures. Sanima's impairment note is the most methodologically complete in the sector segmentation, staging, PD, LGD and EAD, a 2.5% floor PD and a 45% minimum LGD and it still gives neither number.
What a classification-driven provision does to comparability
Directive 2 assigns a provision rate to each loan classification: pass, watchlist, substandard, doubtful and loss. A loan moving from one bucket to the next carries a fixed step-up in provision regardless of what the bank expects to recover on it.
Two consequences follow and both undermine cross-bank comparison.
The first is that a bank's impairment charge is driven by migration rather than by deterioration. A portfolio can worsen materially without any loan crossing a bucket boundary, producing no charge. A portfolio can stabilise while loans that deteriorated last year complete their migration, producing a large charge. The line moves on the calendar of classification, not on economics.
The second is that release is as mechanical as charge. A loan that is upgraded through restructuring, through partial repayment or through the passage of time under a rescheduling releases its provision in full. Kumari released Rs 3.0bn in the fourth quarter while its gross NPL rose 51 basis points, which is arithmetically possible only if the composition of its non-performing book changed favourably even as its size grew.
Neither of those is misconduct. Both mean that comparing impairment charges across banks tells you about their classification calendars rather than about their credit.
What "coverage" actually measures
The market reads provision coverage as cover against bad loans and treats 100% as a regulatory floor. Both readings are wrong, and we were carrying the error ourselves until this quarter's Standard Chartered disclosure forced the correction.
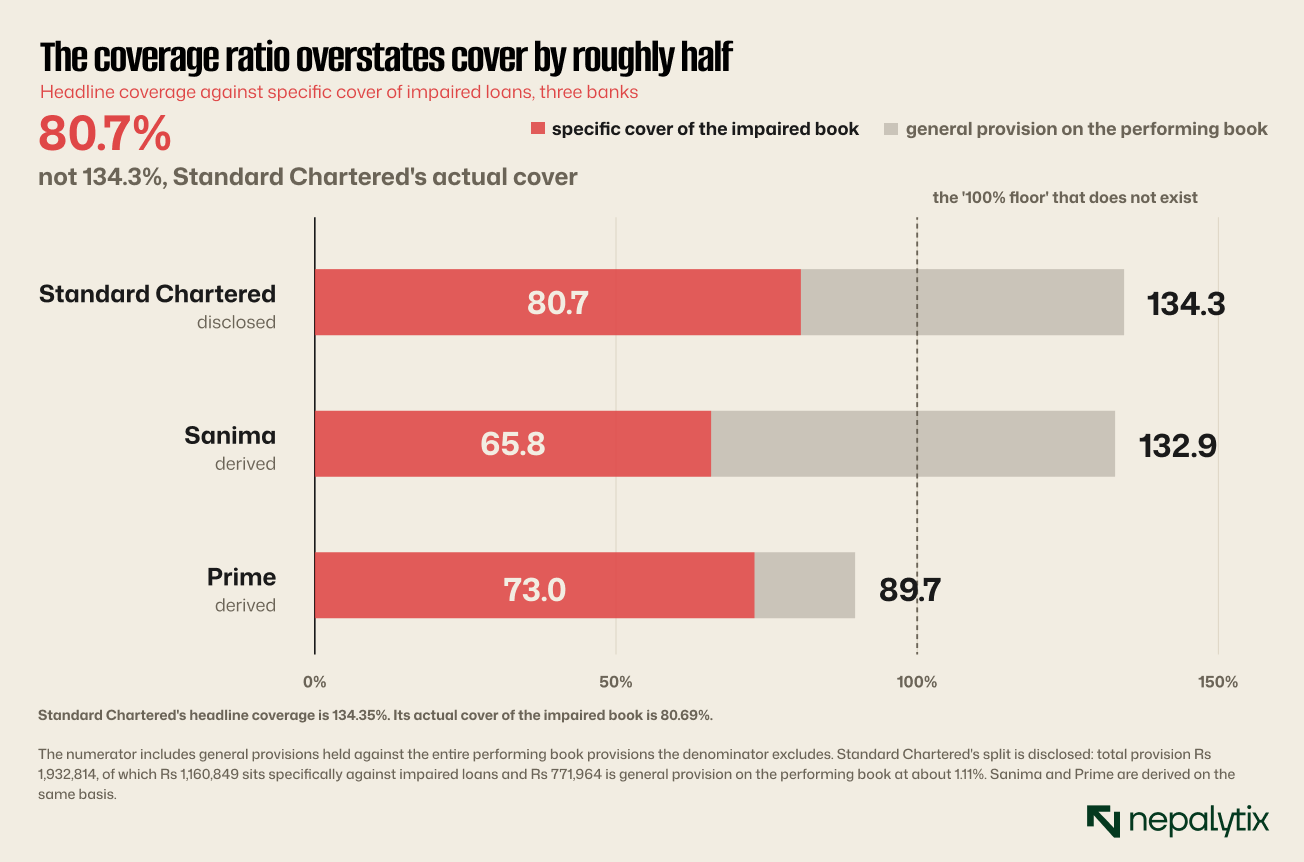
Standard Chartered's classification table shows Directive 2 working as written: loss loans provided at 100.00%, doubtful at 50.00%, substandard at 27.13%. Nothing requires provisions equal to 100% of all non-performing loans.
Sanima corroborates. It reports 132.86% coverage and 1.02% net NPL simultaneously which is arithmetically impossible if coverage meant cover of the impaired book.
Two banks finished below 100%, Prabhu at 69.27% and Prime at 89.70% and neither is in breach. But Prabhu's position is genuinely the sector's worst on the measure that matters: net NPL of 6.21%, more than four times the next-highest bank, on a book where gross NPL rose 854 basis points and implied bad loans more than doubled.
Specific cover of the impaired book is disclosed in the Basel III template for every bank. Almost nobody reads it. We would.
Earnings that cannot be paid
NRB requires four strip-outs before anything can be distributed: interest booked but not collected, shortfalls against repossessed property, deferred tax assets recognised in the profit and loss account and actuarial losses. What survives is the only number a shareholder can be paid from.
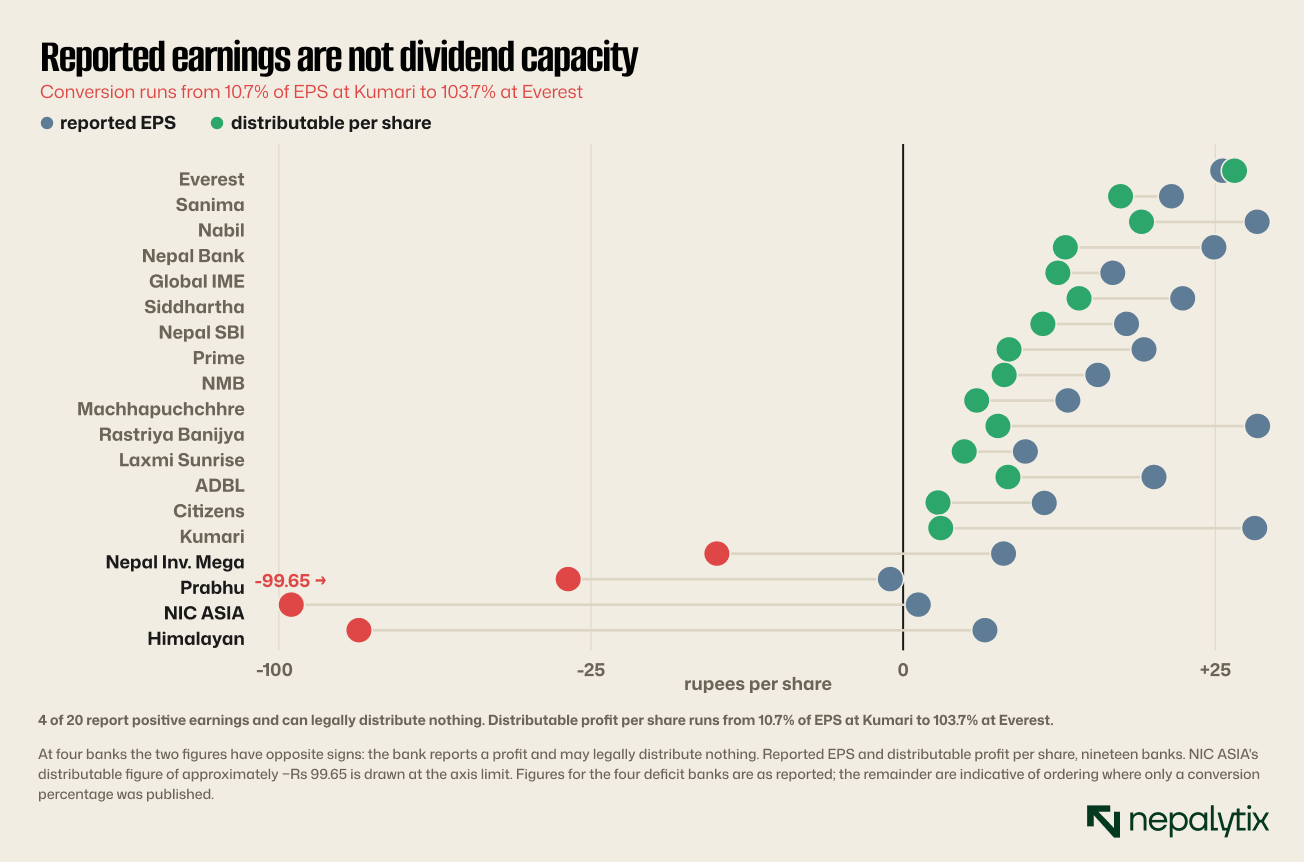
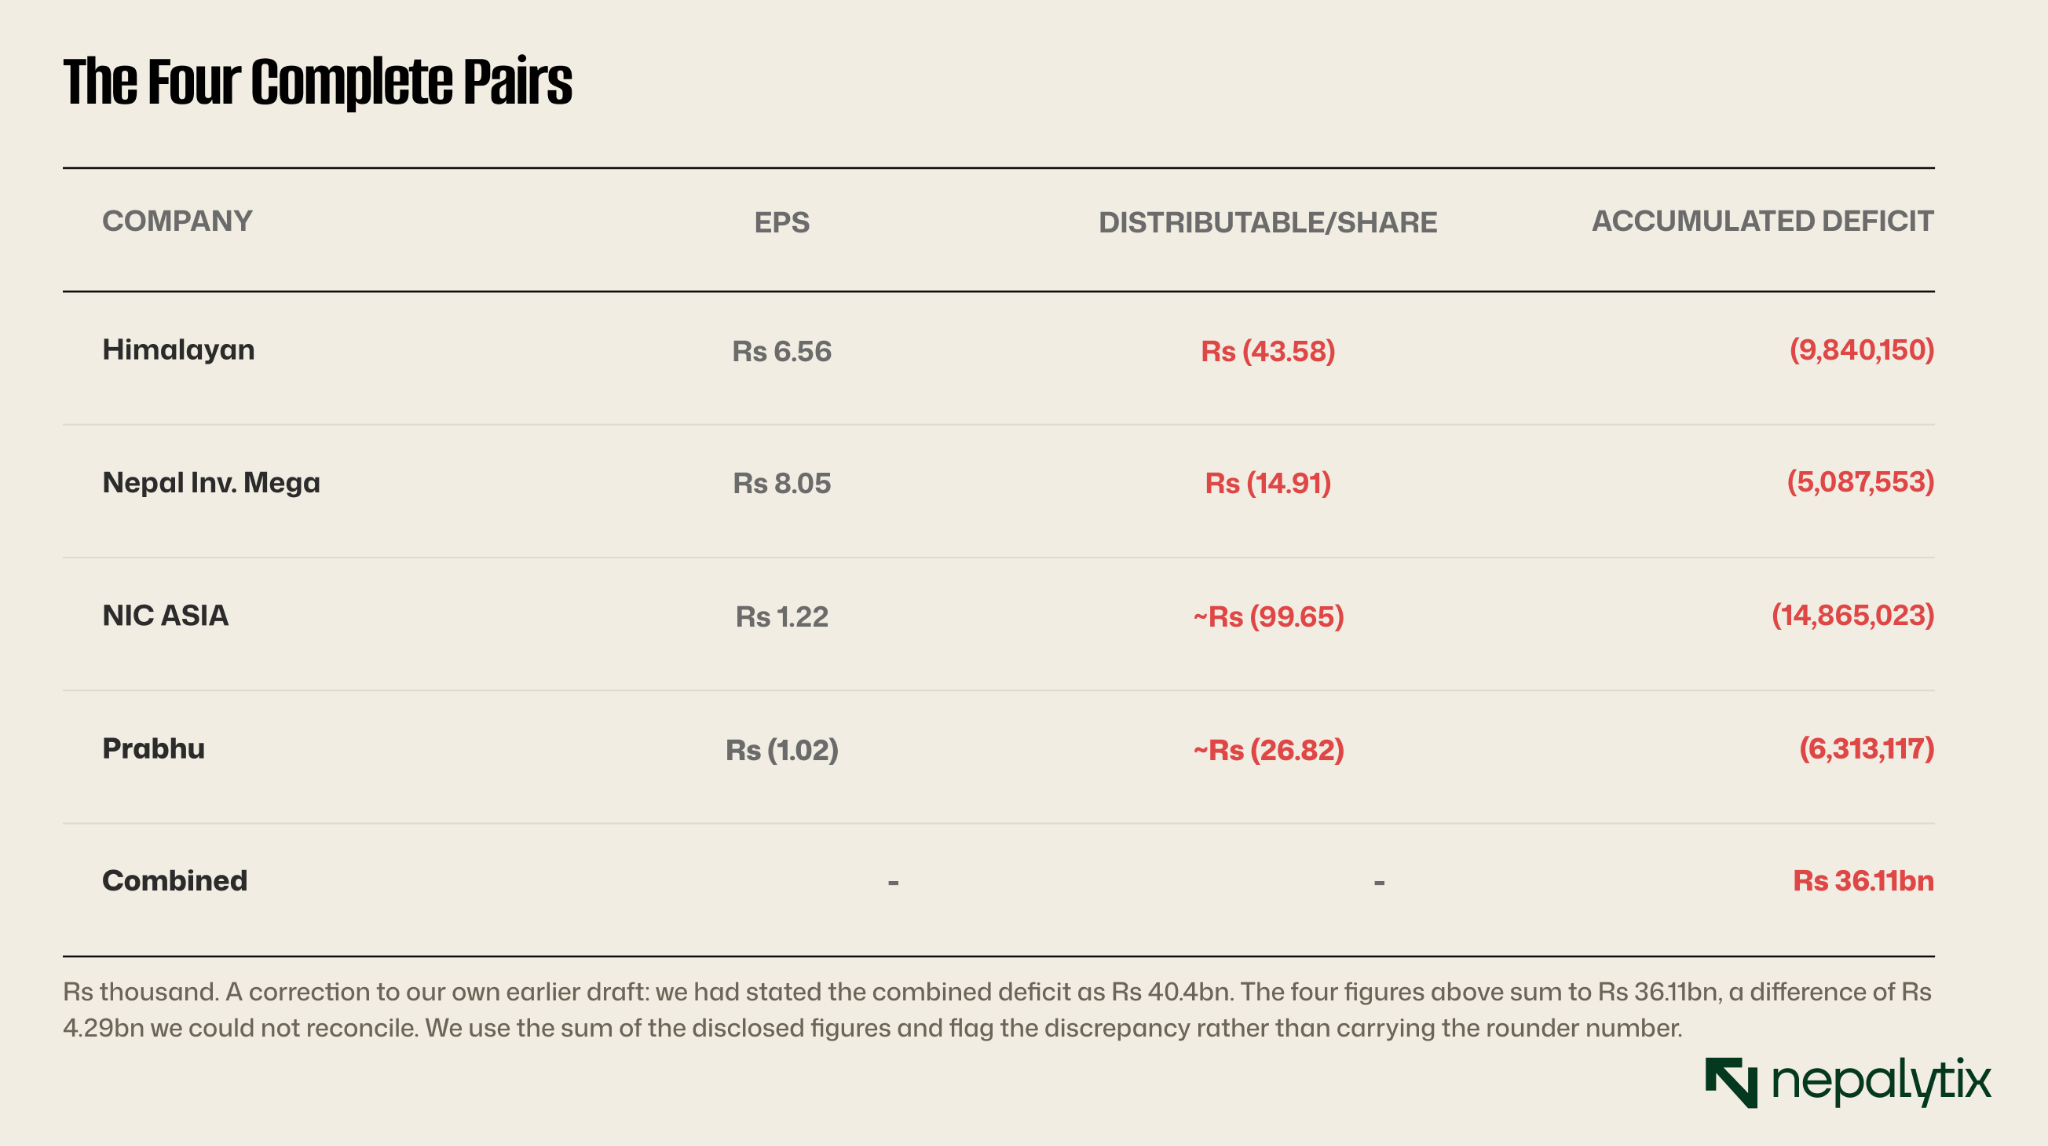
None of these four can legally pay a dividend, and three deepened the deficit this year.
Two claims that rank ahead of ordinary shareholders
The debenture redemption reserve is a fixed annual appropriation that recurs regardless of performance. It took 897% of net profit at NIC ASIA, 40.6% at Nepal Investment Mega and 21.0% at Sanima. Standard Chartered's disclosure gives the benchmark rate: Rs 1,920,000 accumulated against a Rs 2.4bn issue over four years, or 20% of face value a year. That benchmark exposes an anomaly. Prime carries Rs 12.17bn of debentures and appropriates nothing. At the standard rate the charge would exceed Rs 1bn annually roughly 25% of net profit cutting its conversion from 44.0% to nearer 20%. Sanima's note 5.19 supplies the one legitimate exemption; Prime issued a bonus but not on that stated basis. Until explained, Prime's distributable figure is not comparable to its peers'.
AT1 dividends. Five banks now carry perpetual preference dividends ranking ahead of ordinary shareholders in perpetuity: Rs 400,000 a year at Nabil, Rs 247,500 at NMB and Machhapuchchhre, Rs 165,000 at Sanima.
Why the four strip-outs exist
Each of NRB's four adjustments removes a specific way in which accounting profit can exceed cash available to shareholders, and they are worth understanding individually because they behave differently.
Interest booked but not collected. Under accrual accounting a bank recognises interest as it is earned, whether or not the borrower pays. On a deteriorating book that produces income that may never arrive. This is the largest adjustment in the sector this year and the subject of the next section.
Shortfalls against repossessed property. Where a bank takes collateral in settlement and carries it at a value above what it would fetch, the difference is unrealised. Investment property balances rose sharply across the sector this year.
Deferred tax assets in the profit and loss account. A deferred tax asset only has value if the bank earns future taxable profit against which the deduction can be claimed. Recognising it as income today and paying a dividend out of it distributes a benefit that has not been received.
Actuarial losses. Movements in the valuation of employee benefit obligations that have not passed through the income statement. Taken together, the four convert a reported profit into the amount a regulator will permit a bank to hand out. That the conversion runs from 10.7% to 103.7% across a single sector in a single year is the clearest available evidence that reported profit and shareholder profit are different quantities here.
The tailwind that reversed
The interest-receivable adjustment is the closest thing in these filings to a direct earnings-quality reading: the regulator removing income booked but never collected.
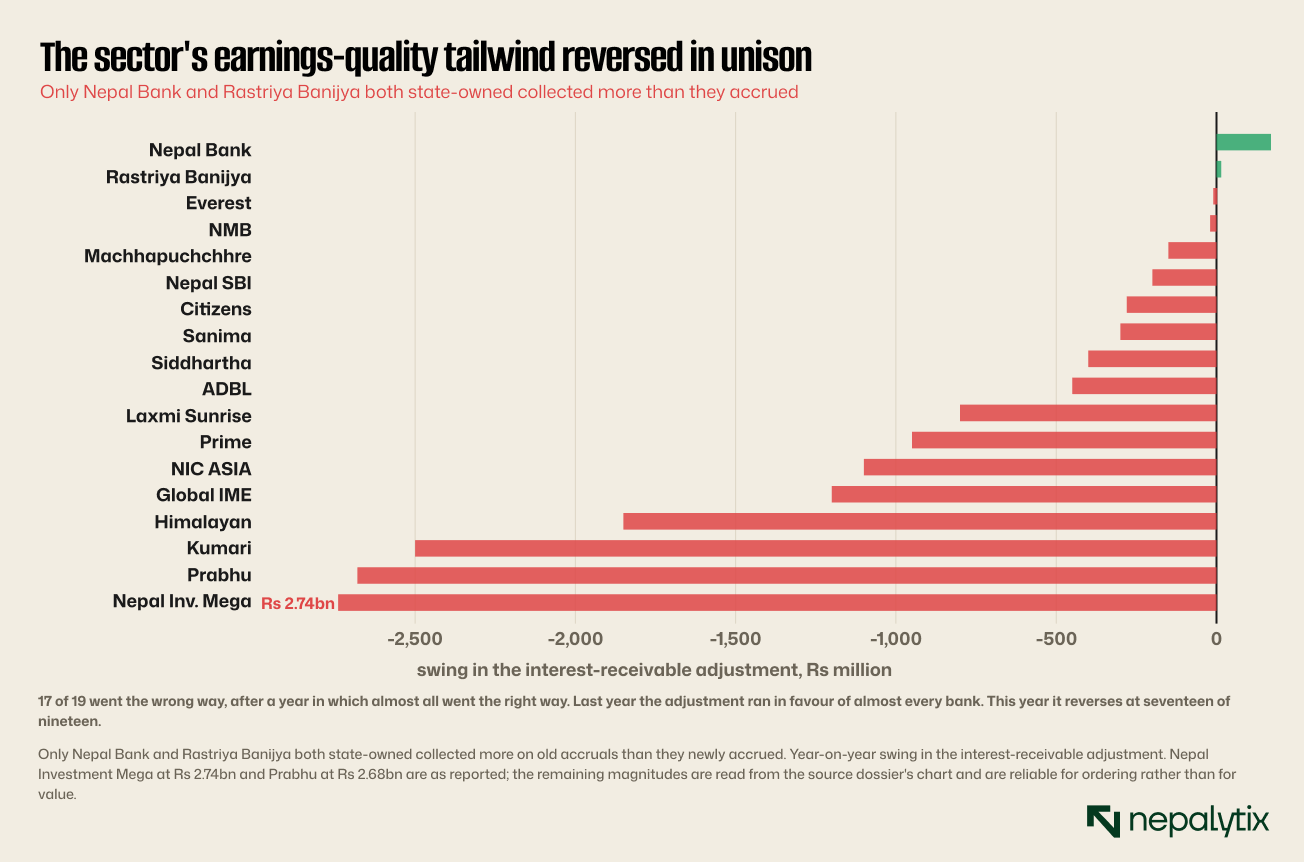
The swings move the distributable line on their own. At Prabhu, that single reversal accounts for roughly 71% of the deterioration in available-for-distribution.
Two banks give the corroborating cash figure. NIC ASIA's cash interest received fell 35.4% against accrued interest income down 20.8%, a nine-point gap. Sanima's fell 9.2% against 8.0%, a gap of one point. Sanima also discloses Rs 662.93 million of unrecognised Stage 3 interest income, the only bank in twenty to quantify what it declined to book.
Capital: what was bought, and what was kept
Seven banks raised non-core regulatory capital: Rs 16.5 arba of AT1 across five, Rs 6.0bn of Tier 2 across two. CET-1 fell at all seven.
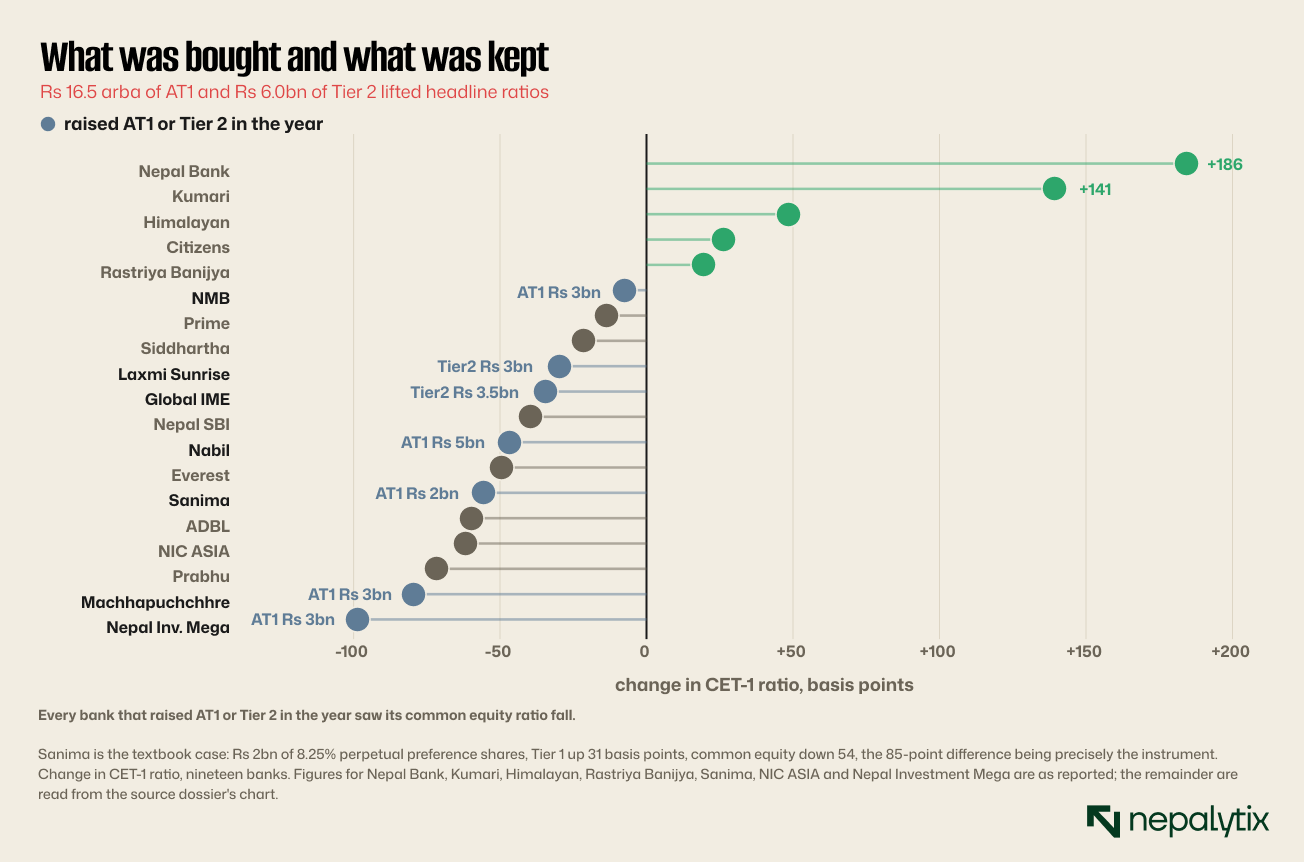
Four banks raised CET-1: Nepal Bank at +186 basis points, Kumari +141, Himalayan +50 and Rastriya Banijya +21. None distributed anything, and three were carrying deficits that made distribution legally impossible.
The finding is not that discipline was rewarded. It is that the banks legally barred from paying were the ones that accumulated capital.
Two banks lost common equity while shrinking their books and paying nothing, Nepal Investment Mega at −97 basis points and NIC ASIA at −60. The common factor is the deferred tax asset, deducted from core capital because an asset that only has value if the bank earns future taxable profit is not loss-absorbing.
The tails are extreme. NIC ASIA runs CET-1 of 6.27% with Tier 2 carrying 43.5% of total capital, clearing the buffer-inclusive requirement by ten basis points. Standard Chartered runs 16.68% higher than any peer's total capital ratio with no AT1 and deductions of nil.
The instrument that flatters and the instrument that does not
AT1 preference shares and CET-1 are both capital and the market reads both through the same total capital ratio. They behave completely differently when a bank loses money.
Common equity absorbs losses first and absorbs them fully. There is no coupon, no maturity and no ranking above ordinary shareholders. It is the only layer that does what capital is supposed to do without qualification.
AT1 preference shares carry a perpetual dividend that ranks ahead of ordinary holders. They count toward Tier 1 and therefore lift the headline ratio and in Nepal they are being issued at 8% to 8.25%. A bank that funds itself this way has bought regulatory compliance and sold a permanent first claim on its earnings.
Sanima's disclosure makes the mechanics visible: Rs 2bn of 8.25% perpetual preference shares lifted Tier 1 by 31 basis points while common equity fell 54. The 85-point gap is the instrument and it is the difference between a bank that looks better capitalised and one that is.
Five banks now carry these. The annual dividends are individually small Rs 400,000 at Nabil, Rs 165,000 at Sanima but they are perpetual, they rank ahead of ordinary shareholders and they do not stop when a bank stops earning.
Two wedges separate reported profit from cash
The first wedge is deferred tax. It is not cash; it is recognition of a future deduction the tax authority has not allowed. At NIC ASIA the credit is 661% of reported net profit, strip it and the year is a Rs 1.02bn loss rather than a Rs 182m profit. At Nepal Investment Mega it is 66.1%, at Himalayan 66.1%, at Sanima 1.4%. Siddhartha and Everest book none at all.
Rastriya Banijya sits at the opposite pole. It carries a deferred tax liability that is unwinding, so the deferred line is a charge worth 17.5% of net profit. Its reported profit is understated by the mechanism that overstates others.
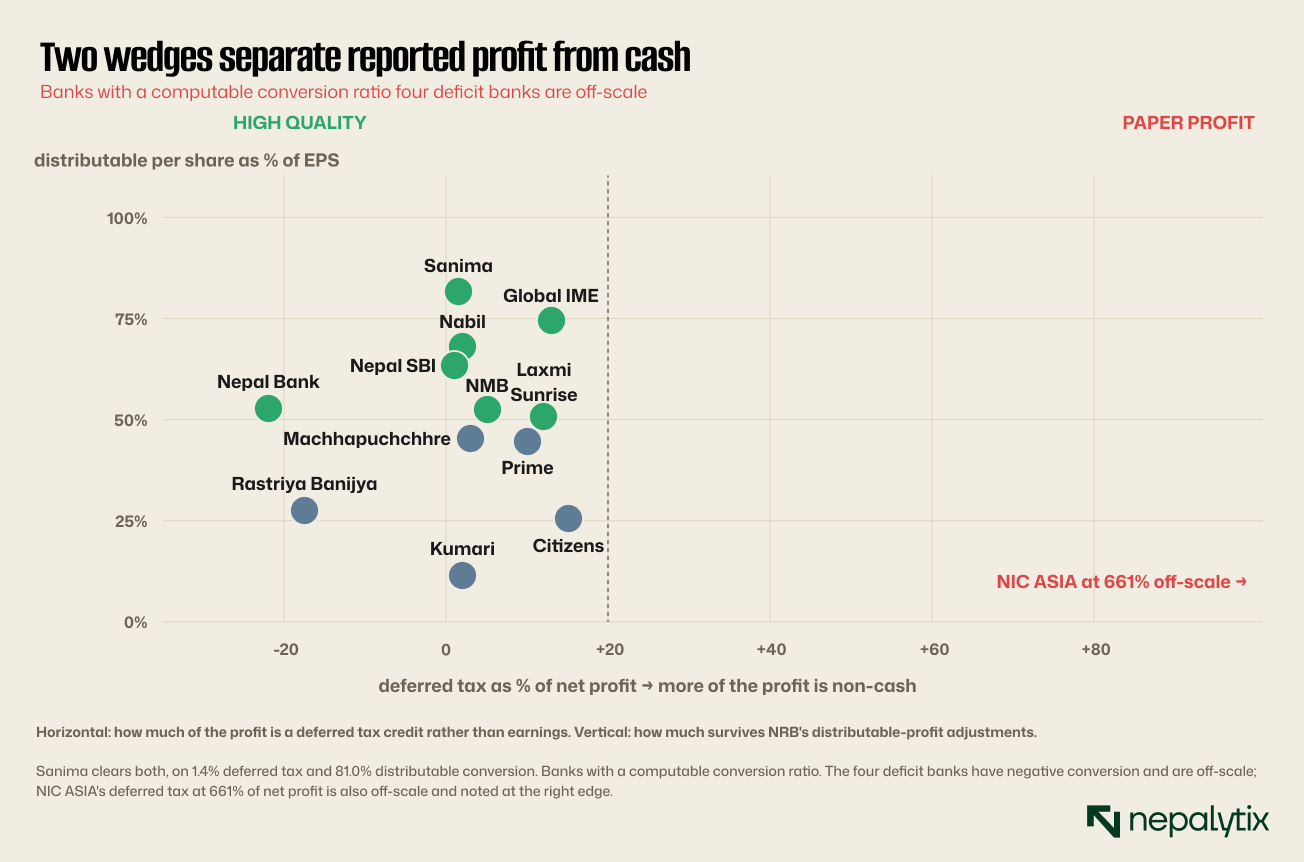
The second wedge is the regulatory strip-out. Net regulatory adjustment as a percentage of net profit runs from 6.0% at Sanima to figures exceeding 100% at the deficit banks.
Prabhu is where both wedges and the tax line combine. Its operations produced Rs 1.60bn of pre-tax profit. Current tax was Rs 2.31bn — 144.7% of it because Directive 2 provisions are not deductible in the year booked. It did not have an operating loss. It had a pre-tax profit that non-deductible provisioning and cash tax turned negative.
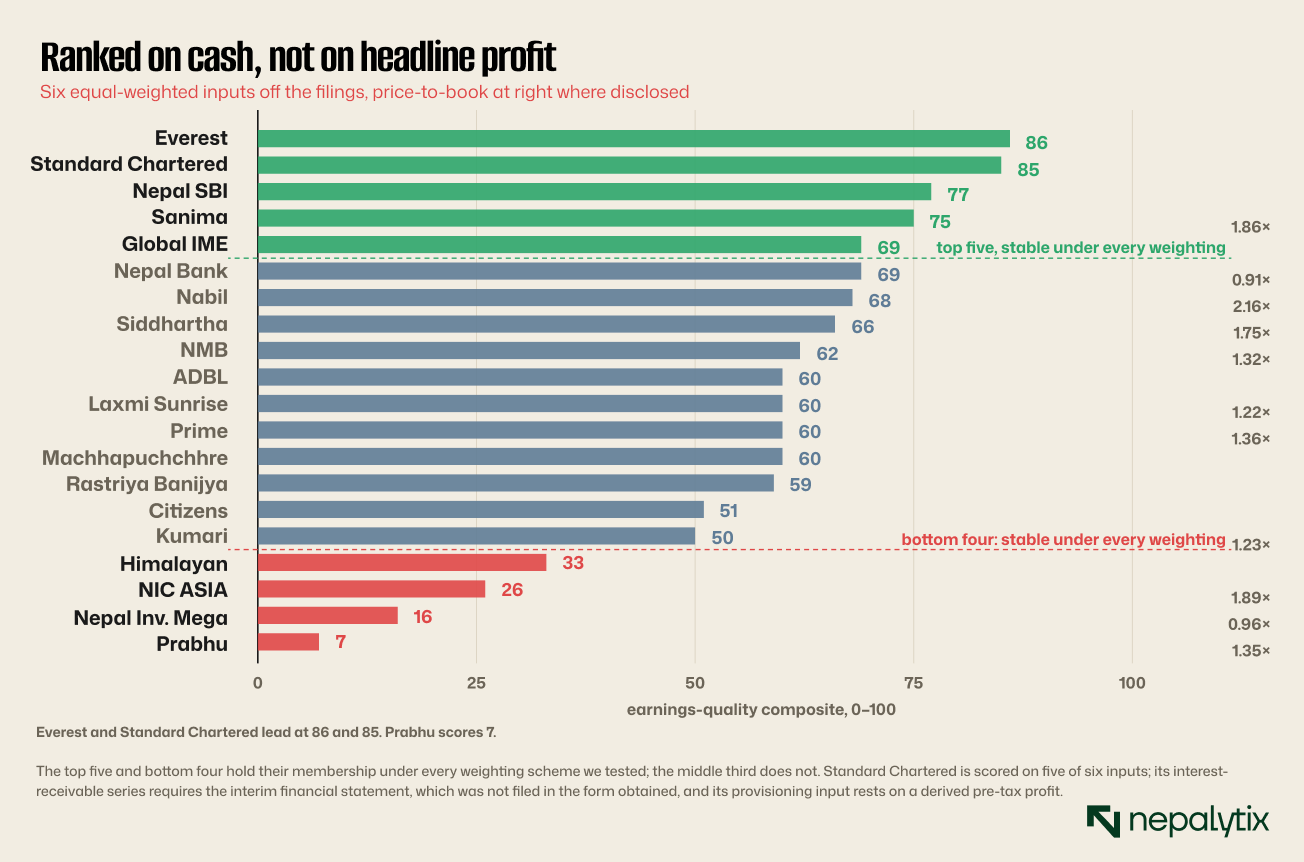
Six equal-weighted inputs, each taken off the filings and capped 0–100: distributable conversion, deferred-tax independence, provisioning stability, credit cover, common equity and the interest-receivable swing.
How much to trust it
This is our construct, not a disclosed metric and the honest question is how much the ranking depends on our choices.
We ran it under five weighting schemes: equal weights; payability doubled; credit doubled; deferred tax dropped entirely and a three-input core using only conversion, cover and common equity.
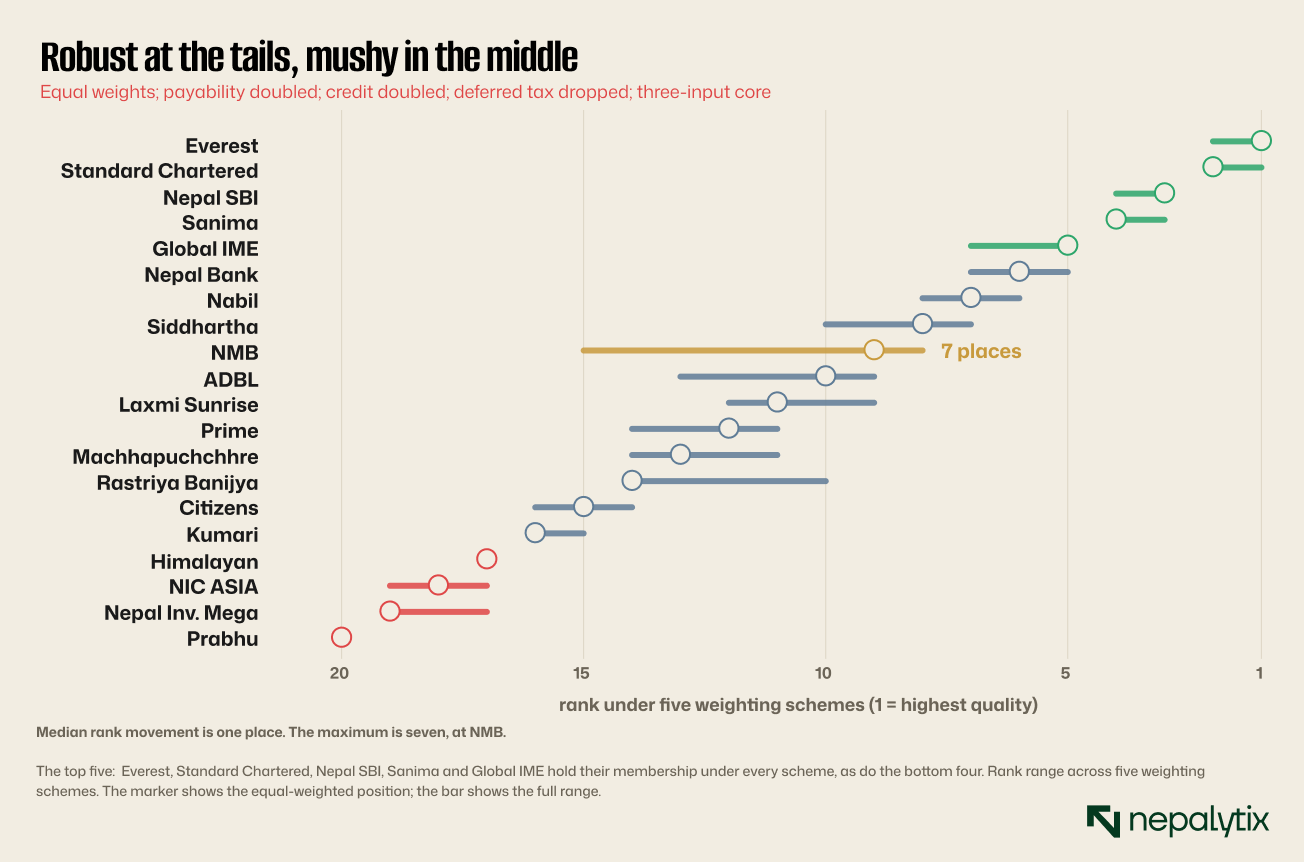
Read the articles, not the ordinals. Positions 9 through 14 are separated by roughly one point of composite score and should not be treated as a ranking at all.
What the construct does robustly is separate banks whose reported profit is cash from banks whose reported profit is an accounting outcome. On that narrow question it does not move.
The inversion
Reported profit growth and earnings quality are close to unrelated and at the extremes they invert.
Kumari reported +306% profit growth and the sector's highest return on equity at 16.49%. It released Rs 3.0bn of provisions in the fourth quarter — 29.0% of full-year pre-tax profit while its gross NPL rose 51 basis points to 7.46% and net NPL nearly tripled. Its distributable profit per share is Rs 3.02 against EPS of Rs 28.17: a 10.7% conversion, the lowest in the sector. It ranks 16th of 20.
Himalayan reported +1041% growth off a near-zero base, carries a deferred tax credit worth 66.1% of net profit and has an accumulated deficit of Rs 9.84bn. It ranks 17th.
Meanwhile Nepal SBI grew profit 12.9% and ranks 3rd, the only bank that grew loans faster than deposits with bad loans falling 5.3% in absolute terms and 145.74% coverage.
Sanima grew 38.0% and ranks 4th, on a 30.5% cash tax rate, a 1.4% deferred credit, an improving NPL ratio and 81.0% distributable conversion.
What the six inputs measure and what they do not
Each input answers one question about whether reported profit converts to cash and each is taken directly off the filings rather than modelled.
Distributable conversion is distributable profit per share over reported EPS. It answers: how much of what was reported may legally be paid out.
Deferred-tax independence penalises profit that is a deferred tax credit rather than earnings. It answers: how much of the profit is a claim on future taxable income.
Provisioning stability penalises large fourth-quarter swings in either direction. It answers: how much of the annual result was decided in the final three months.
Credit cover uses specific cover of the impaired book where derivable, not the headline coverage ratio. It answers: how much of the bad book is actually provided against.
Common equity measures the change in CET-1, not total capital. It answers: did the loss-absorbing layer grow.
The interest-receivable swing measures the year-on-year movement in the regulator's strip-out of uncollected income. It answers: is the bank collecting what it books.
What none of these measures is franchise quality, management, deposit stability or whether a bank is cheap. A bank can score well here and be a poor investment; a bank can score badly and be a good one. The composite answers one narrow question and should not be asked to answer others.
What the market pays
Eleven of twenty banks disclose a quarter-end price. Against our composite, earnings quality explains about 6% of the variation in price-to-book weakly positive and not meaningful at eleven observations.
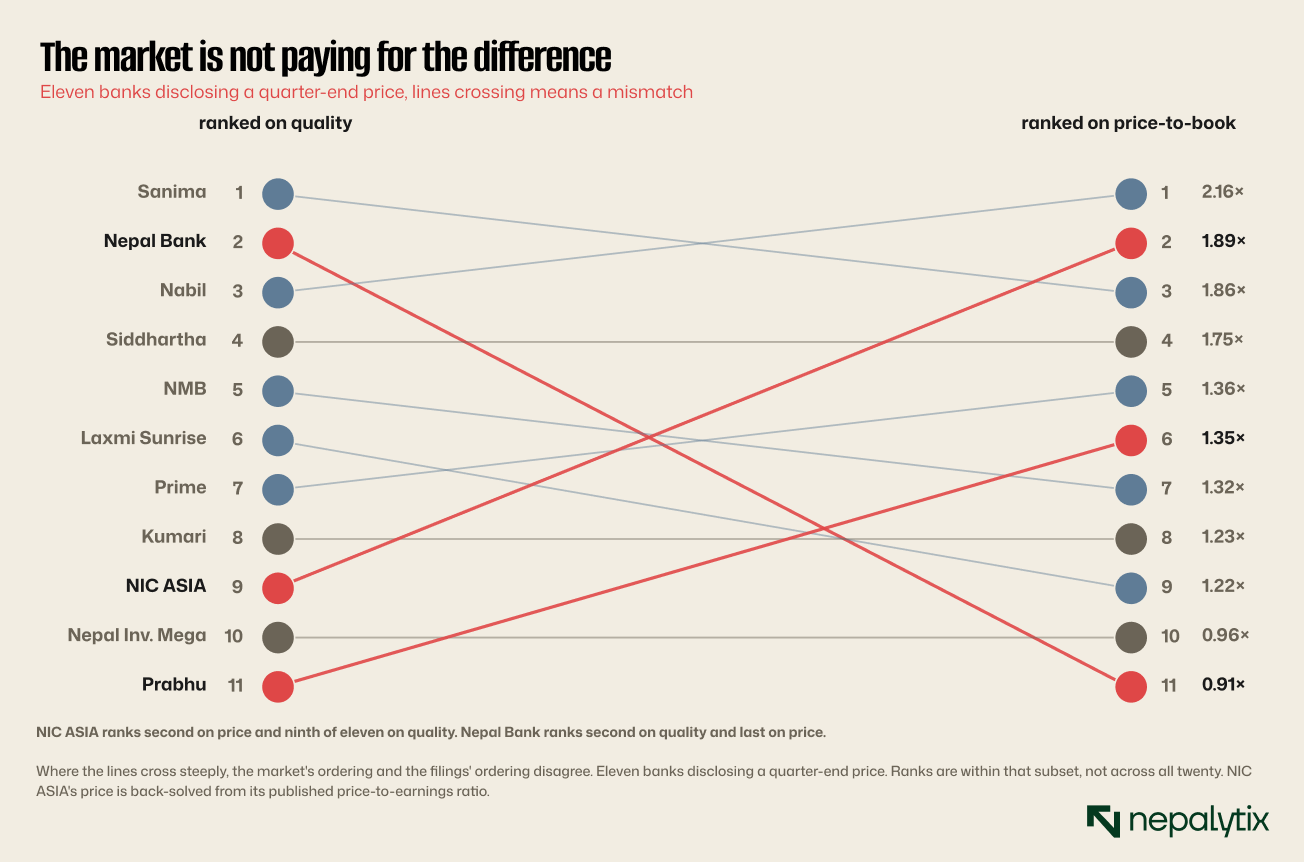
Some of the pricing is coherent. Nabil at 2.16× book ranks 7th of 20 on quality; Sanima at 1.86× ranks 4th. Both are defensible.
Two are not.
NIC ASIA trades at 1.89× book and ranks 18th of 20. Its reported profit is 661% deferred tax; strip it and the year is a Rs 1.02bn loss. Its CET-1 is 6.27%, three points below any peer. Its accumulated deficit is Rs 14.87bn and it cannot pay a dividend. Its price-to-earnings ratio, on the sector compilation, is 266.90×.
Nepal Bank trades at 0.91× book and ranks 6th. It has the highest net worth per share in the sector at Rs 287.70, the largest CET-1 gain at +186 basis points, a cleared deficit, an NPL stock flat in rupee terms, and one of only two interest-receivable adjustments running in the bank's favour.
Nepal Investment Mega at 0.96× book ranks 19th cheap on book and the second-worst quality score in the sector, which is a different proposition entirely.
We are not making a recommendation. The observation is narrower and, we think, harder to argue with: the price a Nepali bank trades at this quarter carries very little information about whether its reported earnings were real.
What a bank tells you predicts what it earned
The section above establishes that price is close to uninformative about earnings quality. That raises an obvious question: is anything informative?
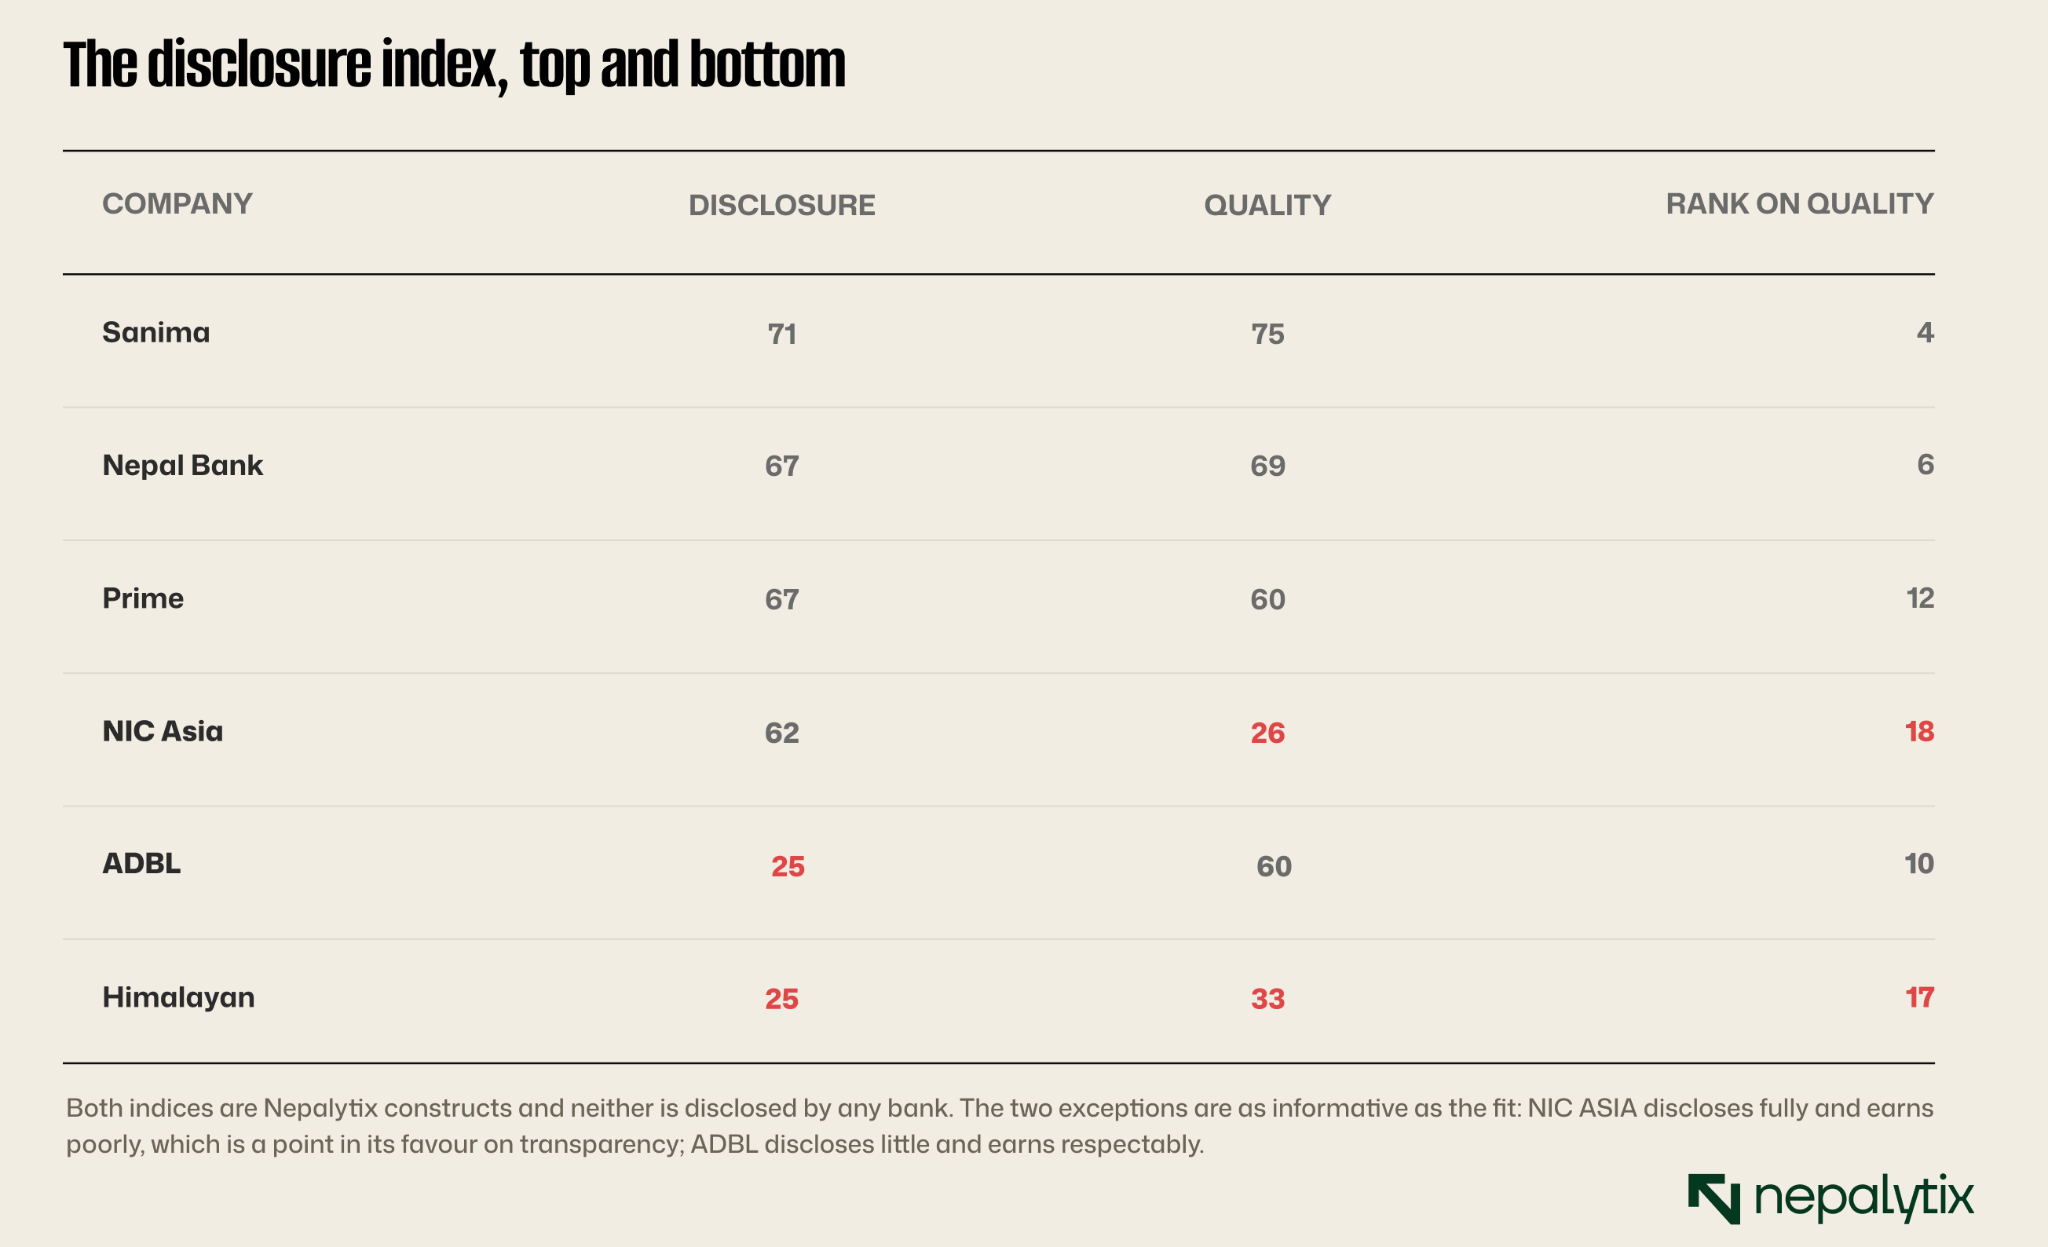
We built a second index to test one candidate. It scores each bank on what its filing actually contains, the form of the filing itself, whether it publishes both provision figures, whether it decomposes its coverage ratio whether it discloses restructured balances, whether it quantifies unrecognised Stage 3 interest, whether it gives a quarter-end price, whether its figures reconcile internally and whether the filing is machine-readable at its printed column positions.
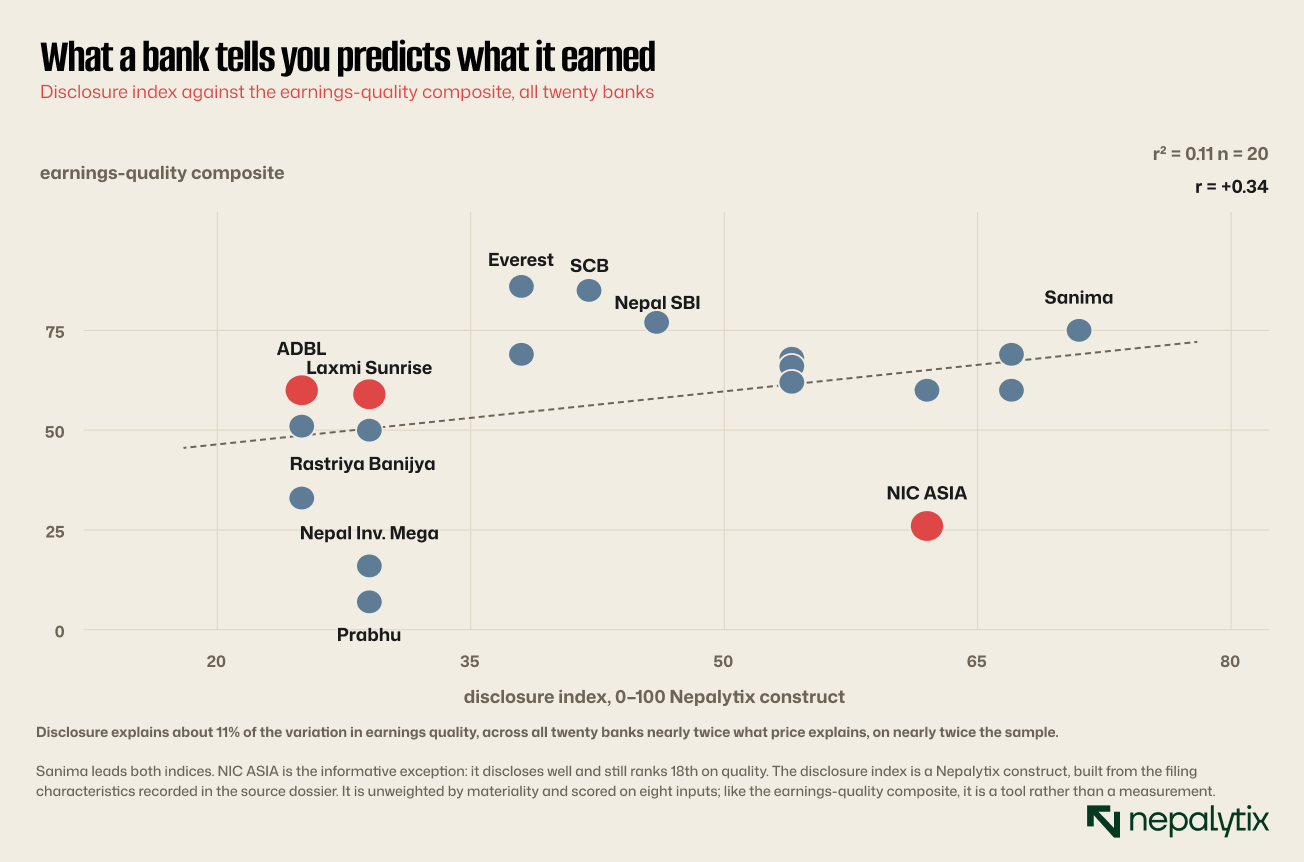
Eleven per cent is still weak and we would not build a portfolio on it. But it is meaningfully stronger than price and it is available for all twenty banks rather than eleven.
What almost nobody discloses
The sector's disclosure floor is lower than the market appears to assume.
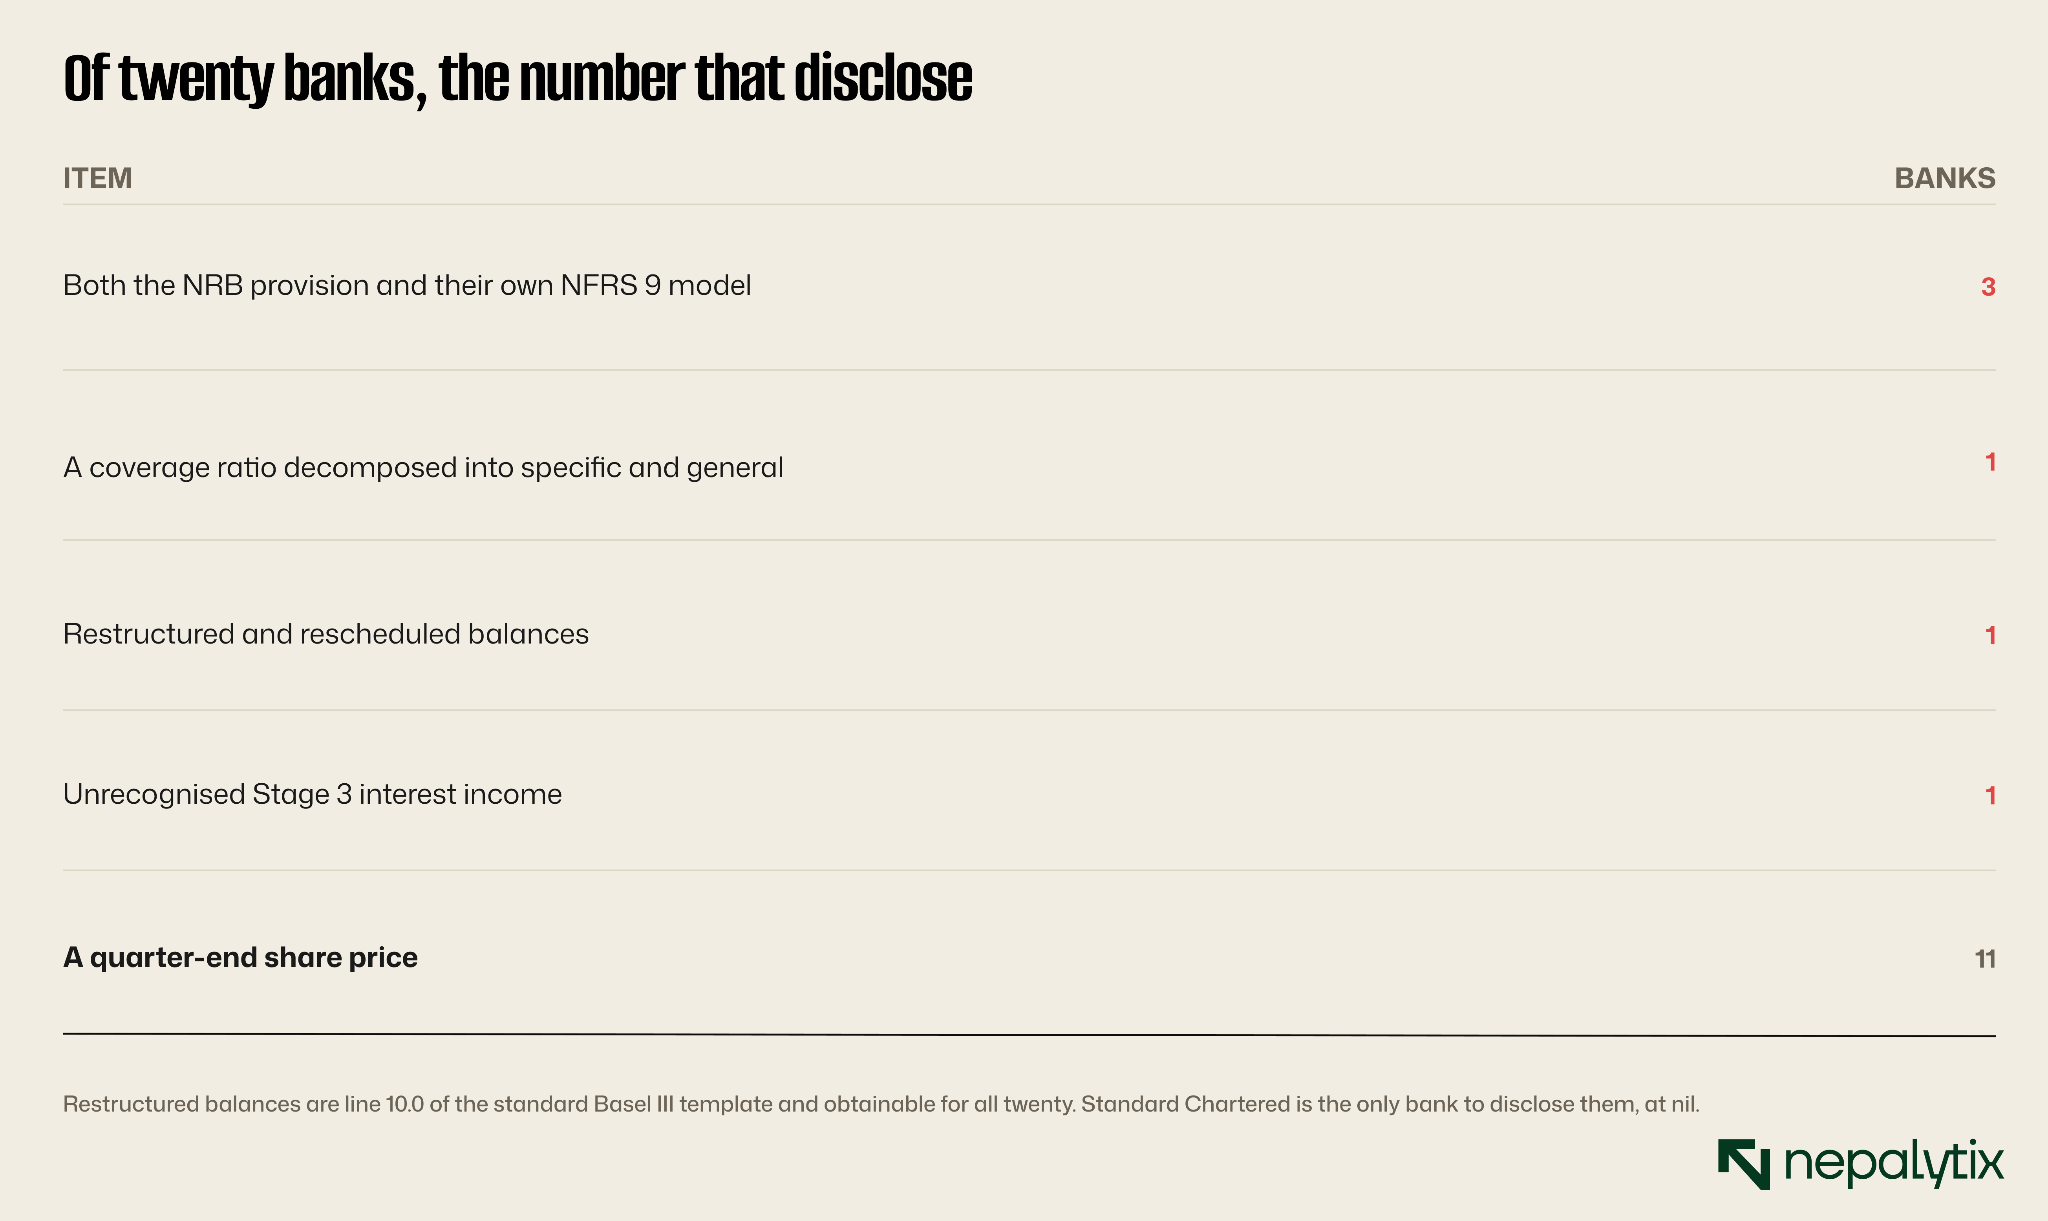
Format variance compounds it. Eight banks filed a full interim report. Three filed a statement without segment or concentration data. Eight filed a press release or newspaper summary. One filed a Basel III disclosure only.
This connects to a theme running through our work this month. The Signal of 17 August found that only four of twelve Q4 filers published an EPS comparison alongside profit growth. The Long Read of 20 August found four listed manufacturers carrying a Rs 2.49bn liability that appears in no company communication. The pattern is consistent: the Nepali market publishes headline figures reliably and the numbers required to interpret them rarely.
Reconciliation against the published consensus
We cross-checked against the ShareSansar Q4 compilation of 18 August 2026, the most widely read sector summary in the market. Most figures agree. Where they do not, the differences matter and we set them out rather than quietly using our own.
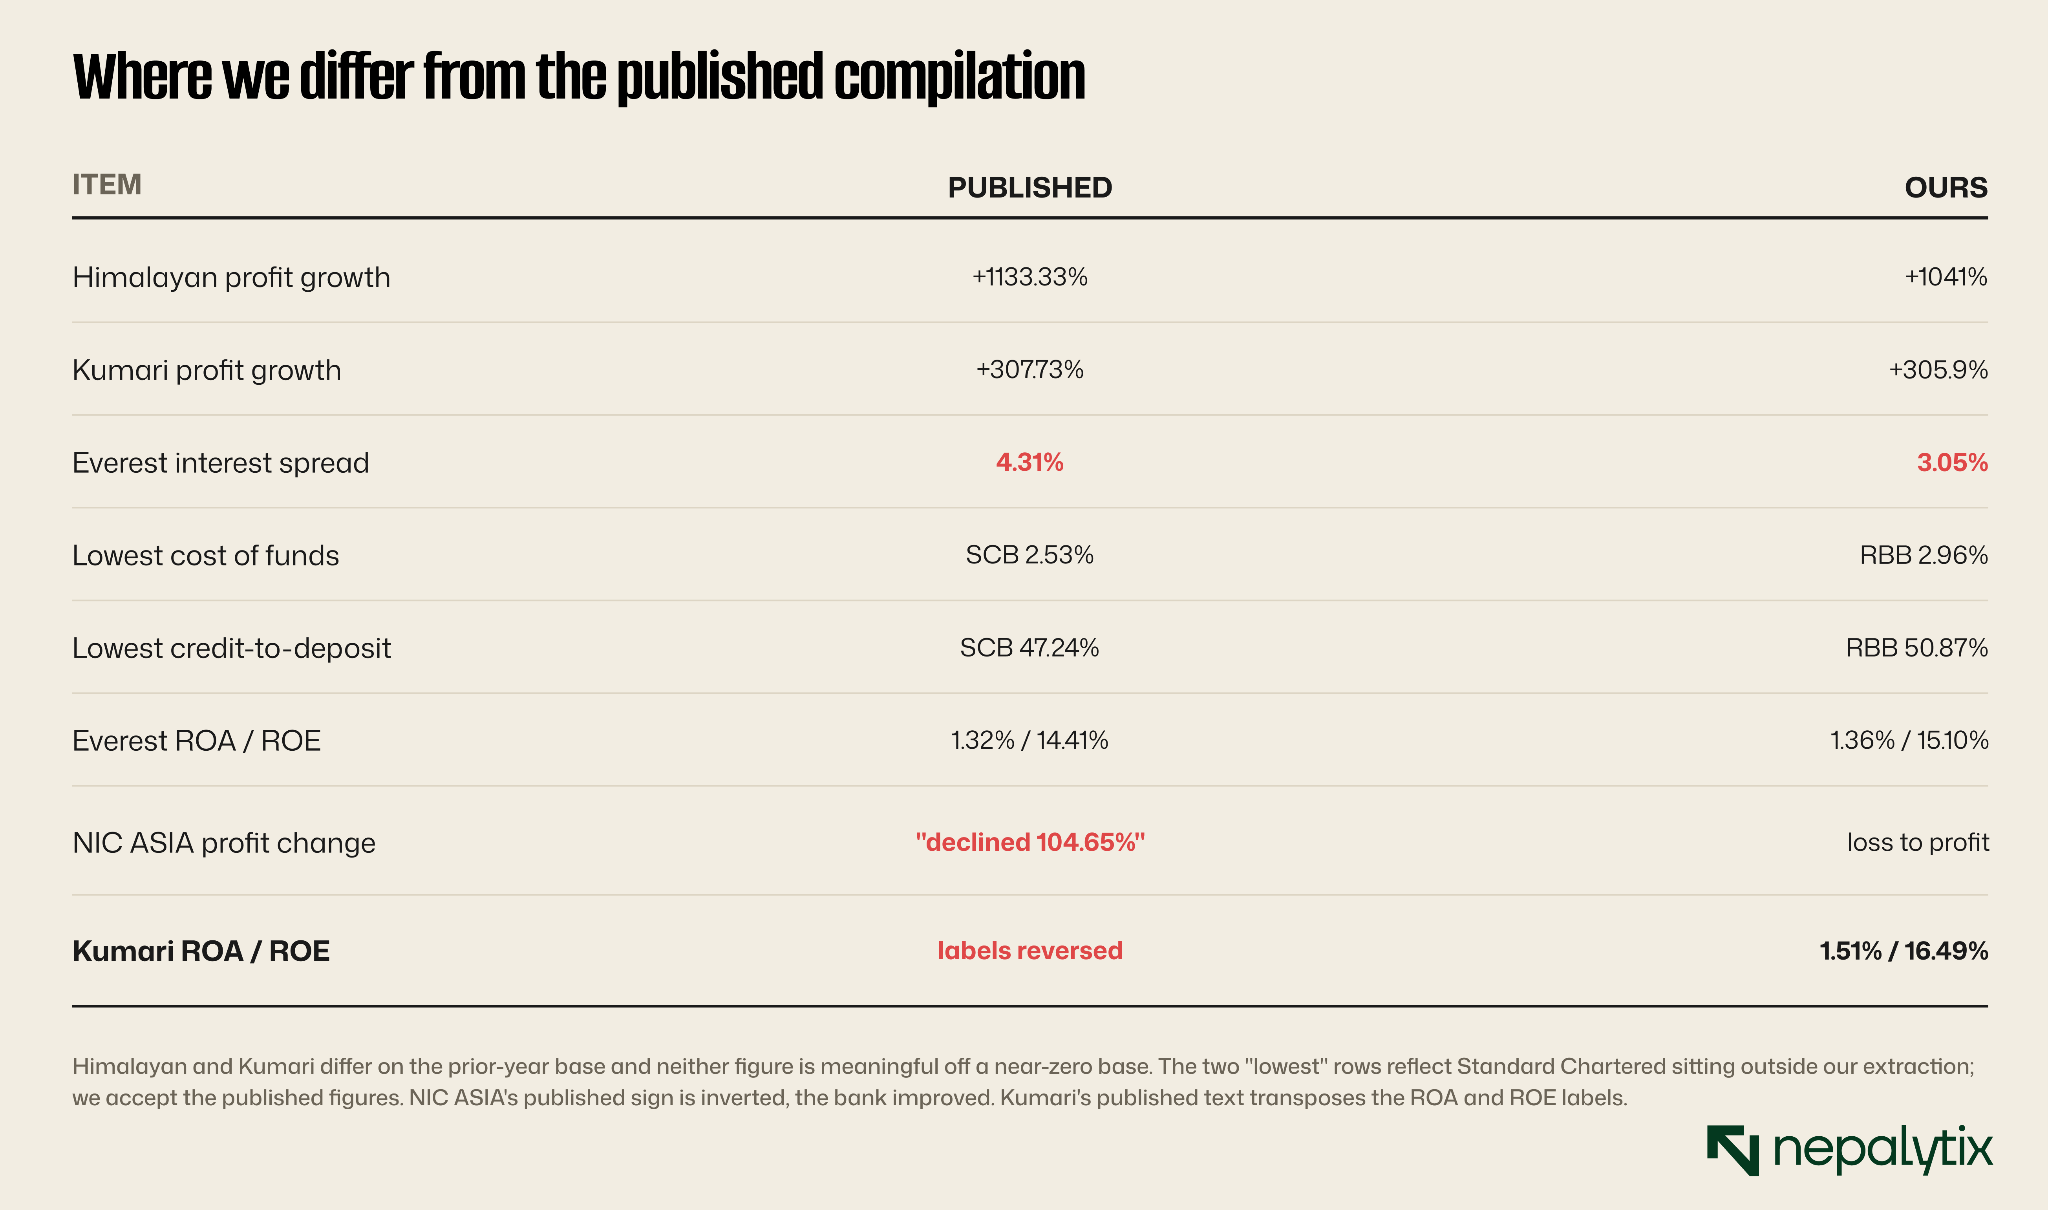
The Everest spread conflict is the one we cannot resolve and it should be checked against the audited accounts. It does not affect the composite which does not use spread.
Three figures we took from the published compilation having been unable to source them ourselves: Himalayan's distributable profit per share of −Rs 43.58, Standard Chartered's EPS of Rs 28.38 and distributable profit per share of Rs 19.04, and the sector aggregates. Standard Chartered's inclusion in the scorecard rests on those figures.
What we would watch
Sector
Deposit repricing is nearly exhausted. It carried net interest income at most banks this year. Cost of funds is below 3% at two banks and the Q4 data already shows relief decelerating, reversing or being outrun by falling asset yields at four different banks.
The FY2083/84 change in interest recognition. NRB's transitional table moves Stage 1 and 2 assets to effective interest rate on gross carrying amount and Stage 3 to amortised cost. This changes interest recognition across the entire sector next year.
Restructured balances are disclosed by exactly one bank in twenty. It is line 10.0 of the standard Basel III template and obtainable for all of them. At Prabhu's 15.55% gross NPL it is the most important undisclosed number in the sector.
Repossessed collateral is rising fast, investment property up 59.5% at Nepal Investment Mega, 45.7% at Nepal SBI, 40.8% at Prabhu, 28.8% at Prime, 24.0% at Sanima. It lags past defaults and leads realised losses and appears in no ratio table.
Bank-specific
Prabhu Net NPL 6.21% with the thinnest cover in the sector and cash tax at 144.7% of pre-tax profit. Two shock absorbers gone at once.
NIC ASIA CET-1 at 6.27%, three points below any peer priced at 1.89× book. A Rs 3.59bn deferred tax asset carrying 661% of profit.
Nepal Inv. Mega Q4 pre-tax losses two years running. Cash interest received −22.1% against accrued −13.1%.
Rastriya Banijya Rs 185.7bn of deposits arrived and Rs 39.7bn was lent. Composition undisclosed against a Rs 293bn securities book funded by it.
Prime Nil capital redemption reserve against Rs 12.17bn of debentures. Highest credit-to-deposit, lowest liquidity.
Sanima Top-20 borrower concentration at 25.29% group-wise, more than double the next bank.
Nepal SBI A 416 basis point fall in the effective tax rate carried half the profit growth, unexplained.
Kumari Whether the Rs 3.0bn Q4 release reverses. NPL rose while provisions were released.
What this year actually was
Nepali commercial banking spent FY2082/83 unable to lend a third of its deposit base, watching the yield on what it had lent fall almost everywhere and reporting its best profit growth in three years anyway.
The reconciliation between those facts is the provisioning line, the deferred tax line and the interest-receivable adjustment, three items that move on classification, on tax timing and on regulatory instruction rather than on anything a customer paid.
None of that is improper. Banks applied the directives as written and where a bank's own model said the provision should be lower, the regulator required the higher figure and the bank took it. The system worked as designed.
What the system does not do is tell a shareholder which of two banks reporting similar growth actually collected the money. That distinction has to be reconstructed from the filings and this report is an attempt at it.
Sixteen of twenty banks disclose neither their own loss model nor the decomposition of their coverage ratio. The information required to price this sector properly exists and most of it is not published.
We will run this again on the audited accounts. Given how much of this year's reported profit sits in an impairment line that every bank warns may change on the instruction of the regulator or the statutory auditor, that revision is likely to matter more than usual.
Disclaimer
This report has been prepared by Nepalytix for informational and educational purposes only and does not constitute investment advice, an offer, or a solicitation to buy or sell any securities.
The information contained in this report is based on sources believed to be reliable; however, Nepalytix does not guarantee its accuracy, completeness, or timeliness. Opinions, estimates, and projections expressed herein are those of the authors as of the date of publication and are subject to change without notice.
Investing in securities involves risks, including the possible loss of principal. Past performance is not indicative of future results. Readers are advised to conduct their own independent research and consult with a qualified financial advisor before making any investment decisions.
Nepalytix and its contributors may hold positions in the securities discussed in this report at the time of publication or thereafter.
Neither Nepalytix nor any of its affiliates accept any liability for any loss arising from the use of this report or its contents.