Nepal's Biggest Investor Doesn't Have a Trading Account.
More than 4.5 million Nepalis are investors without realizing it. Through compulsory retirement savings in EPF, SSF, and CIT, workers collectively own nearly Rs 924 billion in assets-including a 10% stake in NEPSE.
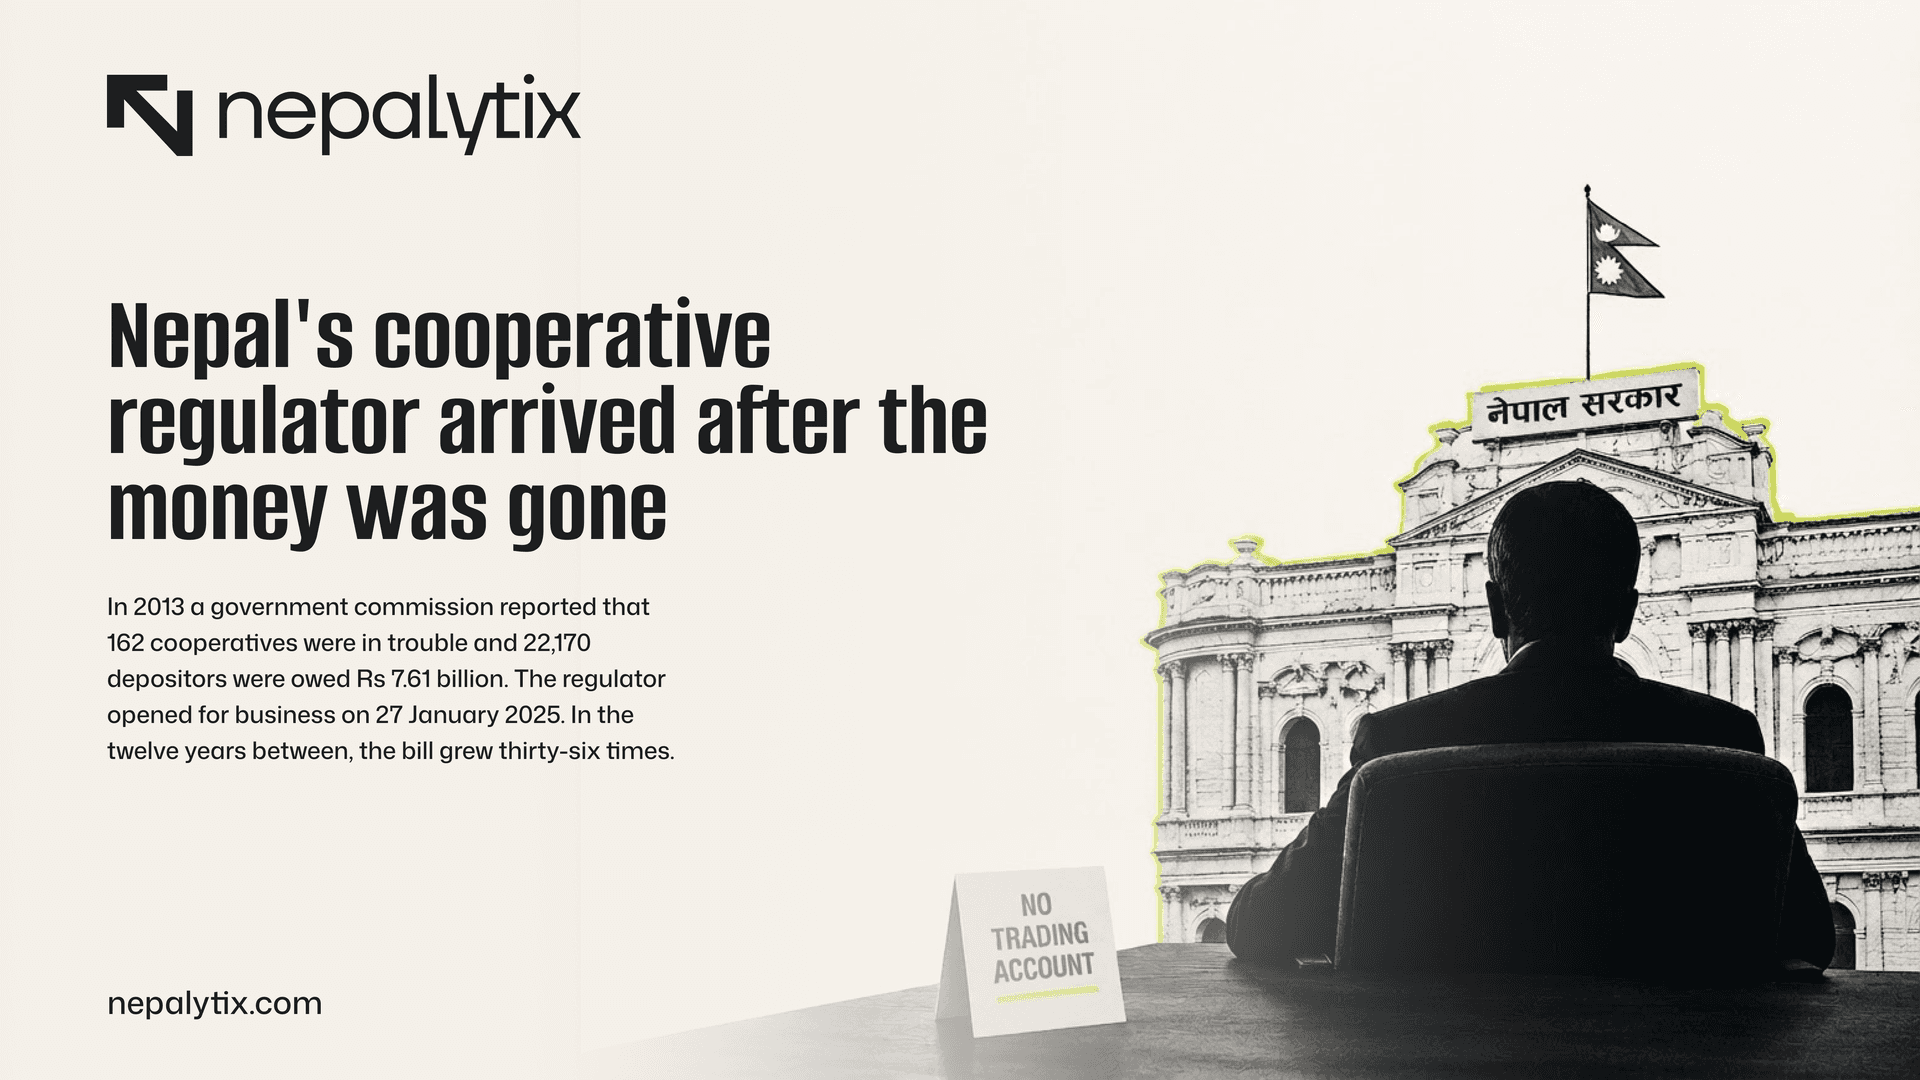
Four and a half million Nepalis have money in the stock market. Almost none of them opened a demat account, chose a stock or read an annual report. The deduction on their payslip did it for them and the fund that holds it owns a tenth of the exchange itself.
Find a payslip. Almost any Nepali payslip from a formal employer will be a bank in New Road, a school in Pokhara, a garment factory in Birgunj, a ministry office in Singha Durbar. Somewhere below the gross figure there will be a line that reduces it, marked provident fund or sanchaya kosh or SSF and it will be ten per cent of basic pay.
Almost nobody reads that line, and there is no particular reason they should. It is not a choice so there is nothing to decide. The employer deducts the worker's ten per cent, adds a matching ten per cent of its own, and remits the combined twenty per cent to an institution the worker has probably never visited. On a basic salary of Rs 30,000, that is Rs 6,000 a month leaving the payroll and Rs 72,000 a year arriving somewhere else.
The worker's relationship with that money for the next thirty years consists of one number, published once a year: the interest rate credited to their balance. In fiscal year 2082/83 that number was 4.25%, with a further one per cent added at year end, for a total of 5.25%.
What happens in between where the Rs 6,000 goes, what it buys, who decides, what it earns before the credited rate is declared is not something the worker is told, and it is the subject of this piece.
The scale is the first thing worth absorbing. The Employees Provident Fund covers over 1.5 million members. The Social Security Fund, which did not exist a decade ago, has passed three million contributors across 22,309 enrolled employers. The Citizen Investment Trust holds a further Rs 232.7 billion for participants in its own schemes.
Four and a half million people, give or take an overlap nobody has published and which no institution appears to have measured. In a country of roughly thirty million, that is one Nepali in seven with a compulsory, professionally managed, long-horizon savings account whose asset allocation they cannot see and cannot influence.
They are all investors. None of them applied for the job.
The phrase deserves unpacking, because "investor" in Nepal has come to mean something specific and this is not it. It means a person with a demat account and a broker, watching the index, arguing about hydropower valuations. There are a few hundred thousand of those. This piece is about a different and much larger group: people whose exposure to the market is total, involuntary and invisible to them, mediated entirely by an institution they have no relationship with beyond a monthly deduction and an annual number.
This is not a scandal, and it is important to be clear about that at the outset. Compulsory retirement savings is a good policy. Nepal's formal-sector worker is, in this dimension, better protected than a majority of South Asian workers. The institutions holding this money have not stolen it, unlike as Wednesday's piece described at length, several hundred cooperatives that took the savings of the same kind of people.
The argument here is narrower and stranger. It is that Nepal has built almost by accident, one of the largest pools of patient domestic capital in its history; that this pool is the single most important institutional force in the Nepali capital market; and that the people who own it have no idea, no information and no voice.
Two schemes, not one
A complication worth setting out early, because it shapes everything that follows: Nepal does not have one worker fund, it has three and a given worker is in one or two of them depending on decisions made by their employer rather than by them.
The Employees Provident Fund covers employees of government, public enterprises and the private sector, on the classic ten-plus-ten model. Firms with ten or more employees are mandatorily enrolled. Since fiscal year 2076/77 the EPF has additionally administered the Contributory Pension Scheme for federal government and public sector employees appointed from that year which means it now runs two distinct pools with different liability profiles under one roof.
The Social Security Fund is a broader social protection scheme for medical treatment, maternity, accident and disability, dependent family support and old-age security funded by contribution and mandatory for many employers from 2018/19. Where an employer has enrolled in SSF, the provident fund and SSF arrangements operate as parallel or alternative structures depending on the employer.
The Citizen Investment Trust operates a defined contribution pension scheme and generates roughly 80% of its income as a management fee on it. It also manages contribution-based term life insurance funds for civil servants, army and police personnel, teachers, and employees of organised institutions.
The practical consequence is that a Nepali worker's retirement provision depends on which institution their employer signed up with, that the schemes have different benefit structures and different governance and that nobody publishes a reconciliation. A worker who moves between employers may accumulate balances in more than one. There is no single statement, no portability framework a member can navigate unaided, and no published count of unique individuals across the three.
Sainik Drabya Kosh, 1934
The story starts earlier than the stock exchange, earlier than the securities regulator, earlier than democracy and considerably earlier than the constitution that now governs it.
In 1934, under the Rana regime, the Nepal Army established Sainik Drabya Kosh an army provident fund, a contribution-based scheme for retired soldiers. It is the first recorded social security initiative in Nepal. The state's earliest instinct about pooled savings was military, and it predated almost every other financial institution in the country.
In 1944 a parallel scheme, Nijamati Sanchaya Kosh was created for civil servants based in Kathmandu. In 1948 it was extended to civil employees throughout the country. By the late 1940s Nepal therefore had two significant pools of compulsory worker savings, managed separately under a government that was about to be overthrown.
The consolidation came in 1962 when the Employees Provident Fund Act brought the schemes together and created an autonomous body to manage them: Karmachari Sanchaya Kosh, the Employees Provident Fund. That institution has now been accumulating money continuously for sixty-four years.
Look at the two markers picked out in gold. The EPF was created in 1962. The Nepal Stock Exchange opened its trading floor on 13 January 1994 thirty-two years later.
That sequence explains a great deal about the Nepali capital market that is otherwise puzzling. The institution with the most patient money in the country is older than the market it invested in by more than three decades. It did not grow up alongside a securities industry, learning to price risk in public equity as the market matured. It spent its first thirty years lending to the government, placing deposits with state banks and financing infrastructure and then a stock exchange appeared and it had to decide what to do about it.
The Citizen Investment Trust arrived in 1991, three years before NEPSE, established under the Nagarik Lagani Kosh Act 2047 as a second autonomous pension body modelled on employee contribution. Its mandate was broader from the start, the Act explicitly tasks it with capital market development alongside savings mobilisation which is why CIT is the only one of the three funds that is itself listed on the exchange.
The Social Security Fund is the newcomer, made mandatory for many employers in 2018/19 and operational since. And in fiscal year 2076/77 the EPF took on a further mandate: administering the Contributory Pension Scheme for federal government and public sector employees appointed from that year, under the Pension Fund Act 2075.
Why the sequence matters
In most markets, institutional investors and public equity markets develop together. Pension funds become large as listed companies become numerous, and each discipline the other funds demand disclosure, companies compete for capital, and a professional buy-side emerges.
In Nepal the pension institutions came first by three decades and were sized to a bond-and-deposit world. The exchange arrived later and grew into a retail market. The result is that Nepal has large institutions and a retail-priced market and the two have never properly met, which is exactly the complaint brokers took to the Prime Minister at Singha Durbar this month.
The exchange the workers own
Here is the fact that gives this piece its title and it is not a metaphor.
The Nepal Stock Exchange Limited is a company with paid-up capital of Rs 1 billion. The Government of Nepal holds 58.66% of it. Rastriya Banijya Bank holds 11.23%. Nepal Rastra Bank holds 9.50%.
And the Employees Provident Fund holds 10.00%.
The workers are the only outsiders at the table Ownership of Nepal Stock Exchange Limited read as percentages, not angles 58.66% Government of Nepal 11.23% Rastriya Banijya Bank 10.00% EPF the workers 9.50% Nepal Rastra Bank 10.61% Others BY REGISTERED SHAREHOLDER as disclosed for NEPSE's Rs 1bn paid-up capital 79.39% State and state-owned entities 10.00% Employees Provident Fund the workers 10.61% Other shareholders BY WHO THE OWNER ANSWERS TO government, its central bank and its commercial bank, consolidated three state entities, 79.39% between them The Employees Provident Fund is the only non-state institution with a double-digit stake. It is also the only one whose beneficial owners — 1.5 million contributors — were never consulted. Nepal's stock exchange is a state institution with one worker fund attached. The government, its central bank and its commercial bank hold 79.39% between them. The EPF's 10.00% is the largest holding not controlled by the state. Ownership as published for NEPSE's Rs 1bn paid-up capital; percentages sum to 100.00. The consolidation in the lower bar is ours: Rastriya Banijya Bank and Nepal Rastra Bank are treated as state entities. Figure 3. Ownership of Nepal Stock Exchange Limited read as a 100% composition rather than a pie, so the percentages can be compared directly. The upper bar is the registered shareholder list; the lower bar consolidates the government, its central bank and its commercial bank into a single state holding. That consolidation is ours, not NEPSE's. The exchange is not merely a place where Nepal's workers' savings are invested. It is partly an asset of those savings. Every formal-sector worker in the country is, through a deduction they did not choose, a part-owner of the institution that lists, trades and settles Nepali equities. Consolidate the state's holdings and the picture sharpens. The Government of Nepal, Nepal Rastra Bank and Rastriya Banijya Bank hold 79.39% between them — the sovereign, its central bank and its commercial bank. The EPF's 10.00% is the largest single holding in the Nepali stock exchange that the state does not control, which makes 1.5 million provident-fund contributors the only outside institutional owners of the venue on which the entire market trades. It would be easy to make too much of this. Ten per cent of a Rs 1 billion paid-up capital is Rs 100 million of book value — a rounding error against the fund's total assets, and NEPSE has historically been a utility rather than a profit engine. In pure portfolio terms the stake is trivial. In governance terms it is not trivial at all. The third largest shareholder in Nepal's monopoly stock exchange is an institution holding the retirement savings of 1.5 million people, which does not publish its asset allocation, does not publish its investment returns, and is governed by a board appointed through the Ministry of Finance. Whatever one thinks about that arrangement, the workers whose money it is have never been asked. The size of the pool Now scale up from the exchange's paid-up capital to the money itself. CIT reported assets under management of Rs 232.689 billion, up 16.04% year on year. The SSF has accumulated Rs 116.71 billion of contributions by the end of Ashad in fiscal year 2082/83. The EPF's most recent publicly identifiable asset figure is Rs 350 billion in fiscal year 2076/77, up from Rs 309 billion the year before; compounded at the 8.62% growth in provident fund assets the fund has itself disclosed, that implies roughly Rs 575 billion today. Where the deduction actually goes One rupee of provident-fund contribution, traced from payroll to the exchange THE PAYSLIP THE FUNDS THE ASSETS Employee 10% 50% Employer 10% 50% EPF 62% CIT 25% SSF 13% Government paper 34% Bank deposits 28% Infrastructure loans 18% Contributor loans 14% Listed equity 6% NEPSE Fund shares are actual. The asset split is an illustrative composite — no fund publishes its allocation. Only the first two columns of this diagram are public knowledge. Fund shares are computed from reported assets: EPF 62.2%, CIT 25.2%, SSF 12.6% of the Rs 924bn pool. The asset column is a composite illustration. The asset allocation shown is NOT reported by any of the three funds. It is an illustrative composite consistent with the single public data point — EPF's 6% share investment in FY2076/77 — and should not be read as disclosure. Figure 4. One rupee of contribution traced from payroll through the funds to the exchange. Ribbon widths in the first two columns are computed from reported assets. The asset column is an illustrative composite and is not disclosed by any fund — it is consistent with the single public data point, EPF's 6% share investment in FY2076/77. Roughly Rs 924 billion. Against a NEPSE market capitalisation of Rs 4,657 billion, that is about a fifth of the entire listed market held in three institutions on behalf of people who do not know they own it. We should be careful with this comparison and we flag it in the caption. The funds do not hold all of that in equities — nothing like it. Most of the money is in government securities, fixed deposits with commercial banks, debentures, infrastructure loans and direct lending to contributors. The point of the chart is not that the funds own a fifth of the market. It is that they could, at the stroke of an investment committee's pen, and everyone in the Nepali market knows it. That latent capacity is why the brokers' delegation that met Prime Minister Balendra Shah on 20 July asked, among other things, for the EPF, CIT and SSF to be allowed into secondary markets. It is the single largest untapped source of demand in Nepal's capital market, and it belongs to workers. The most consequential investment decision in Nepal is made by three committees, on behalf of four and a half million people, none of whom will ever see the minutes. What the funds actually hold It is worth stating plainly what is known and unknown about the portfolios, because the rest of this piece depends on it. The EPF is described in its own disclosures as investing in infrastructure and hydroelectricity alongside financial assets. Its most recent identifiable share-investment figure is Rs 21.14 billion against Rs 350 billion of total assets in fiscal year 2076/77 — six per cent. The composition of the remaining 94% is not published in comparable form. CIT's mandate names government securities, corporate shares, debentures and banking instruments, and its statutory purpose explicitly includes capital market development. It has also made direct loans: its loan deed with Nepal Airlines Corporation for the purchase of wide-body aircraft requires the airline to allocate 30% of ticket-sale revenue to a special repayment account — a provision that independent analysis has noted lacks implementation. The SSF's guideline identifies five areas: loans to contributors, fixed and long-term deposits with commercial banks, government and bank debentures, equities and mutual funds, and fixed assets. So all three are permitted to hold listed equity. All three do hold some. None publishes how much, at what cost, or with what result. That single sentence is the reason a piece like this has to be built out of inference rather than analysis, and it is the strongest argument in the reform section at the end. A note on the Nepal Airlines loan The CIT aircraft loan deserves a paragraph because it illustrates a category of risk that pure portfolio analysis misses. A pension fund lending to a state-owned airline against a hypothecated share of ticket revenue is making a credit decision with a political dimension. If the airline underperforms, the fund's recourse is against an entity the government also owns and also protects. Independent analysis has flagged a second CIT exposure of the same type: its employee savings retirement scheme contains a provision paying Rs 100,000 to a contributor's beneficiary in the event of accidental death. That is a defined-benefit feature inside a defined-contribution scheme, and it requires actuarial valuation to size the liability — which, according to the same analysis, has not been practised. A small provision, unvalued, in a Rs 232 billion fund is not a solvency issue. It is a governance signal. Part four The rate that fell by a third For the worker, none of this matters directly. What matters is the one number they are given, and that number has been moving in one direction. The EPF credits interest annually on accumulated balances. The rate is set by the fund's board and carries a statutory floor of 3%, with any shortfall met by the Government of Nepal. With effect from Shrawan 1, 2079 — mid-2022 — the fund raised the rate to 8%, having previously paid around 7%. Historically the range had been 7% to 8.5%. In fiscal year 2081/82 the credited rate was 5.5% plus a 1% year-end adjustment, for 6.5%. In fiscal year 2082/83 it was 4.25% plus 1%, for 5.25%. Eight per cent became five and a quarter Interest credited by the Employees Provident Fund, against its benchmarks NRB inflation target 5.50% 91-day treasury bill 2.25% statutory floor 3.00% 0% 2% 4% 6% 8% annual rate credited to members 8.00% FY2079/80 6.50% FY2081/82 5.50 + 1.00 5.25% FY2082/83 4.25 + 1.00 −0.25pp real return at the central bank's own inflation target The staircase only goes one way, and the bottom step is below inflation. The credited rate fell 34% in three years. It still clears the 91-day treasury bill by 300 basis points and sits above the 3% floor the government guarantees. Rates comprise the headline rate plus the year-end adjustment as published by EPF. The inflation comparison uses NRB's target rather than a realised CPI print. Figure 5. The credited rate as a descending staircase against three benchmarks. Rates comprise the headline rate plus the year-end adjustment as published. The inflation comparison uses NRB's target rather than a realised CPI print and is illustrative. Eight per cent to 5.25% in three years. A decline of 34% in the rate at which the retirement savings of 1.5 million people compound. Two readings of that chart are both correct and they point in opposite directions, which is why this deserves more than a headline. The defence of 5.25% The fund is not underperforming its environment. The 91-day treasury bill — the closest thing Nepal has to a risk-free rate — stood at 2.25% in mid-July 2026. Deposit rates across the banking system have fallen sharply as the sector moved from a liquidity crunch to a glut. A fund crediting 5.25% is beating the risk-free rate by a full three percentage points, which for a portfolio weighted towards government securities and bank deposits is a respectable outcome. The decline in the credited rate is therefore mostly not a failure of management. It is the transmission of a national fall in interest rates into a portfolio built to hold interest-bearing assets. If money earns less everywhere, a fund that holds money earns less. There is a second defence, which is the floor. The government guarantees 3%. A Nepali worker's provident fund balance cannot fall, and cannot compound at less than 3%, because the taxpayer stands behind it. That is a genuine and unusual protection and it should be said clearly, particularly in a week when we have written about cooperative depositors who had no such guarantee and lost everything. The problem with 5.25% And yet. Nepal Rastra Bank's inflation target is 5.5%. If inflation runs at target — which is the central bank's own stated intention — then a worker crediting 5.25% is losing purchasing power at a quarter of a percentage point a year. That is the whole return. Not the return after fees, or the return net of some optional charge. The number the fund declares is the number the worker gets, and at the central bank's target it is negative in real terms. A pension system that preserves nominal capital and loses real capital is doing something, but it is not building retirement wealth. It is a very safe, very slow leak, and it is invisible to the person it happens to. And it is happening to money that has a thirty-year horizon, which is precisely the horizon over which an investor should be able to accept volatility in exchange for real return. Part five What 2.75 points costs a bricklayer Percentages are abstract. Compounding is not, and a thirty-year horizon turns small rate differences into life-altering sums. Take the worker from Part one. Rs 30,000 monthly basic, twenty per cent combined contribution, Rs 6,000 a month into the fund, thirty years of continuous service. Hold the contribution constant and vary only the rate. The shaded area is somebody's retirement One worker, thirty years, two credited interest rates 0 2 4 6 8 accumulated balance, Rs million 0 10 20 30 years of contributing Rs 30,000 monthly basic · 20% combined · Rs 6,000 a month · contributions identical in both cases 8.00% Rs 8.94m 5.25% Rs 5.23m Rs 3.71m removed from one career by 2.75 points of interest the shaded wedge is the loss A 2.75-point fall in the credited rate removes 41.5% of the terminal balance. The worker's contribution is identical along both curves. Only the rate differs, and thirty years of compounding turns that into Rs 3.71m. An illustrative constant-salary, constant-rate model that isolates the rate effect. It is not a projection of any individual member's balance. Figure 6. Two career paths, 8.00% and 5.25%, with the shaded wedge between them representing Rs 3.71m of lost retirement. The worker's contribution is identical along both curves. An illustrative constant-salary model that isolates the rate effect. At 8%, the rate credited in fiscal year 2079/80, that worker retires with Rs 8.94 million. At 5.25%, the rate credited in fiscal year 2082/83, the same worker — contributing exactly the same money, for exactly the same time — retires with Rs 5.23 million. The difference is Rs 3.71 million. It is 41.5% of the larger balance. Nobody stole it. Nobody mismanaged it. The worker's contribution never changed. Two and three-quarter percentage points, applied over three decades, removed two-fifths of a retirement. The same contributions, four rates · Rs 6,000 a month for 30 years Credited rate Terminal balance Against 8% 8.00% — FY2079/80 Rs 8,942,157 — 6.50% — FY2081/82 Rs 6,637,069 −25.8% 5.25% — FY2082/83 Rs 5,230,869 −41.5% 2.25% — 91-day treasury bill Rs 3,080,935 −65.5% Total contributions over the period are Rs 2.16m, so even the treasury-bill case earns a positive nominal return. The model holds salary flat and is illustrative of the rate effect only. The bottom row is included as a reference rather than a scenario, and it makes a point in the fund's favour: the difference between the fund's 5.25% and a pure treasury-bill portfolio is Rs 2.15 million of the worker's money. Whatever the fund is doing beyond buying bills, it is worth roughly two million rupees per Rs 30,000-salary member over a career. That is real value creation and it belongs in the assessment. But the top row is the one to hold onto. Nepal's provident fund was crediting 8% four years ago. It is crediting 5.25% now. If that is where rates are going to sit, then every worker currently in their twenties is on the Rs 5.23 million path rather than the Rs 8.94 million one, and no announcement has been made about it because none is required. What a higher equity weighting would actually mean The obvious response is that the fund should hold more equity. Over thirty years, listed equity in almost every market has beaten bonds and deposits, and a thirty-year liability is the textbook case for accepting volatility. The complication is that this is Nepal's market, and Wednesday's Edition described its condition: turnover at a third of its 2024 velocity, a fifth of it concentrated in three securities, and a free float in many listed companies measured in tens of thousands of shares. A fund the size of the EPF cannot buy Nepali equity at scale without becoming the price. It would not be diversifying into the market; it would be the market. That is not an argument against more equity. It is an argument that the sequencing runs the other way: the market has to become deep enough to absorb institutional money before institutional money can safely enter it. Which is what the SEBON roadmap is nominally for. Why the rate fell, mechanically It is worth being specific about the transmission, because "rates fell" is a description rather than an explanation. A fund holding predominantly interest-bearing assets earns a weighted average of the yields on those assets. When new money arrives and existing instruments mature, both are reinvested at prevailing rates. If prevailing rates fall, the portfolio's average yield falls with a lag determined by the duration of what it holds — slowly at first, then in line. Nepal's interest rate environment has compressed hard. The 91-day treasury bill at 2.25% is roughly a third of what a comparable instrument yielded three years ago. Deposit rates followed as the banking system moved from a liquidity crunch into a glut, with the credit-to-deposit ratio at 74.32% against a 90% ceiling — sixteen points of unused lending capacity, which is another way of saying banks do not need to compete for deposits. A provident fund holding government paper and bank deposits into that environment was always going to credit less. The independent review of the EPF makes the connection explicitly, attributing the downward trend in member yields to compressed domestic interest rates and subdued equity market performance. Note the second half of that sentence. Equity market performance is named as a contributing factor, which tells us the equity allocation is large enough to matter to the credited rate. It is the closest thing to a disclosure about the portfolio's sensitivity that exists in the public record, and it arrives by inference in a sentence about something else. Part six The fund nobody can audit All of the above rests on an uncomfortable foundation, which is that we cannot check most of it. A member of the EPF can find out two things about their money. They can find their own balance, and they can find the interest rate the fund credited. Both are published, both are accurate, and for most purposes both are what a member wants. What a member cannot find is what the fund earned. Same money in. Four different amounts out. Thirty years of contributions against the resulting balance, by credited rate CONTRIBUTED ACCUMULATED Rs 2.16m Rs 8.94m Rs 2.16m Rs 6.64m Rs 2.16m Rs 5.23m Rs 2.16m Rs 3.08m 8.00% 4.14× 6.50% 3.07× 5.25% 2.42× 2.25% 1.43× The left column never changes. The worker pays in Rs 2.16m regardless. The right column is the only thing the credited rate decides. Even at treasury-bill rates the worker gets more back than they put in. The question is how much more. Rs 2.16m of contributions become Rs 8.94m at 8% and Rs 5.23m at 5.25% — a multiple of 4.14 against 2.42 on identical payments. Contributions are undiscounted nominal sums at a flat salary. The model isolates the credited rate and ignores salary progression. Figure 7. Contributions on the left, resulting balance on the right, mirrored about a common spine. The left column is identical in all four rows: the worker pays in Rs 2.16m regardless. Only the right column changes. Asset allocation by class is not published in comparable form. Gross investment return is not disclosed in public reports — a gap independent reviews of the fund have specifically noted. Holdings by security are not published. No benchmark is published, so no tracking assessment is possible. The distinction between the credited rate and the gross return is the whole issue, and it is worth being precise about why. The credited rate is a board decision. The gross return is a fact about the portfolio. A fund can earn 9% and credit 5.25%, retaining the difference as reserves; or earn 4% and credit 5.25%, drawing reserves down. Both are legitimate smoothing practices and every long-horizon fund does some of it. But a member who cannot see the gross number cannot tell which is happening, cannot tell whether reserves are building or depleting, and cannot form any view at all about whether the institution is investing their money well. The only allocation figure we could identify from public sources is from fiscal year 2076/77: share investments of Rs 21.14 billion against total assets of Rs 350 billion, or 6.0%. That is six years old, it predates the Contributory Pension Scheme mandate, and it is the best a diligent member can currently do. The largest pool of worker savings in Nepal publishes its output and withholds its performance. We want to be fair about the reason. This is not concealment in any sinister sense. It is the disclosure culture of a 1962 institution that reports to a ministry rather than to a market, built before anyone expected pension funds to publish fact sheets. The EPF does publish a financial glance with asset balances. It reports to the Ministry of Finance. It is audited. The information exists. It simply does not reach the 1.5 million people whose money it is, in a form any of them could use. What good disclosure would look like The comparison is not to Canada or Singapore, which is where this discussion usually goes and which is not useful. The comparison is to institutions in Nepal that already do better. CIT is listed on NEPSE. As a listed company it files quarterly reports, publishes net profit, discloses its own balance sheet, and is analysed by domestic research houses. A CIT scheme participant who wants to know something about the institution holding their savings has a considerably better chance than an EPF member, purely because CIT happens to be listed and therefore subject to a securities regulator. Nepal Rastra Bank publishes far more about the banks it supervises than the EPF publishes about itself. Nepal Insurance Authority requires solvency and claims disclosure from insurers. The disclosure standard applied to institutions holding the public's money in Nepal is not uniformly low. It is low specifically for the largest one. Part seven The three million who arrived after 2019 The reason this stops being a curiosity and becomes urgent is the Social Security Fund. Biggest is slowest, newest is fastest Nepal's three statutory worker funds across four measures Each vertical axis has its own scale. A line crossing another means the ranking flips on that measure. Assets Rs bn 0 620 Contributors millions 0 3.4 Growth % a year 0 66 Age years 0 70 EPF CIT SSF SSF growth is the three-year rate; CIT publishes no contributor count. EPF assets are estimated. On every measure except size, the ranking inverts. EPF holds the most and grows slowest. SSF holds the least, has twice EPF's contributors, and is compounding at roughly 60% a year off a small base. CIT does not publish a contributor count and is plotted at zero on that axis. EPF assets are a Nepalytix estimate; SSF growth is annualised from three observation points. Figure 8. The three funds on four axes, each with its own scale. Lines crossing means the ranking flips on that measure. CIT publishes no contributor count and is plotted at zero on that axis; EPF assets are a Nepalytix estimate and SSF growth is annualised from three points. The SSF held Rs 28.58 billion in early 2023. It held Rs 95.44 billion by November 2025 and Rs 116.71 billion by the end of Ashad in fiscal year 2082/83. Four times larger in roughly three years, with over three million contributors and 22,309 enrolled employers. It is the fastest-growing pool of institutional money in the country, and its investment guideline already permits equities, the stock market and mutual funds alongside contributor loans, fixed deposits, government and bank debentures, and fixed assets. Which means the question of how Nepal's worker funds invest is not a question about a legacy institution's habits. It is a live question about a fund that will be several times its current size within a decade, whose allocation framework is still being written, and which is being actively lobbied — at the level of the Prime Minister's office — to put more of its money into a market with a third of its normal turnover. The people whose money it is have not been part of that conversation and there is no mechanism by which they could be. The migrant question There is a population this system does not reach, and its size makes the coverage numbers look different. In the first four months of fiscal year 2082/83 alone, 273,810 Nepalis received labour permits for foreign employment. That is an annualised rate approaching 800,000 people leaving to work abroad. Their remittances are the largest single source of domestic liquidity and, as the Edition noted this month, rose sharply over the same period. Almost none of them are in these funds. Provident fund and SSF coverage is built around a domestic employer who withholds and remits. A Nepali working in Qatar or Malaysia has no such employer, and the schemes have no straightforward mechanism to enrol them. This is where the third pool becomes interesting. CIT's citizen pension plan has the structural potential to attract self-employed and foreign-employed citizens — a point Nepali analysts have made — because it is built around individual rather than employer contribution. The SSF has been discussed as a vehicle for compulsory savings from informal-sector and migrant workers for years. Neither has happened at scale. The result is a retirement system that covers a quarter of the population reasonably well and the migrant workforce, whose earnings hold up the balance of payments, hardly at all. Any honest assessment of these institutions has to count that as the largest gap in the design — larger than allocation, larger than disclosure. Governance, or the absence of it Consider what a member of any of these three funds can actually do. They cannot opt out; contribution is statutory. They cannot choose an allocation; there is no lifecycle option, no equity tier, no conservative tier. They cannot vote for a trustee; boards are appointed. They cannot see the portfolio. They cannot benchmark the performance. They cannot withdraw early except for approved purposes after five years of contributions, capped at 60% of balance. And they cannot, in any meaningful sense, complain, because there is no forum in which a provident fund member's view of asset allocation has standing. This is the ordinary condition of defined-contribution savers in many countries and we do not want to overstate the outrage. Most members of most pension schemes worldwide pay little attention and would not exercise a voice if they had one. But the combination in Nepal is unusually complete: compulsory participation, no allocation choice, no performance disclosure, no representation, and an institution that has been accumulating for sixty-four years. Comparison, briefly The usual move here is to invoke Singapore's Central Provident Fund or the Canada Pension Plan Investment Board, and it is usually unhelpful, because those institutions operate in deep markets with decades of governance development behind them. But two comparisons are worth making because they are about coverage and communication rather than sophistication. Nepal's EPF covers over 1.5 million members. Provident funds in Malaysia and Singapore reach up to 80% of their national workforces. Nepal's formal-sector concentration means its ceiling is structurally lower, but the gap is not only structural — Malaysia's fund has invested heavily in communication campaigns specifically to drive voluntary coverage that is not mandated by law, which is precisely the mechanism Nepal would need to reach the self-employed and the returning migrant. The second comparison is about identity infrastructure. Singapore's CPF runs on a national identifier that allows seamless member services and analysis. Nepal's funds cannot currently reconcile their own registers with each other. The national ID rollout that NRB has been folding into banking requirements is the same enabling infrastructure, and nobody appears to be connecting the two projects. Part eight The question nobody is asking Bring the threads together, because the interesting conclusion is not any single fact but what the facts do when placed next to each other. Nepal has roughly Rs 924 billion of compulsory worker savings in three institutions. That is around a fifth of the entire listed market. The institutions are older than the exchange, one of them owns a tenth of it, and the newest is quadrupling every three years. The money is credited at 5.25%, which beats the treasury bill by three points and loses to the central bank's inflation target by a quarter of a point. Over a thirty-year career the fall from 8% to 5.25% removes 41.5% of a worker's terminal balance. Nobody outside the institutions can see what the portfolio holds or what it earned. And a coalition of brokers and market participants is currently lobbying the Prime Minister to move more of this money into a stock market whose turnover velocity is one-third of its 2024 level and whose free float, in many names, is a rounding error. The question being asked in Kathmandu right now is should the funds be allowed into the secondary market? It is the wrong question, or at least an incomplete one, and the reason is that it treats Rs 924 billion of workers' retirement savings as a supply of liquidity for a market that wants it. The right question is the reverse. What allocation would best serve a thirty-year liability owed to 4.5 million people — and is the Nepali equity market currently capable of receiving that allocation without being distorted by it? Do not ask what the workers' money can do for the market. Ask what the market can do for the workers' money. On the current evidence the honest answer to the second half is: not yet, and not much. A market with Rs 5.67 billion of daily turnover cannot absorb meaningful allocation from a Rs 575 billion fund without the fund becoming the marginal buyer in every name it touches. That is not investing. It is price support with a retirement label on it. Which puts the sequencing squarely where SEBON's roadmap claims to want it: market depth first, institutional participation second. Intraday trading, an SME platform, free-float based indices, securities lending, a functioning derivatives market — these are the preconditions for institutional money to enter safely, not the consequences of it entering. Part nine What a reformer would do Five things, and only one of them requires legislation. Publish the gross return. Every year, alongside the credited rate, each fund should publish the portfolio's gross investment return, the allocation by asset class, and the movement in reserves. This is an administrative decision. It costs nothing. It would transform the ability of every Nepali — researchers, journalists, members, the funds' own boards — to assess whether this money is being managed well. Until it happens, every assessment including this one is guesswork built around two published numbers. Publish a benchmark and report against it. A fund holding a bond-and-deposit portfolio should say so, name the index or composite it measures itself against, and report the difference. A member who learns their fund returned 6% learns nothing. A member who learns it returned 6% against a 5.4% composite learns something. Offer at least one allocation choice. Not a full lifecycle menu, which Nepal's administrative capacity would struggle with. One choice: a default balanced option and a higher-equity option for members who want it and understand it. This converts four and a half million passive account-holders into people with a reason to read the disclosure that item one would create. Reconcile the registers. Nobody currently knows how many unique Nepalis contribute to these funds, because EPF and SSF membership overlaps and the overlap is not published. A single national contributor register is a prerequisite for any serious policy about coverage, and it would let the state say honestly how many workers have retirement provision and how many do not. And put a member on the board. This is the one that needs legislation and the one that will not happen soon. But an institution accumulating compulsory contributions from 1.5 million people for sixty-four years without a single seat allocated to a contributor representative is a governance structure from another era. Nepal has just spent a decade discovering what happens when institutions holding the public's savings answer to nobody who holds savings in them. What we could not establish Four things this piece wanted to say and could not, listed because the gaps are part of the finding. We could not establish the EPF's current asset allocation, its current equity holdings, or its gross investment return in any year. The estimate of its total assets is our own compounding of a six-year-old figure. We could not establish how many unique Nepalis contribute across the three funds, because the registers are not reconciled publicly. We could not establish a realised CPI figure for the current period to two independent sources, which is why every inflation comparison here uses NRB's target instead and is flagged as illustrative. And we could not establish what proportion of any fund's returns comes from listed equity, which is the single number that would tell a reader whether the argument about market depth actually binds. A research note on a listed company that could not establish those four things would not be publishable. We are publishing this one because the institution is not listed, the information does not exist in public, and the absence is the story. Coda The payslip, again Go back to the line on the payslip. Ten per cent, matched by the employer, remitted monthly, credited annually at a rate somebody else decides. The worker reading that line is a participant in Nepal's capital markets whether they know it or not. Their money helps fund the government's deficit, sits on deposit at commercial banks, finances hydropower, and owns a piece of the stock exchange. Over thirty years it will compound into the largest financial asset most of them will ever hold, and the single variable that determines its size is a percentage they have no influence over and cannot verify. Nepal spent the last decade learning, expensively, that institutions holding the public's savings need supervision. The cooperative sector taught that lesson at a cost somewhere between Rs 46 billion and Rs 275 billion, depending on which official estimate you believe. The provident funds are not cooperatives. They are solvent, government-backed, competently run and honest. But they hold four times more money than the cooperatives ever did, for four and a half million people, with less public disclosure than a listed commercial bank, and the argument now being made in Kathmandu is that they should put more of it into the stock market. That may well be the right answer. It is impossible to know, because the information required to evaluate it has never been published. The workers, meanwhile, will find out what their retirement is worth on the day they retire. That is the one date on which the number becomes visible, verifiable and final, and it is also the last date on which anything could have been done about it.
Disclaimer
This report has been prepared by Nepalytix for informational and educational purposes only and does not constitute investment advice, an offer, or a solicitation to buy or sell any securities.
The information contained in this report is based on sources believed to be reliable; however, Nepalytix does not guarantee its accuracy, completeness, or timeliness. Opinions, estimates, and projections expressed herein are those of the authors as of the date of publication and are subject to change without notice.
Investing in securities involves risks, including the possible loss of principal. Past performance is not indicative of future results. Readers are advised to conduct their own independent research and consult with a qualified financial advisor before making any investment decisions.
Nepalytix and its contributors may hold positions in the securities discussed in this report at the time of publication or thereafter.
Neither Nepalytix nor any of its affiliates accept any liability for any loss arising from the use of this report or its contents.