Nepal’s Credit Problem Isn’t Interest Rates
Inflation has climbed above NRB’s 5.5% annual target while private-sector credit remains far below its 11% target. With the interbank rate already at the corridor floor, Nepal’s central bank faces a problem that lower rates may not solve.
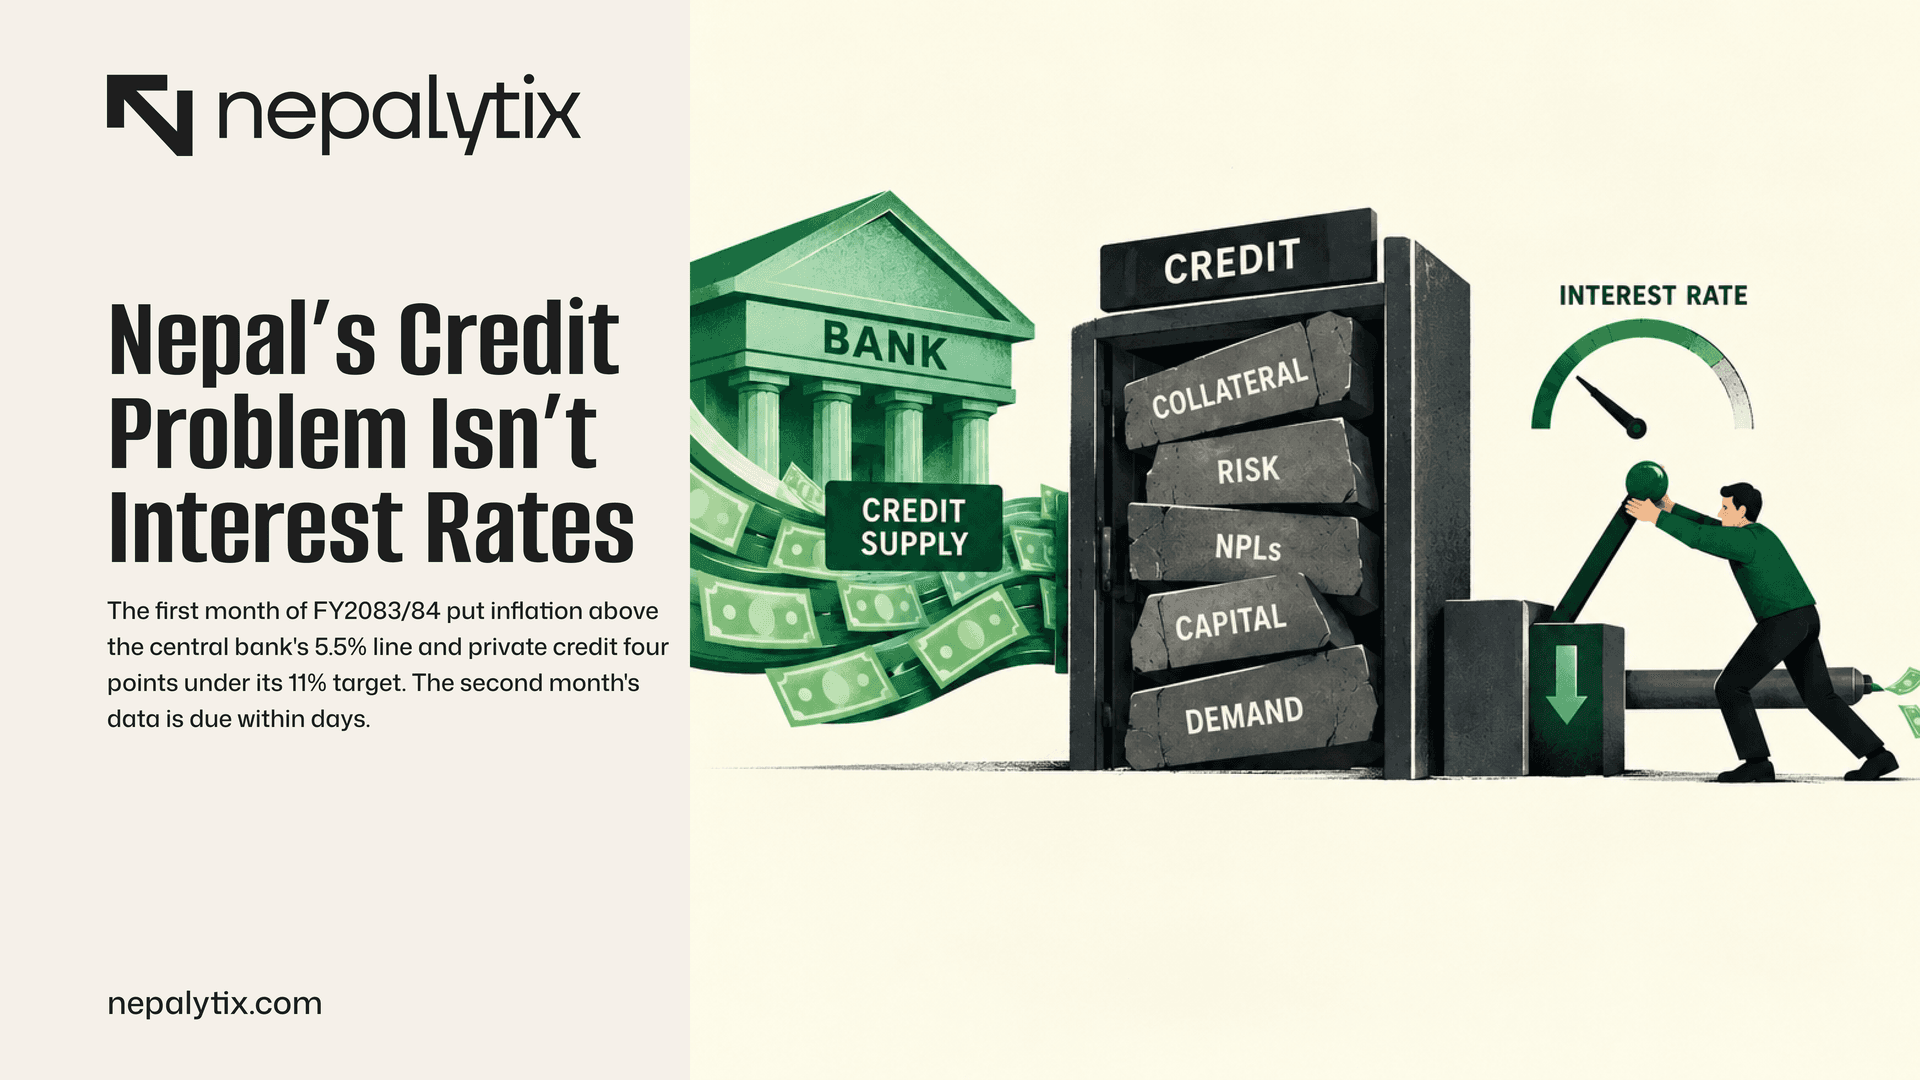
The first month of FY2083/84 put inflation above the central bank's 5.5% line and private credit four points under its 11% target. The second month's data is due within days.
The Signal
For three years, falling inflation gave Nepal Rastra Bank room to cut rates and chase credit growth. Annual inflation fell from 7.74% in FY2022/23 to 3.08% in FY2025/26. The policy rate fell from 7.0% to 4.25%. Credit growth never followed: it has missed target in seven of the last eight years.
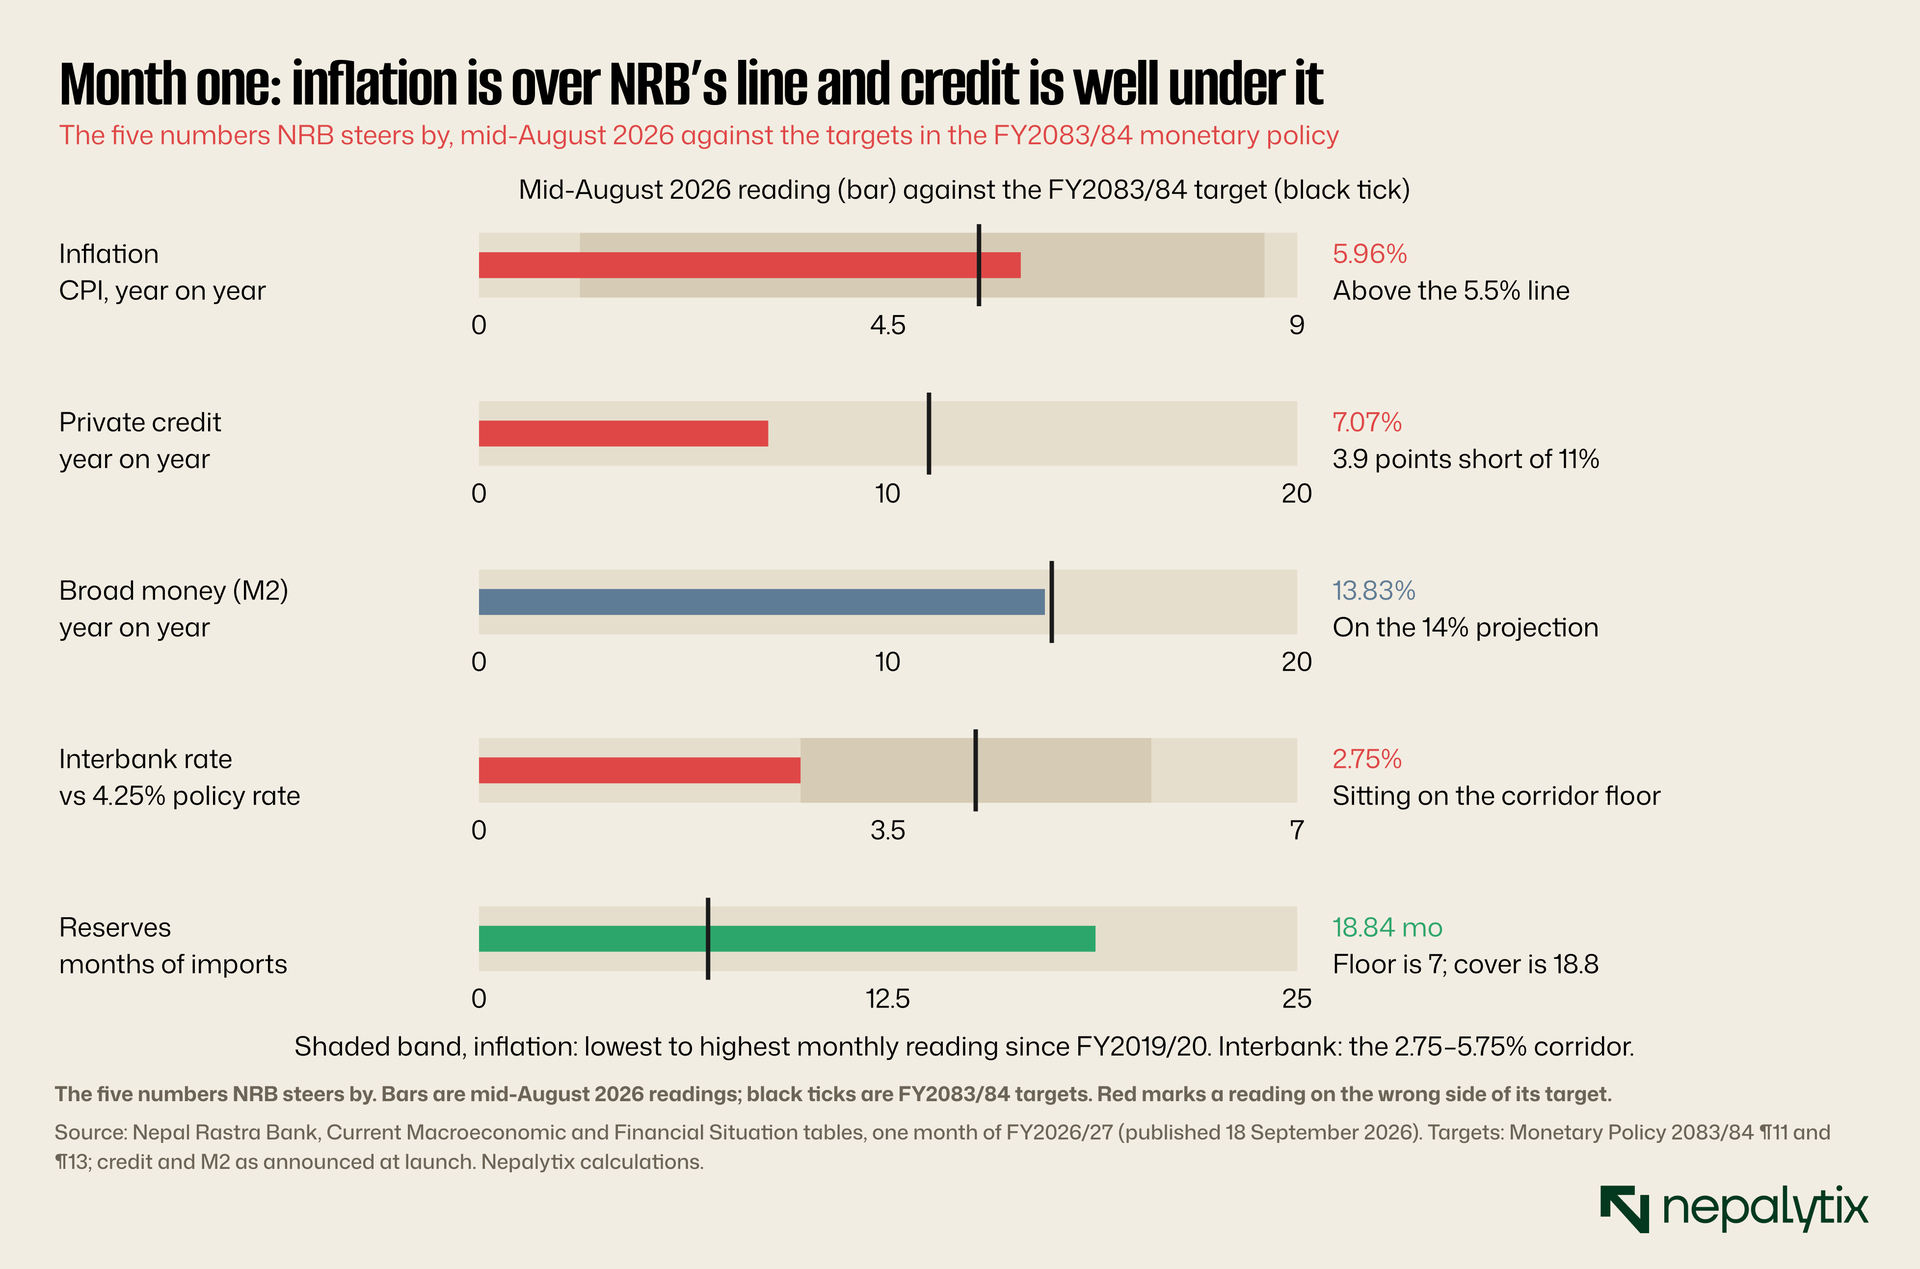
That room is now gone. Consumer prices were 5.96% higher in mid-August than a year earlier above the 5.5% NRB set for the year in the first month the target applied. Meanwhile, private credit is growing at 7.1% against an 11% target. The interbank rate sits on the floor of NRB's corridor. Money is pouring in from abroad and not being lent out.
The two problems now point in opposite directions. Inflation argues against any further easing. Weak credit argues for it. NRB's two-month report due within days is the first chance to see which one is winning.
01. The number
NRB's one-month report published on 18 September put year-on-year consumer price inflation at 5.96% in mid-August. A year earlier the figure was 1.68%. In mid-July, the last month of FY2082/83, it was 5.14%.
The rise has been steady, not sudden. Inflation bottomed at 1.11% in mid-November 2025 and has risen in eight of the nine months since. The only pause was a dip from 5.22% to 5.14% between mid-June and mid-July. Food and beverage prices are up 6.77% and non-food and services prices are up 5.52%. Both are now above the line so this is not a single food shock that will wash out.
A word on the comparison. The 5.5% in the monetary policy is a target for the year's average inflation not for any single month's year-on-year rate so one month above it is not yet a miss. NRB also said in July that it expected price pressure from fuel and food to last a few more months before easing in the fourth quarter of the fiscal year. The month-one reading is consistent with that forecast. What it removes is the cushion: there is no longer a below-target start to absorb a bad winter.
02. What is in it
The month-one figure can be split across the 23 sub-groups of the CPI basket using NRB's published weights and indices. The split adds back to 5.96 exactly.
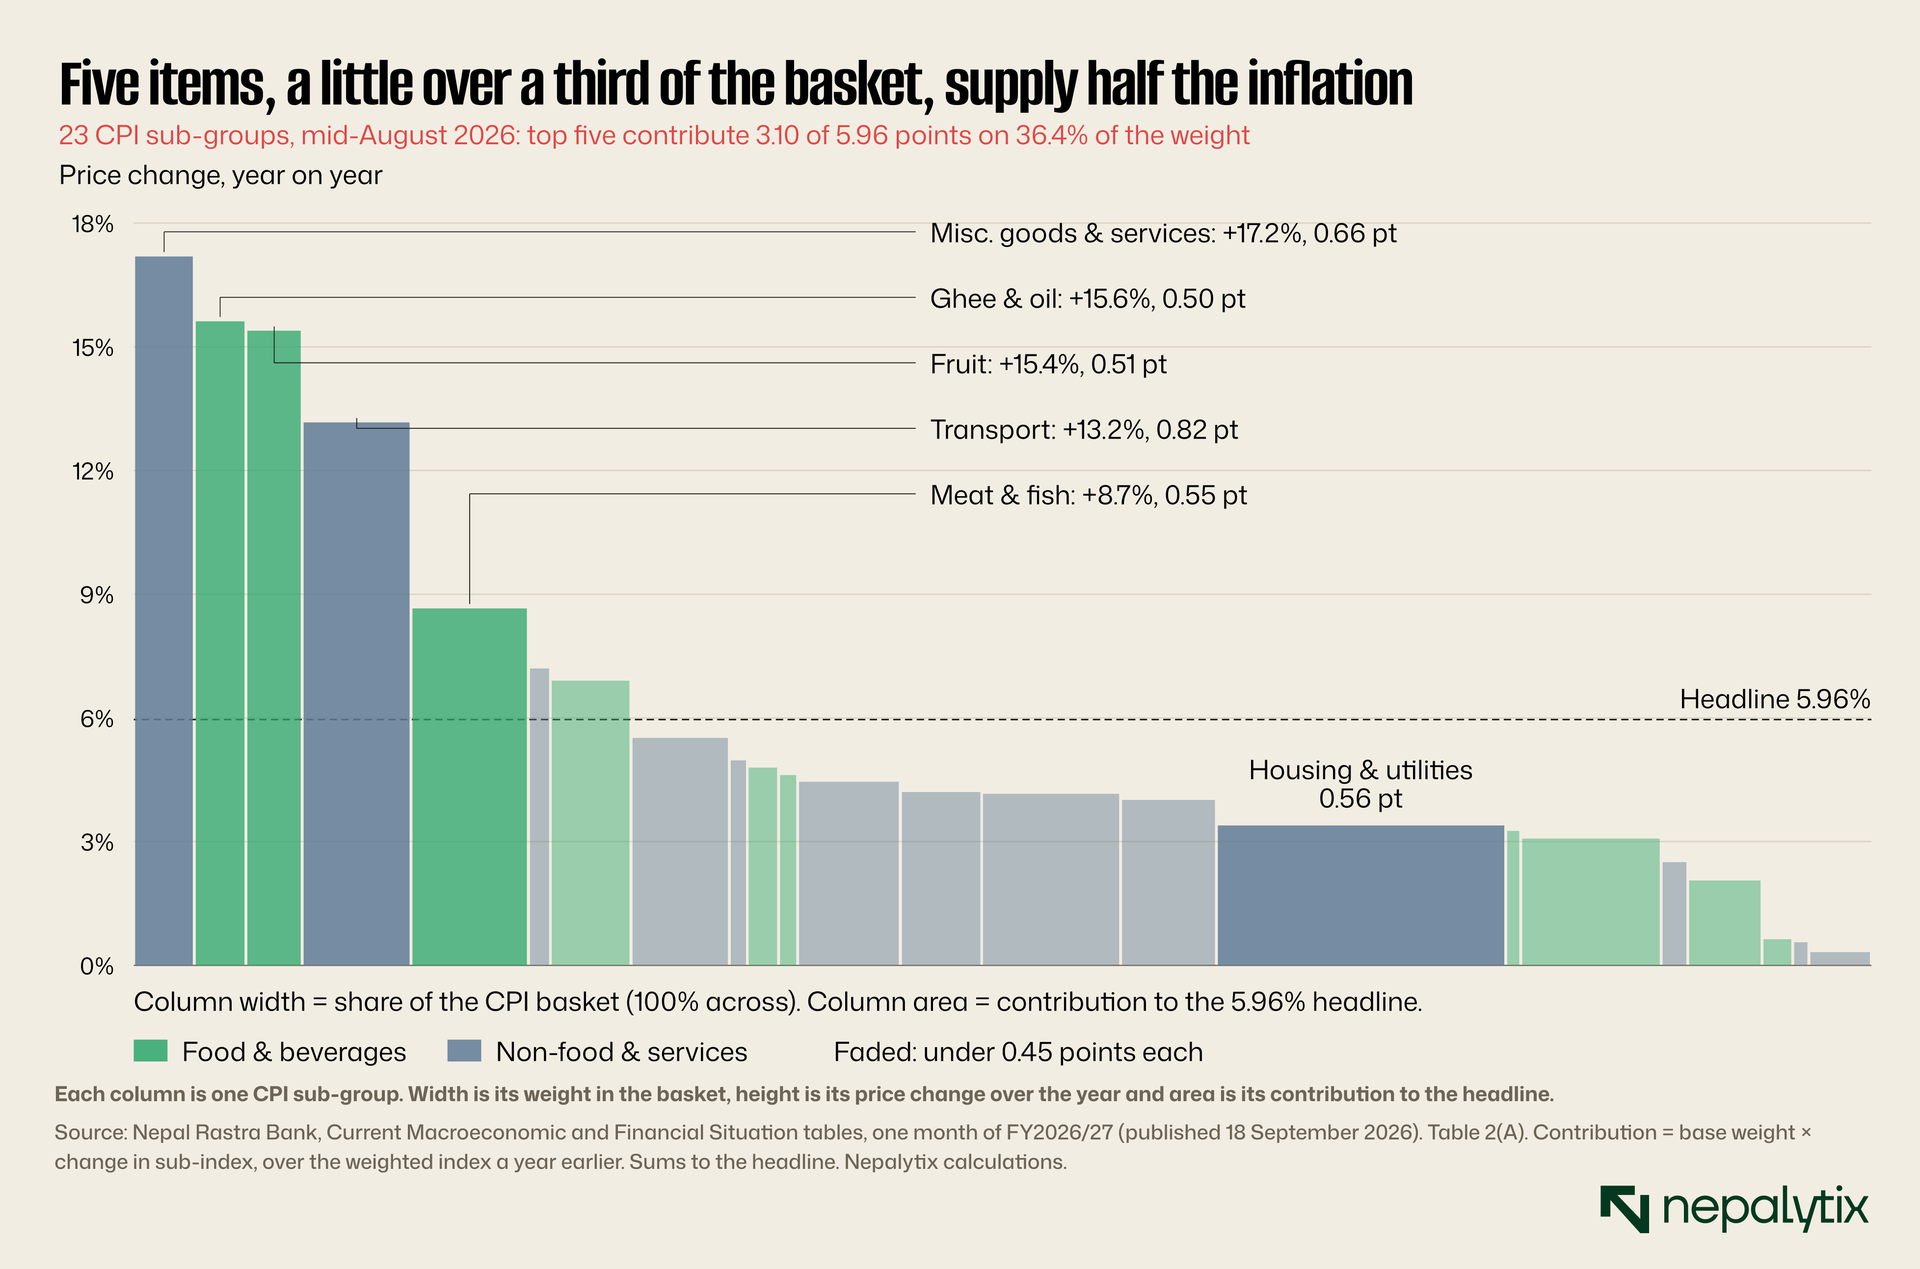
Five sub-groups supply 3.10 of the 5.96 points: transport (0.82 points), a catch-all miscellaneous goods and services group (0.66), meat and fish (0.55), fruit (0.51) and ghee and oil (0.50). Together they make up 36.4% of the basket.
Split by the two headline groups, food and beverages carry 35.5% of the basket and contribute 2.37 points. Non-food and services carry 64.5% and contribute 3.59 points. Food is punching above its weight. But three-fifths of the headline comes from the non-food side.
Housing and utilities is the largest single weight at 16.7%. It adds 0.56 points, at only 3.4% inflation. Three of the top five sit on the food side. Transport alone is up 13.2%. Ghee and oil are up 15.6%, and fruit 15.4%. These are the categories NRB named in July as the source of temporary pressure: petroleum and food. If that diagnosis is right, the pressure should be concentrated and it is.
The weaker part of the diagnosis is the spread. Of the 23 sub-groups, 15 are rising faster than 4%. Only three: communication, pulses and legumes and insurance and financial services are close to flat. Inflation driven only by fuel and edible oil would show a few tall columns and many short ones. This basket has a few tall columns and a broad shelf of medium ones.
03. Is the 5.5% already lost?
Not yet, and the arithmetic shows how close it is. Annual average inflation compares this year's average price level with last year's. Prices in mid-August already stood 3.69% above the FY2082/83 average. So if prices did not rise at all for the next eleven months, the year would still average 3.69%. To come in exactly at 5.5%, the remaining eleven months need to average 1.9% above the mid-August level.
Put as a monthly rate, that is a steady rise of about 0.31% a month from here to mid-July. Last year prices rose 0.42% a month on average over the same eleven months. A repeat of last year's pace, from this year's higher start overshoots the line.
The useful question is what a normal year looks like from here. To test it, take each of the last six fiscal years and apply its actual month-on-month price changes, Bhadra through Asar to the mid-August starting point.
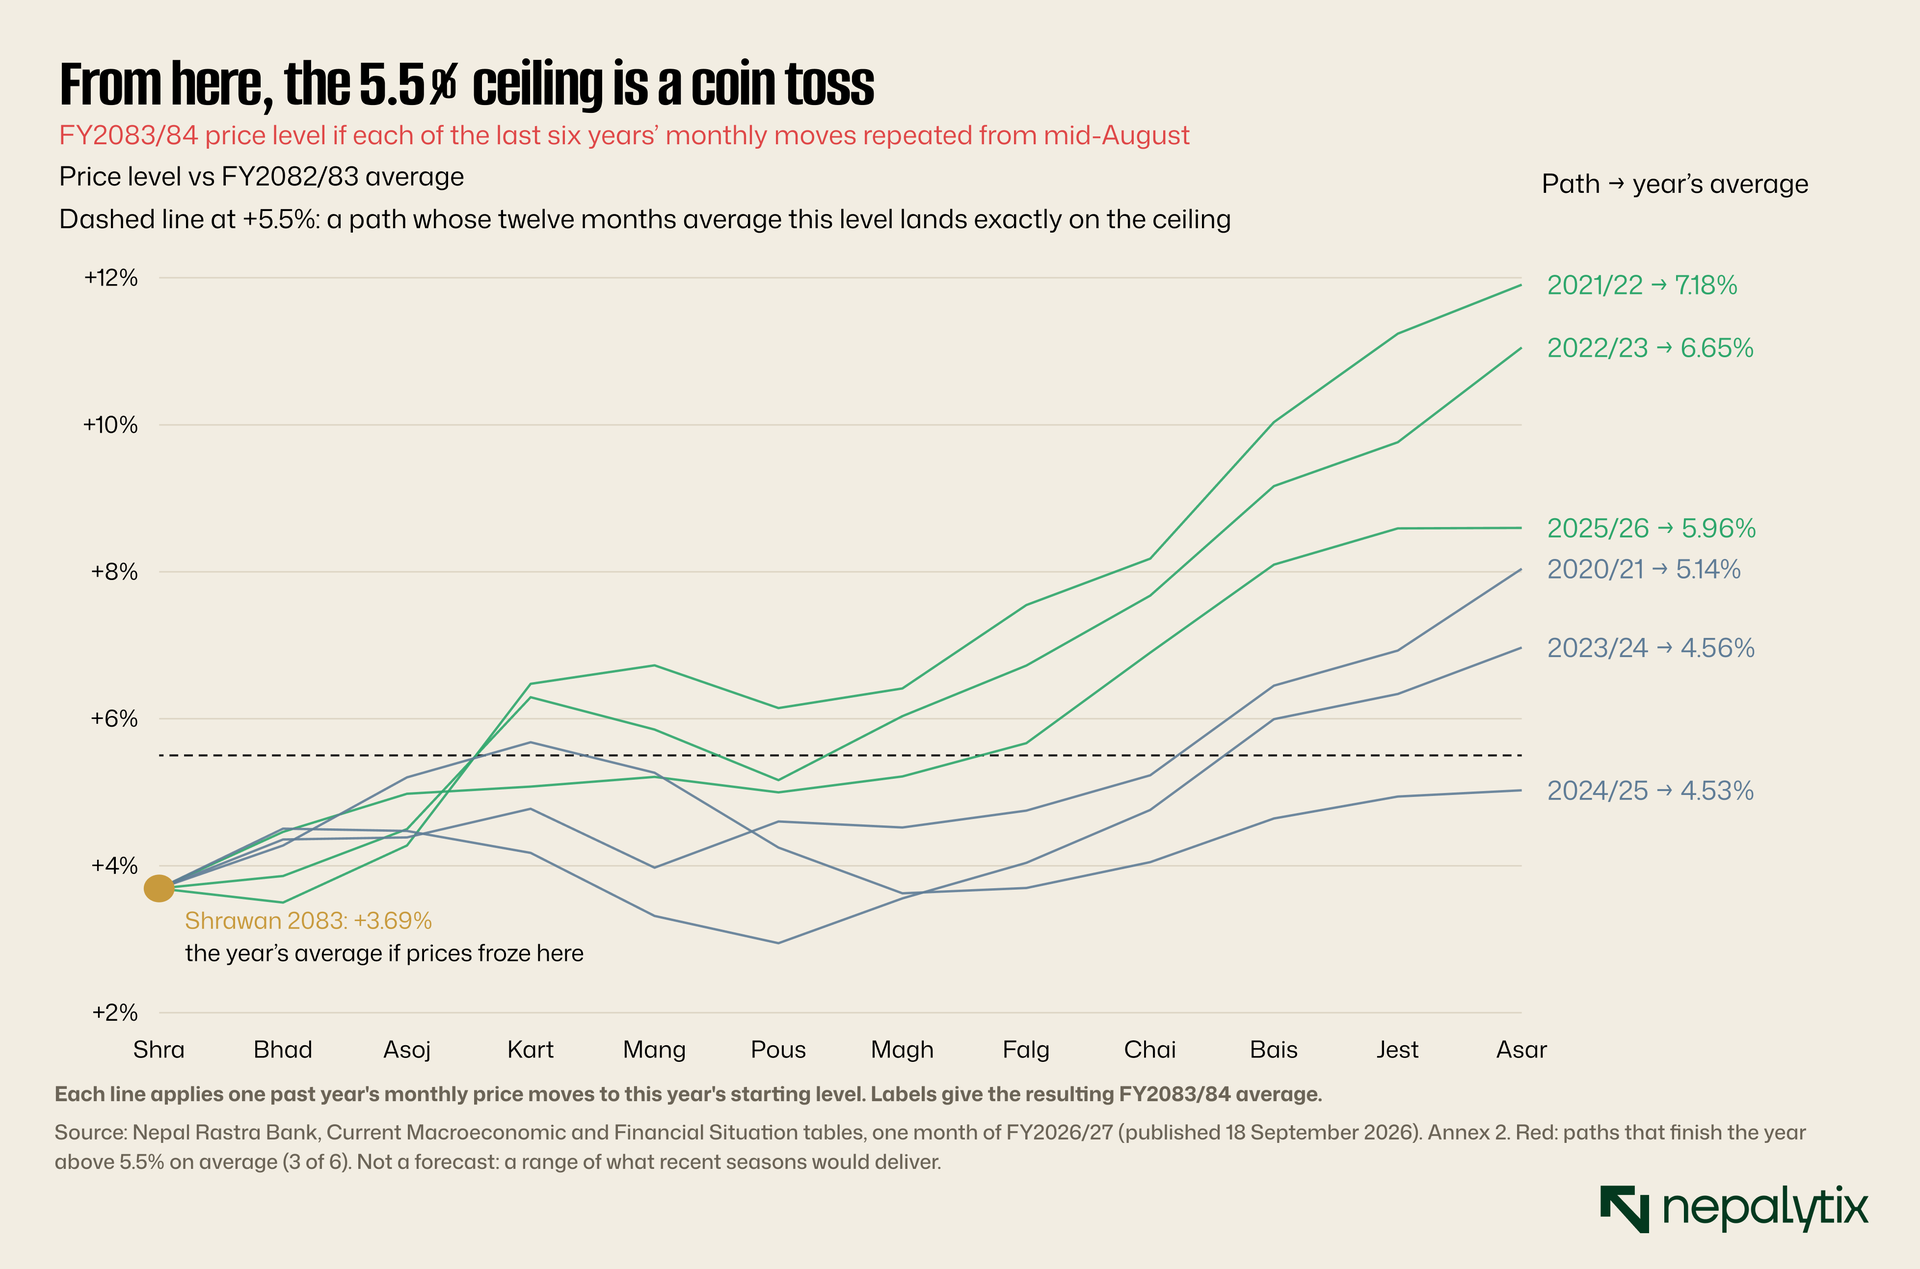
The six paths land between 4.53% and 7.18%. Three finish above 5.5% (the FY2021/22, FY2022/23 and FY2025/26 patterns) and three below (FY2020/21, FY2023/24 and FY2024/25). The median is 5.55%. The ceiling is a coin toss and the coin is slightly weighted the wrong way.
This is not a forecast. It assumes nothing changes in fuel prices, the harvest or demand and it gives equal weight to each recent year. What it shows is that NRB has no margin. A year as calm as FY2024/25 keeps the target. A year like last year when prices rose 4.7% from the first month to the last, breaches it.
04. The target NRB lands
Every monetary policy sets three numbers that can be checked a year later: average inflation, growth in broad money (M2), and growth in credit to the private sector. Lined up against outcomes from each year's own documents, the record splits cleanly.
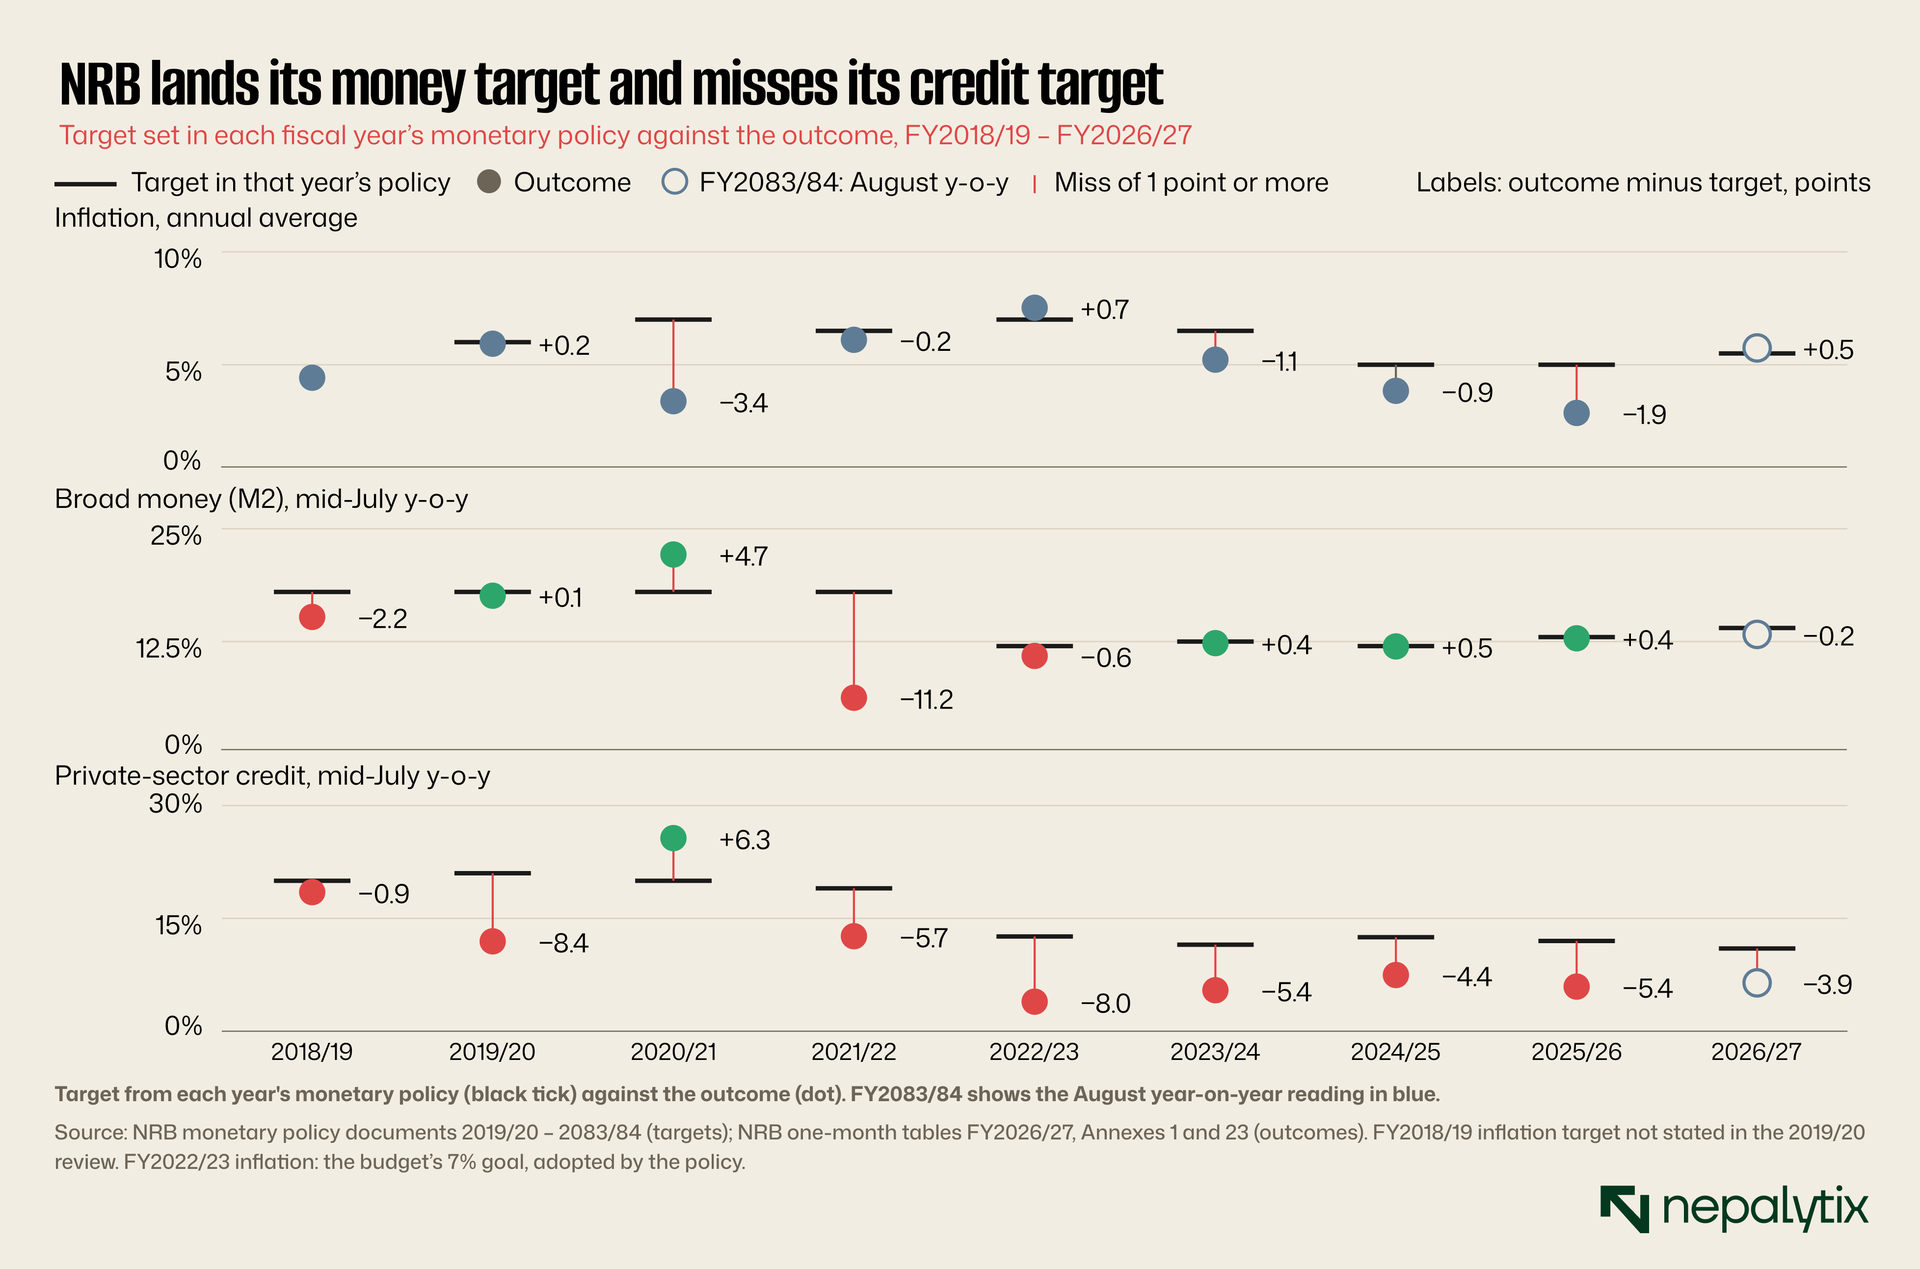
Inflation has been within about a point of target in five of seven years. It came in above in FY2019/20 by 0.15 points and in FY2022/23 by 0.74. The big misses were undershoots: 3.4 points in the pandemic year and 1.9 points last year.
Broad money is closer still. Since FY2022/23 it has landed within 0.6 points of NRB's projection four years running: 11.45% against 12%, 12.87% against 12.5%, 12.50% against 12% and 13.40% against 13%. It now stands at 13.83% against a 14% projection. On this measure, NRB looks like a central bank with precise control of money growth.
05. The target NRB misses
Credit tells the opposite story. Private-sector credit growth has come in under target in seven of the last eight years by an average of 5.6 points. The one overshoot was FY2020/21 when credit grew 26.3% against 20% in the post-lockdown boom. Since then the shortfalls have been 5.7, 8.0, 5.4, 4.4 and 5.4 points.
The targets have come down over that period, from 19% to 11% but the outcomes have come down faster. Last year credit grew 6.59% against a 12% target. This year's 11% target is the lowest in the series and it is already 3.9 points out of reach in month one.
The miss matters beyond the central bank. Commercial bank earnings depend on loan growth and on the gap between what banks charge borrowers and what they pay depositors. In mid-August the weighted average lending rate was 6.48% and the deposit rate 3.15%, a spread of 3.33 points. A year earlier the spread was 3.74 points. Two years earlier it was 4.02. Banks are lending a little more each year at a narrower margin. A credit target that is missed by five points a year is also a forecast of bank earnings that keeps being missed.
That the two records diverge so sharply is the interesting part. In a normal banking system, broad money and private credit move together because most new money is created when banks lend. If NRB hits one and misses the other by five points a year, the money must be coming from somewhere else.
06. Where the money comes from
Broad money growth can be split into two sources. Net foreign assets come mostly from remittances and the surplus on the balance of payments. Net domestic assets come mostly from credit, net of capital and other non-monetary liabilities.
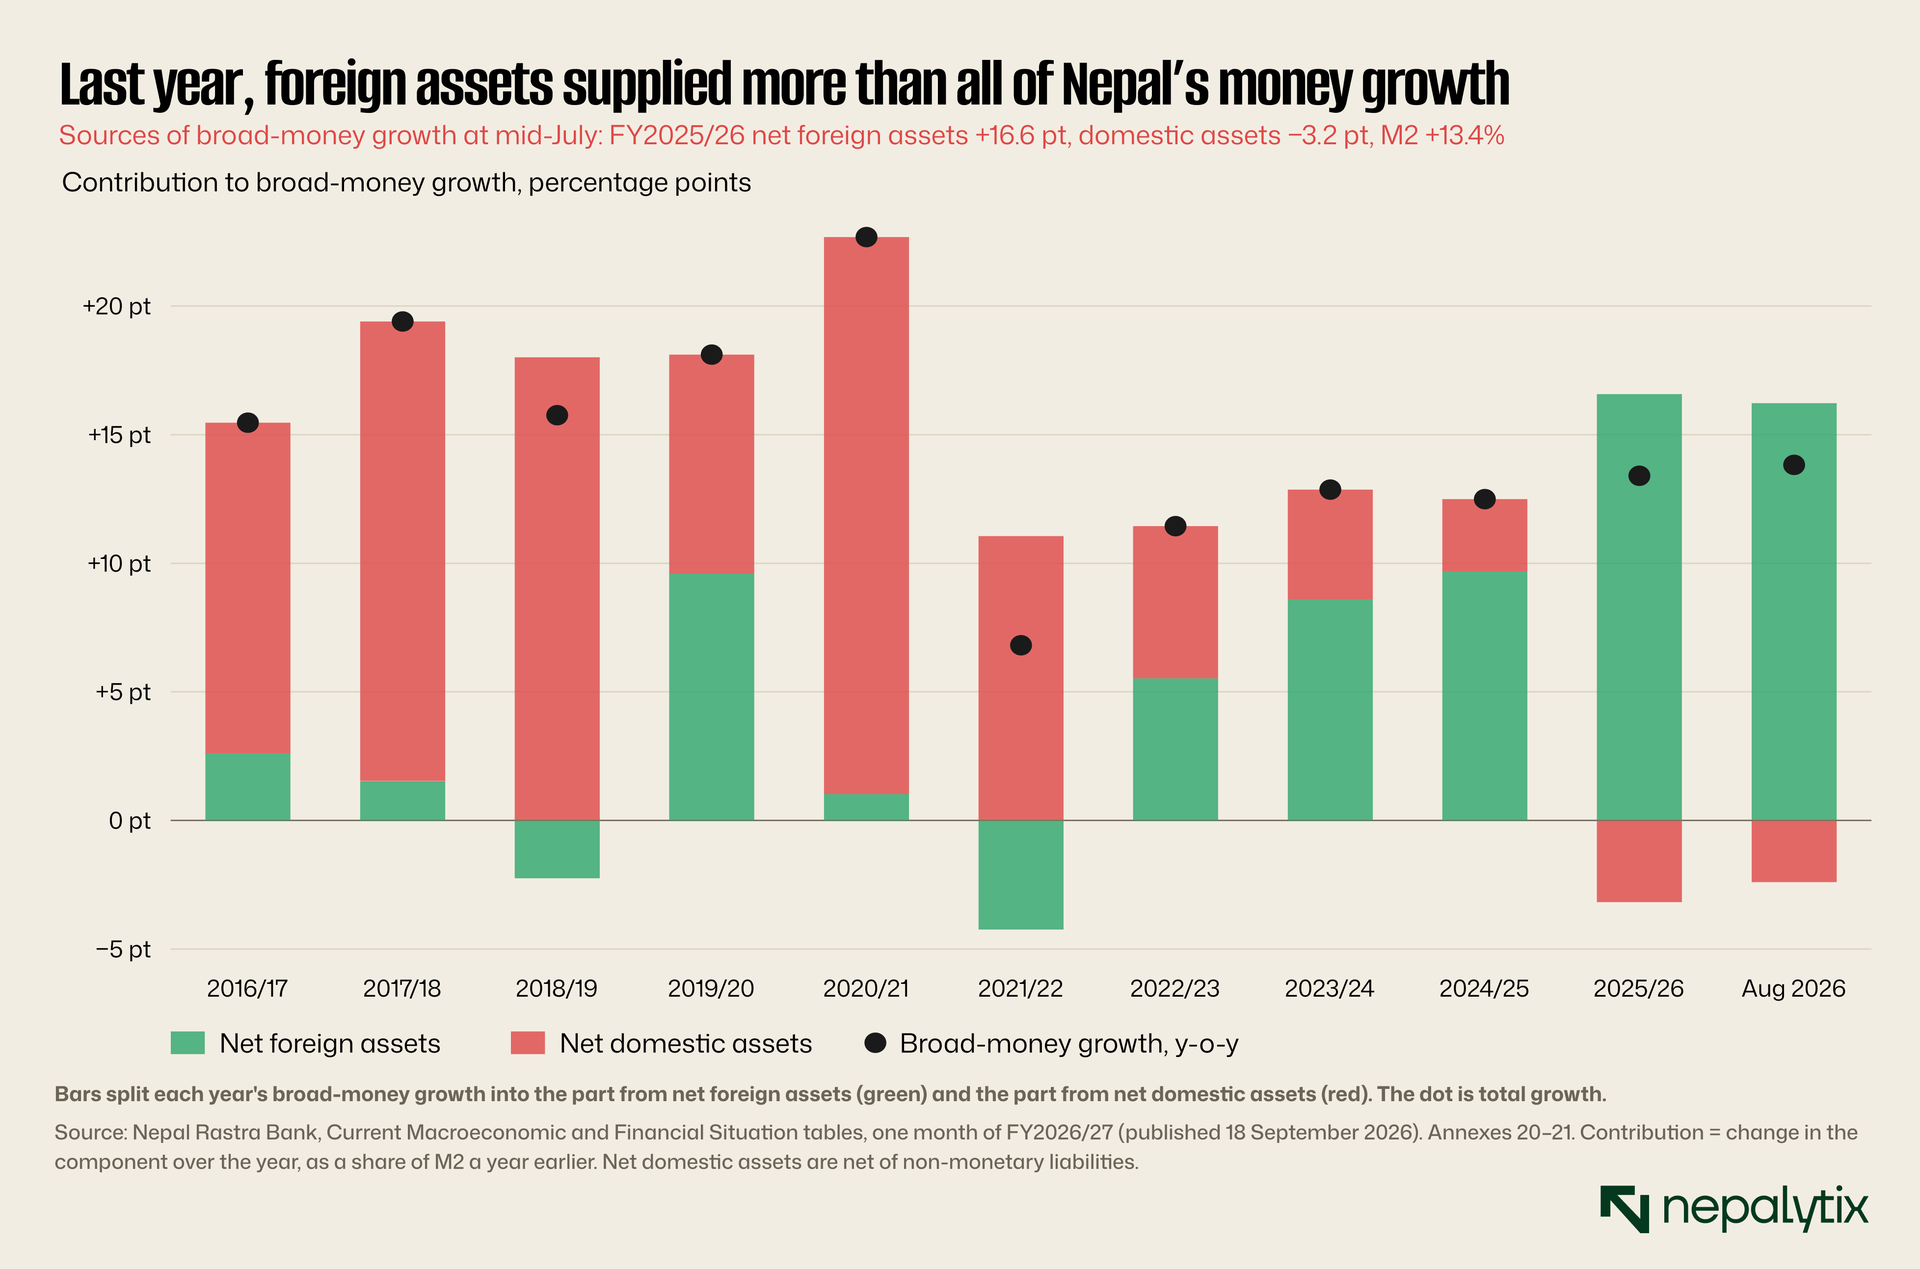
Until FY2018/19, foreign assets contributed between −2.3 and +2.6 points a year. Nearly all money growth came from domestic lending. Since FY2022/23 the balance has flipped. Last year, net foreign assets added 16.6 points to M2 while net domestic assets subtracted 3.2 points. Total growth was 13.4%. Foreign inflows supplied more than all of it and the domestic side shrank. In August 2026 the split was 16.2 points against −2.4.
The first month continued the pattern. The current account showed a surplus of Rs94.59 billion and the overall balance of payments a surplus of Rs90.34 billion. Exports rose 61.7% with soyabean and palm oil among the gainers and imports rose 31.0%. In a month when imports grew by almost a third, the external accounts still added to Nepal's money stock rather than draining it.
This is why the M2 target is so easy to hit and the credit target so hard. M2 is now mostly a measure of remittances and the external surplus. Remittance inflows were up 21.2% in the first month at Rs215.05 billion. Reserves cover 18.8 months of imports against a floor of seven. NRB does not control these inflows and does not need to. M2 lands near target because the inflows have been steady.
Credit is a different question. It measures whether anyone wants to borrow. The money arriving from abroad is being parked rather than lent. Total deposits rose 14.5% over the year to mid-August. Within that, saving and call deposits grew 42.7% while time deposits fell 15.4% as deposit rates dropped.
07. The floor
The clearest sign of that surplus is the interbank rate. Under the monetary policy, NRB's operating target is to keep the weighted average interbank rate close to the policy rate inside a corridor. The corridor's floor is the rate at which NRB absorbs surplus funds and its ceiling is the rate at which it lends against collateral.
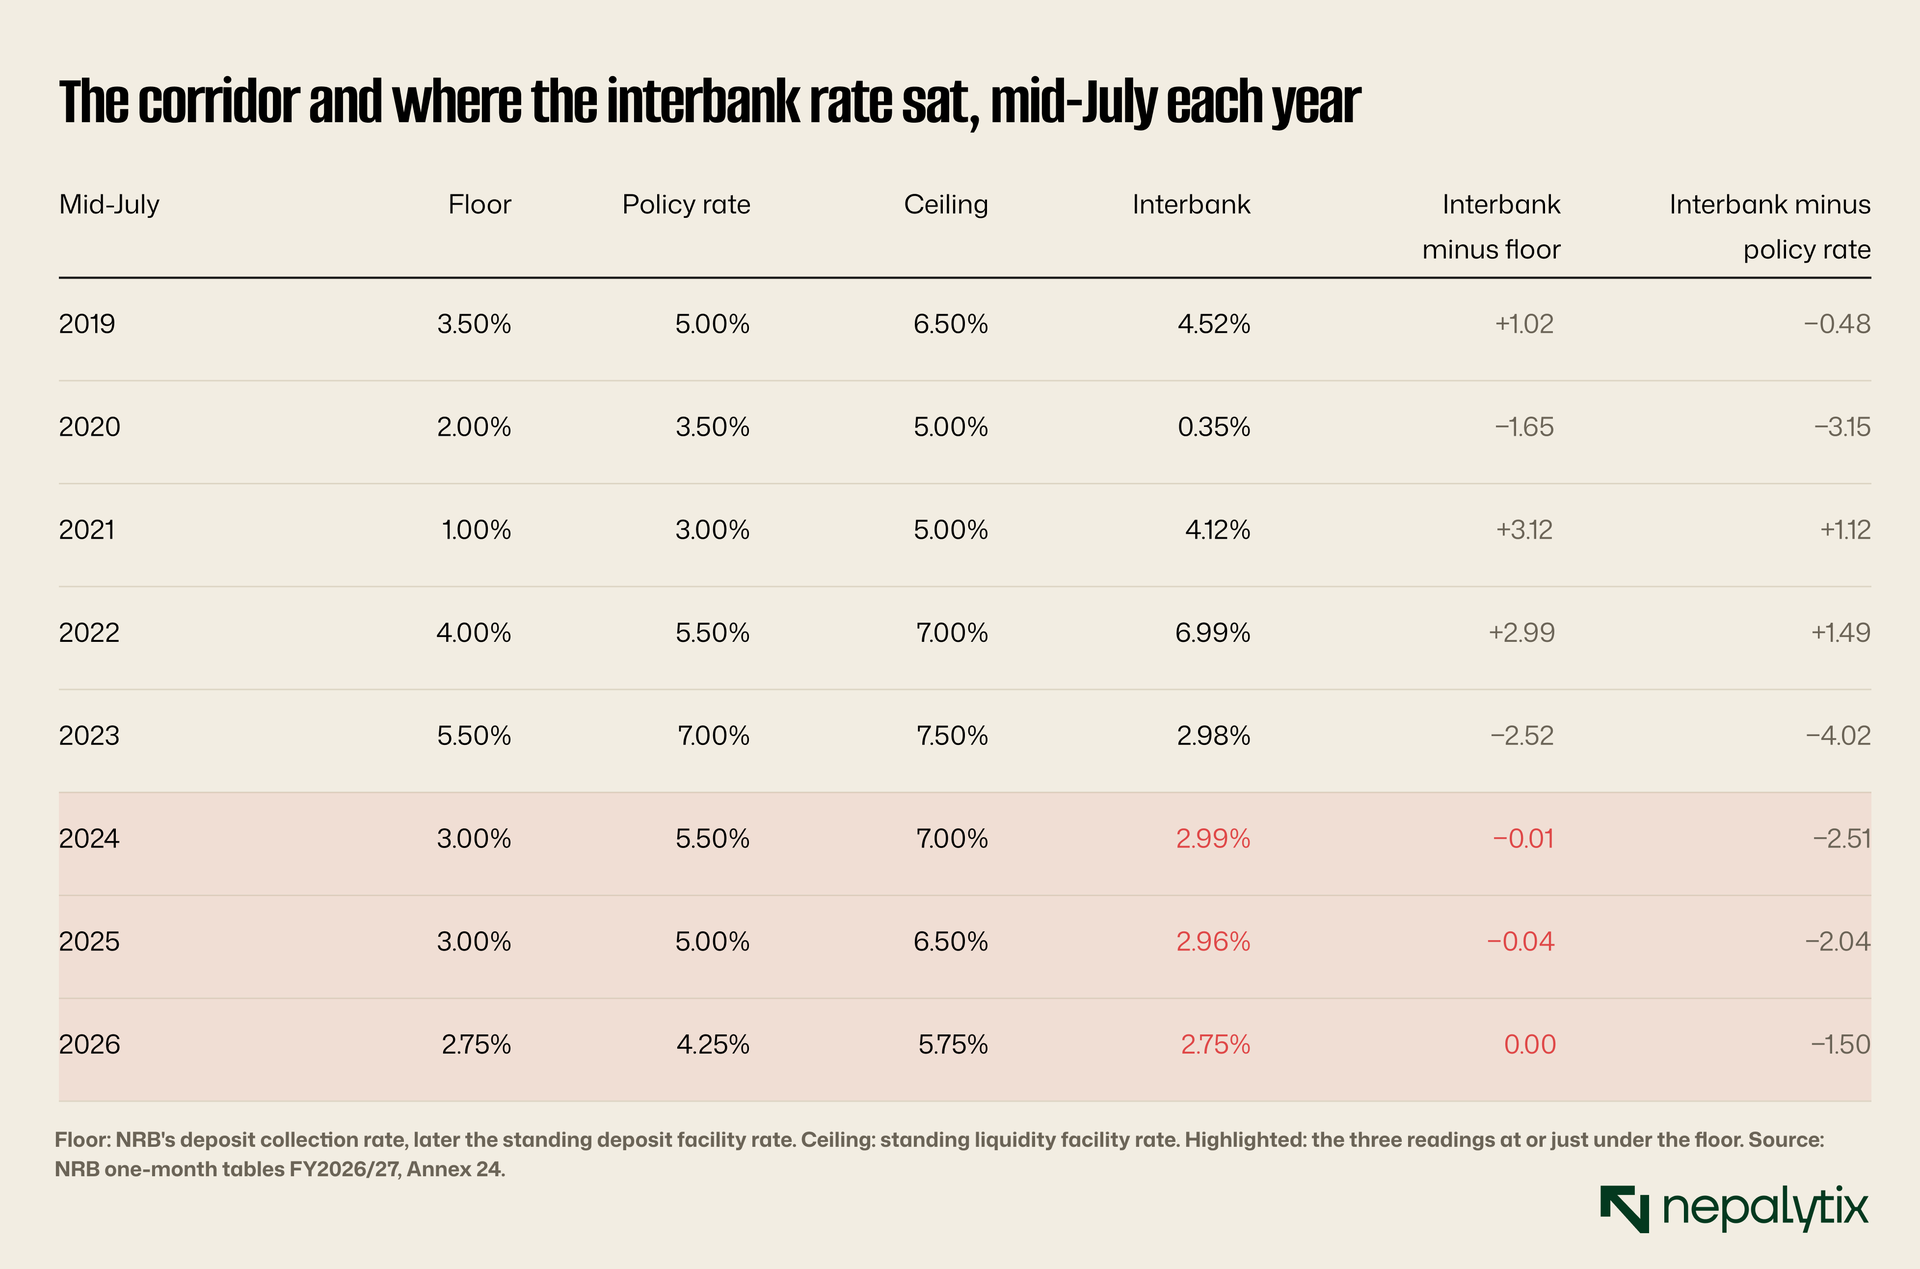
At each of the last three mid-July readings, the interbank rate sat on the floor or a few basis points under it: 2.99% against a 3.0% floor in 2024, 2.96% against 3.0% in 2025, and 2.75% against 2.75% in 2026. In the first month of FY2083/84 it stood at 2.75%, 1.5 points below the 4.25% policy rate it is meant to track.
A rate pinned to the floor means banks have more cash than they can lend at any price above what NRB pays for deposits. Cutting the policy rate further would lower the floor and drag the interbank rate down with it. That would do little for credit demand which is not being held back by the price of funds. Commercial banks weighted average lending rate is already 6.48%, the lowest reading in the 121 months NRB tabulates since FY2016/17.
08. India is not the whole explanation
The rupee's peg to the Indian rupee usually keeps Nepali inflation close to India's and an Indian price shock is the first suspect whenever Nepali prices rise. It is a partial suspect this time. India's year-on-year CPI inflation was 4.82% in August 2026, 1.14 points below Nepal's.
Over the 37 months NRB tabulates since FY2023/24, Nepal's inflation has run on average 0.34 points above India's. The gap exceeded one point in only six of those months and two of the six are among the last four readings. Nepal's inflation is pulling away from India's which points to domestic sources as well as imported ones: transport, a catch-all goods group and services sit alongside food at the top of the contribution chart.
09. The wholesale question
Wholesale prices rose 8.27% over the year to mid-August and intermediate goods 13.62%. A WPI running two points above the CPI is often read as an early warning: costs that have hit producers and will reach shop prices next. The data offers some support for that reading but less than it seems.
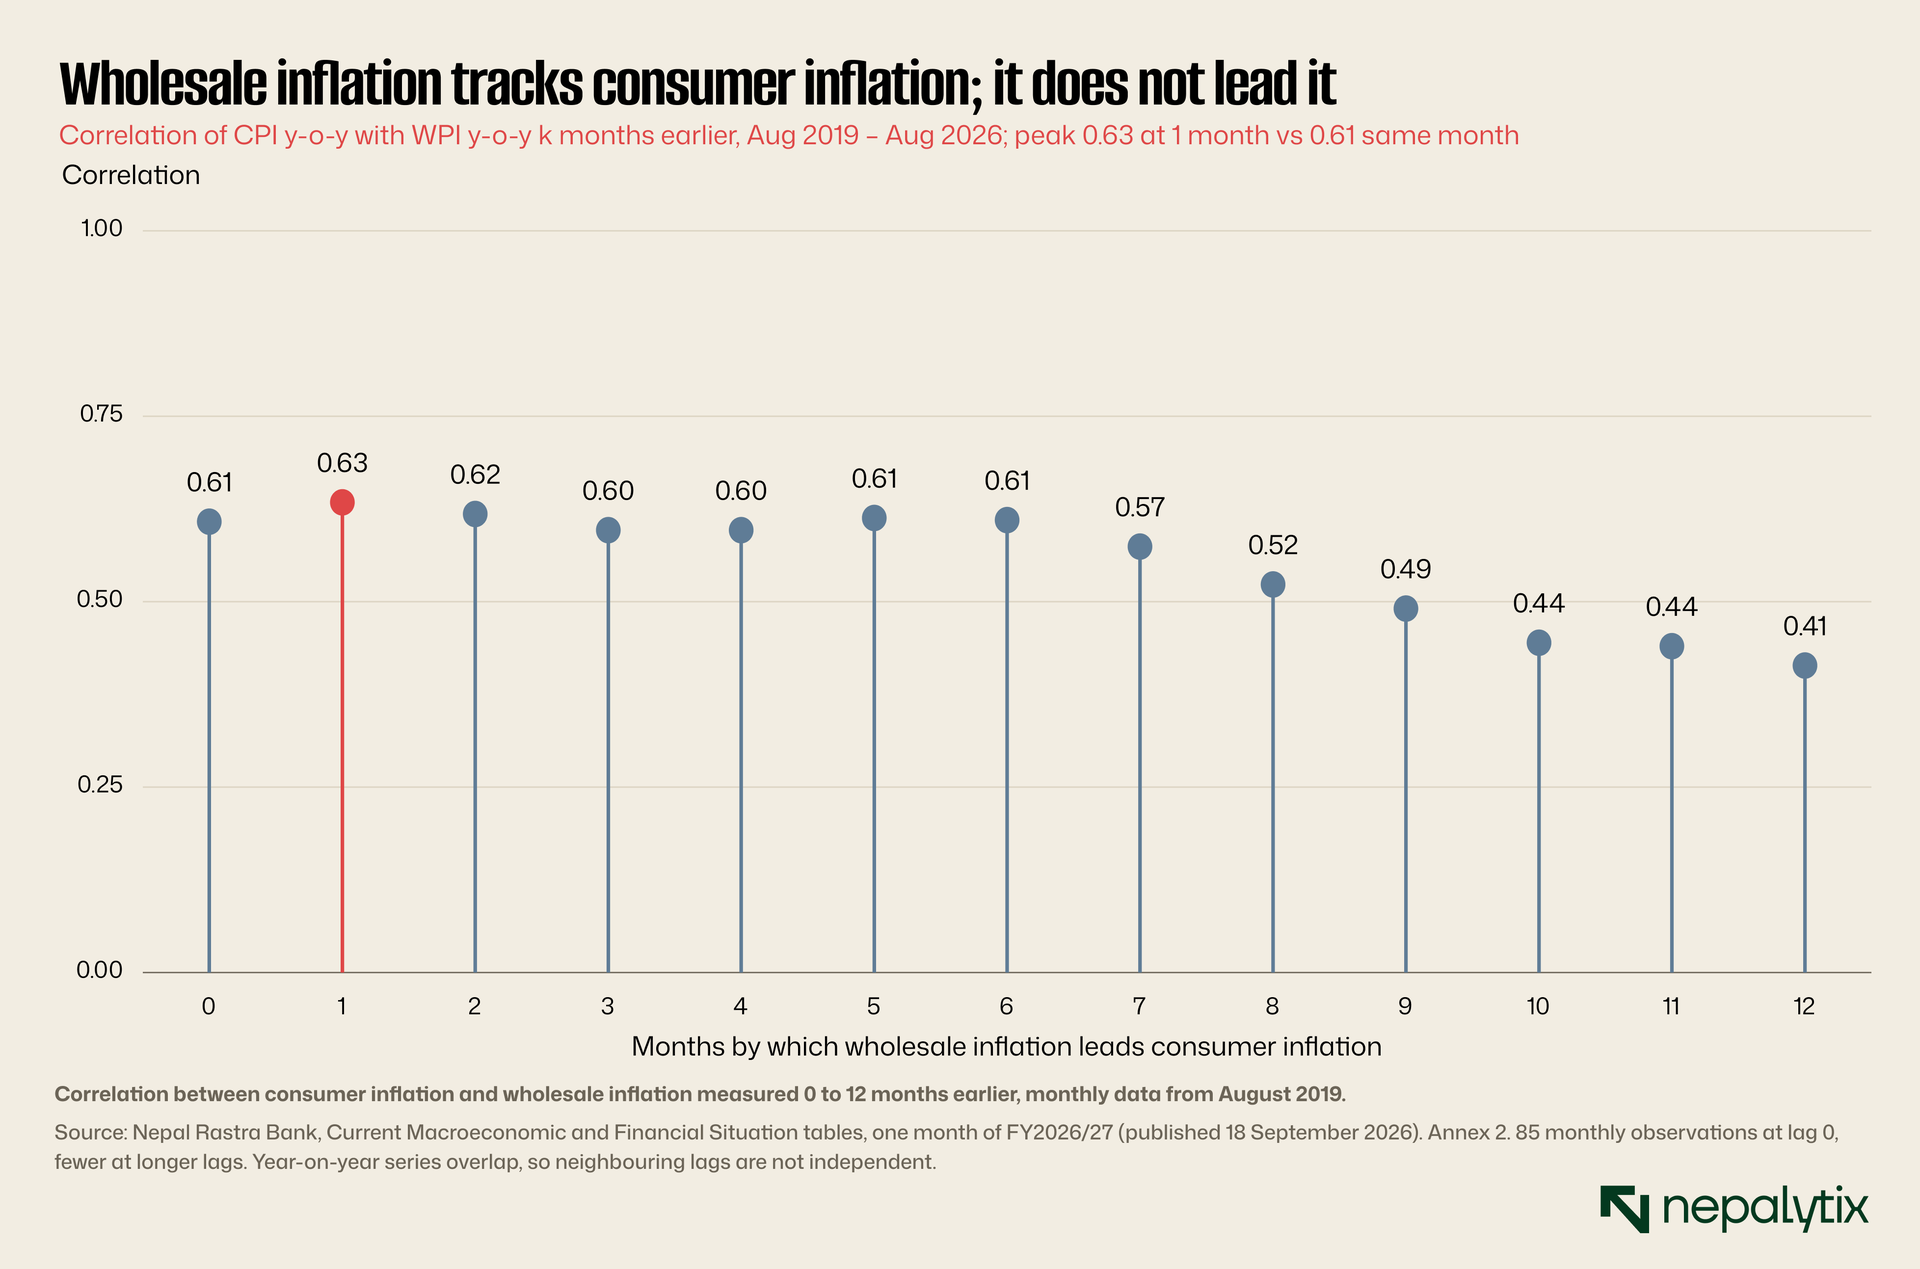
Since August 2019, CPI and WPI inflation have moved together with a correlation of about 0.6. That correlation barely changes whether wholesale inflation is measured in the same month (0.61), one month earlier (0.63) or six months earlier (0.61). A series that genuinely led would show a clear peak at some lag. This one shows a plateau which is what two slow-moving series with a shared driver look like.
So the 8.27% WPI reading confirms the direction. It does not by itself predict a jump in the CPI next month. It is a reason to take the 5.96% seriously not a reason to expect 8%.
10. The bind
NRB's policy in July was explicit about the trade-off it was making. It kept the policy rate, the floor and the bank rate unchanged, continued what it calls a cautiously flexible stance and said that stance would be reviewed if conditions changed. The first month's data is the beginning of such a change.
On the evidence here, the bank's two problems need different tools. Inflation is concentrated in fuel, food and a few service categories and it is now above India's. The case for further rate cuts, which had rested on low inflation has weakened. The credit shortfall meanwhile is not a price problem: the interbank rate is already at the floor and lending rates are at series lows. Cheaper money has not produced borrowing for three years and a fourth cut is unlikely to.
The July policy does contain a tool aimed at the right problem. It says NRB will encourage commercial banks to invest in foreign government securities and will carry out sterilised intervention when it buys foreign currency. Both soak up the domestic liquidity that foreign inflows create, without lowering the policy rate. That is the instrument the month-one data calls for. Absorbing the surplus would lift the interbank rate off the floor, closer to the policy rate it is supposed to track. It would also take some pressure off prices without pretending that cheaper money can manufacture loan demand.
Our view is that NRB should stop publishing the credit target as if it were a policy lever. It is a forecast of demand that NRB does not control and it has missed by five points a year on average. Publishing it next to its own track record, seven misses in eight years would be more honest and more useful to anyone pricing bank shares. Bank earnings growth depends on exactly that credit number.
11. What to watch this week
NRB published last year's two-month report on 14 October. This year's covers the period to mid-September and could land during the Dashain break. Five readings matter.
Inflation. Above 6% year on year would mean a second month over the line and a higher starting point for the annual average. Below 5.5% would fit NRB's July forecast that the pressure is temporary.
Transport and ghee and oil. If the pressure is fuel and edible oil as NRB says, these two should do most of the work again. If the medium-sized categories keep rising, the pressure is broader than NRB's diagnosis.
Private credit. Anything under 8% year on year keeps the 11% target out of reach.
Remittances. Inflows rose 21.2% in rupee terms in the first month but only 10.2% in dollar terms; the difference is the rupee's weakness against the dollar. Dollar growth is the cleaner read on how much more money workers are actually sending. A slowdown there would be the first sign the external surplus and with it M2 growth, is cooling.
Interbank. If it moves off 2.75%, the surplus is starting to shrink. If it stays on the floor, nothing in the monetary transmission has changed.
Disclaimer
This report has been prepared by Nepalytix for informational and educational purposes only and does not constitute investment advice, an offer, or a solicitation to buy or sell any securities.
The information contained in this report is based on sources believed to be reliable; however, Nepalytix does not guarantee its accuracy, completeness, or timeliness. Opinions, estimates, and projections expressed herein are those of the authors as of the date of publication and are subject to change without notice.
Investing in securities involves risks, including the possible loss of principal. Past performance is not indicative of future results. Readers are advised to conduct their own independent research and consult with a qualified financial advisor before making any investment decisions.
Nepalytix and its contributors may hold positions in the securities discussed in this report at the time of publication or thereafter.
Neither Nepalytix nor any of its affiliates accept any liability for any loss arising from the use of this report or its contents.