Nepal’s Liquidity Trap: Record Remittances, Idle Cash and an Economy That Can’t Absorb Growth
Nepal’s external economy is booming. Remittances are surging, forex reserves are at record highs and the balance of payments surplus has doubled. But beneath the headlines lies a deeper structural problem: banks are flooded with liquidity while productive sectors struggle to absorb credit.

Nepal's external accounts have never looked stronger. Reserves are at a record. Remittance growth is the strongest in eight years. The balance of payments surplus has doubled. And yet credit to the productive economy is decelerating, the rupee is depreciating, government capex is falling and the central bank is mopping up Rs 35 trillion in excess liquidity. The disconnect between the external boom and the domestic stall is the signal of the year.
Nepal Rastra Bank's Current Macroeconomic and Financial Situation report based on nine months of FY 2025/26 data published May 11, 2026 covers everything through mid-April. The headline numbers will be read as triumphant by ministerial press releases. They shouldn't be. Read together, they describe an economy with abundant external liquidity that isn't reaching the productive economy.
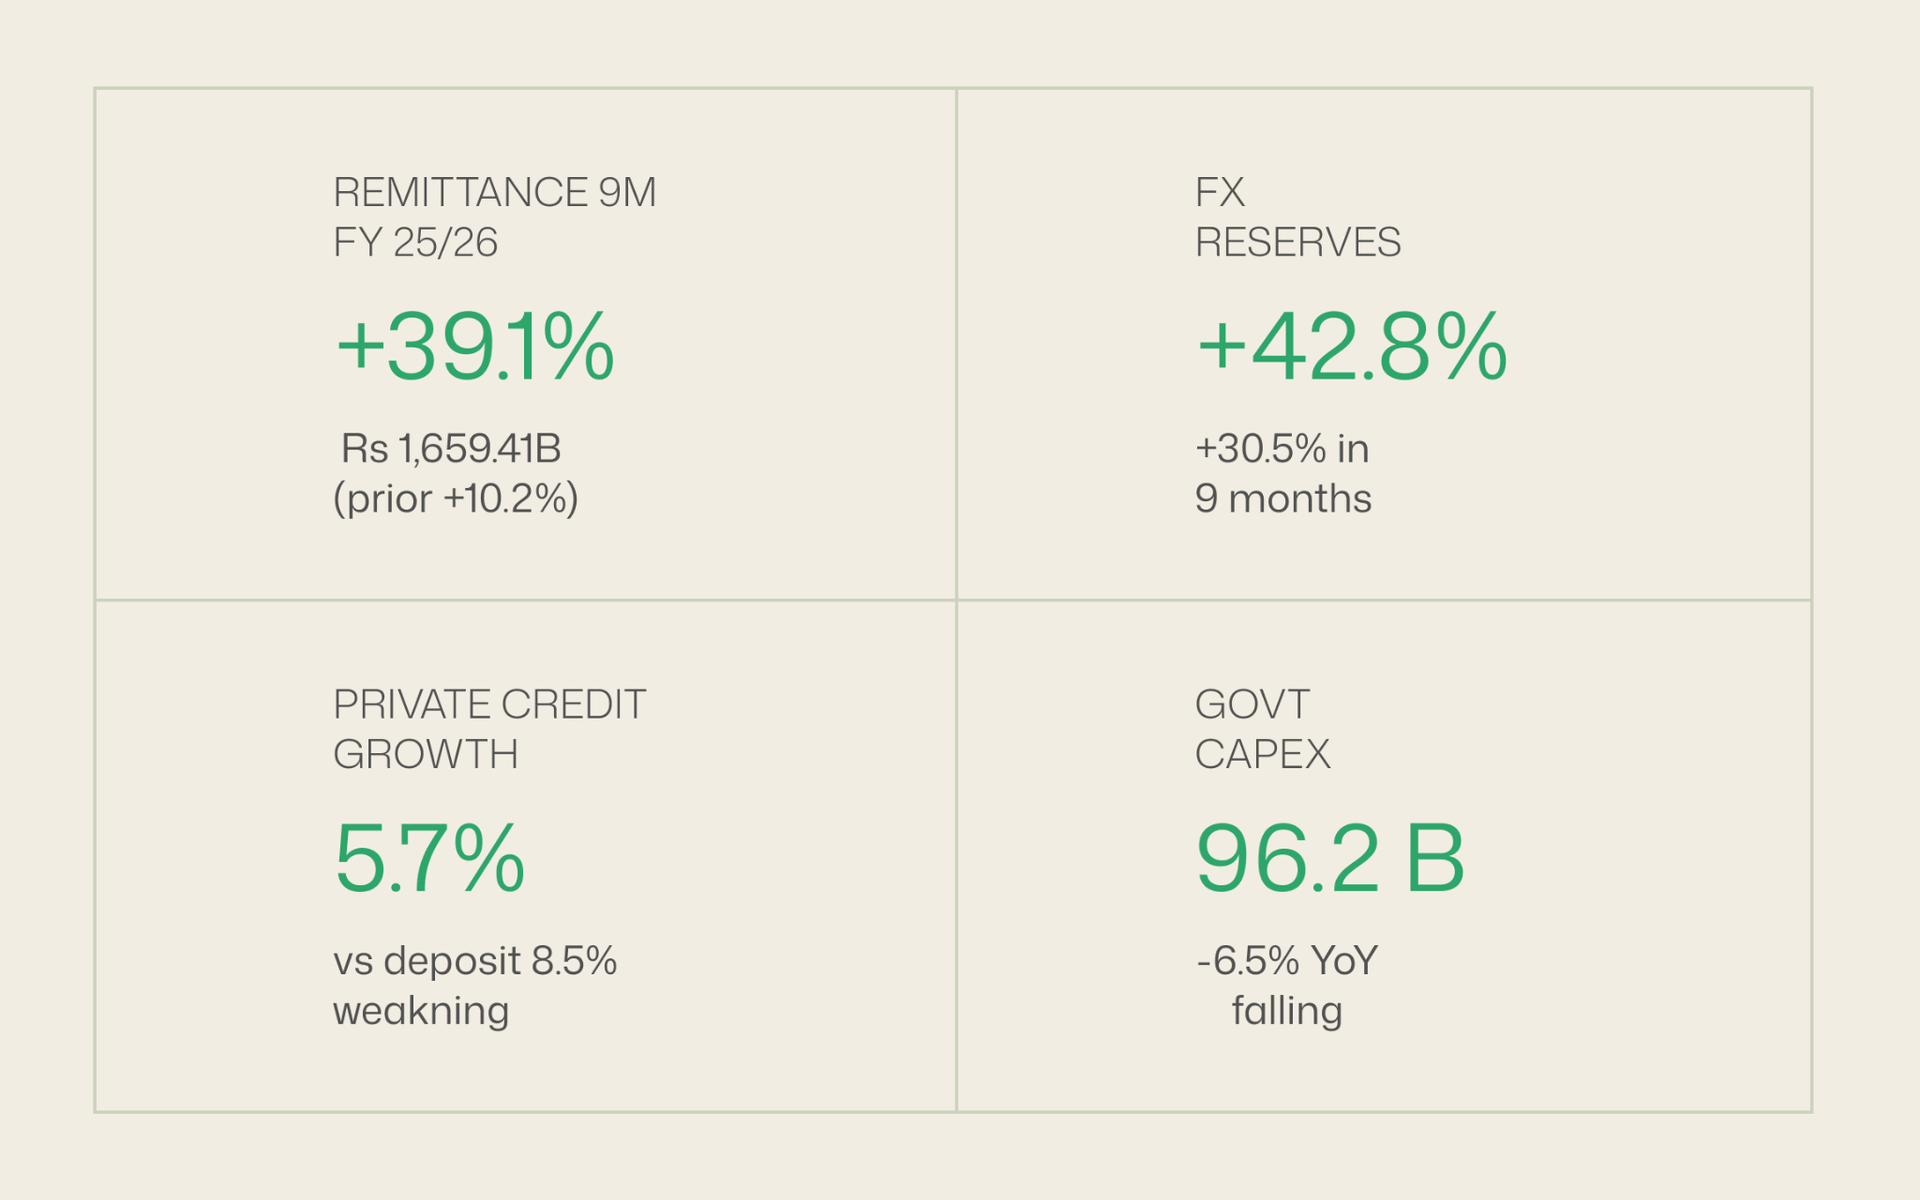
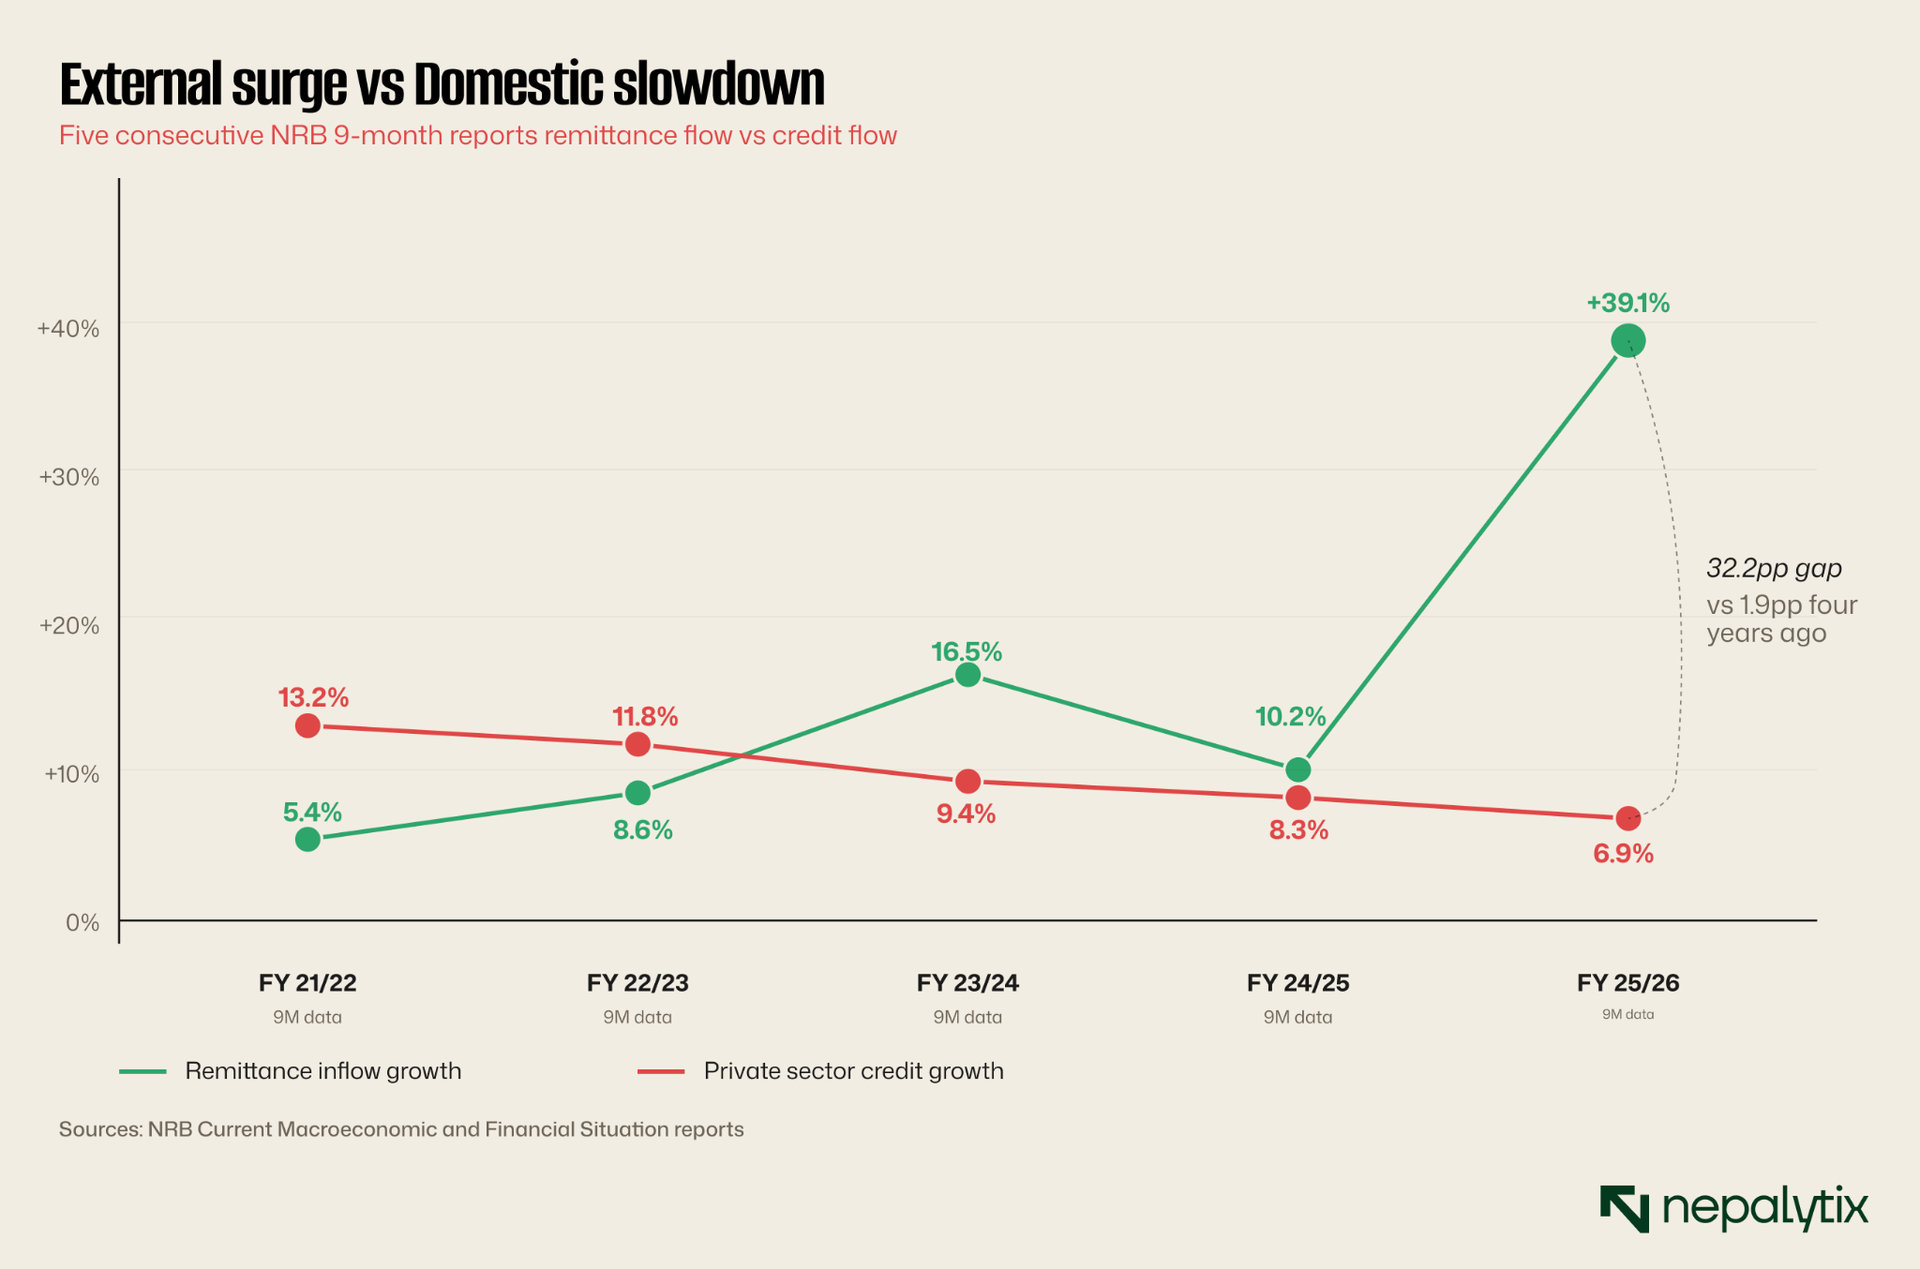
Start with what's working. Remittances rose 39.1 percent year over year, the strongest nine-month growth rate since 2017/18. In USD terms, inflows hit 11.55 billion. The Chaitra month alone (mid-March to mid-April) brought in Rs 209.75 billion, half again what came in the same month a year ago. Net secondary income (which includes worker remittances and other transfers) reached Rs 1,820.42 billion up from Rs 1,303.12 billion. The balance of payments closed the period at a surplus of Rs 731.16 billion, more than double the Rs 346.23 billion in the prior year. Foreign exchange reserves climbed to Rs 3,494.73 billion (USD 23.55 billion) sufficient to cover 18.4 months of merchandise and services imports. The reserves-to-GDP ratio hit 57.2 percent, up from 43.8 percent nine months earlier. By any external solvency measure, Nepal has rarely been stronger.
Credit growth is decelerating despite cheap money
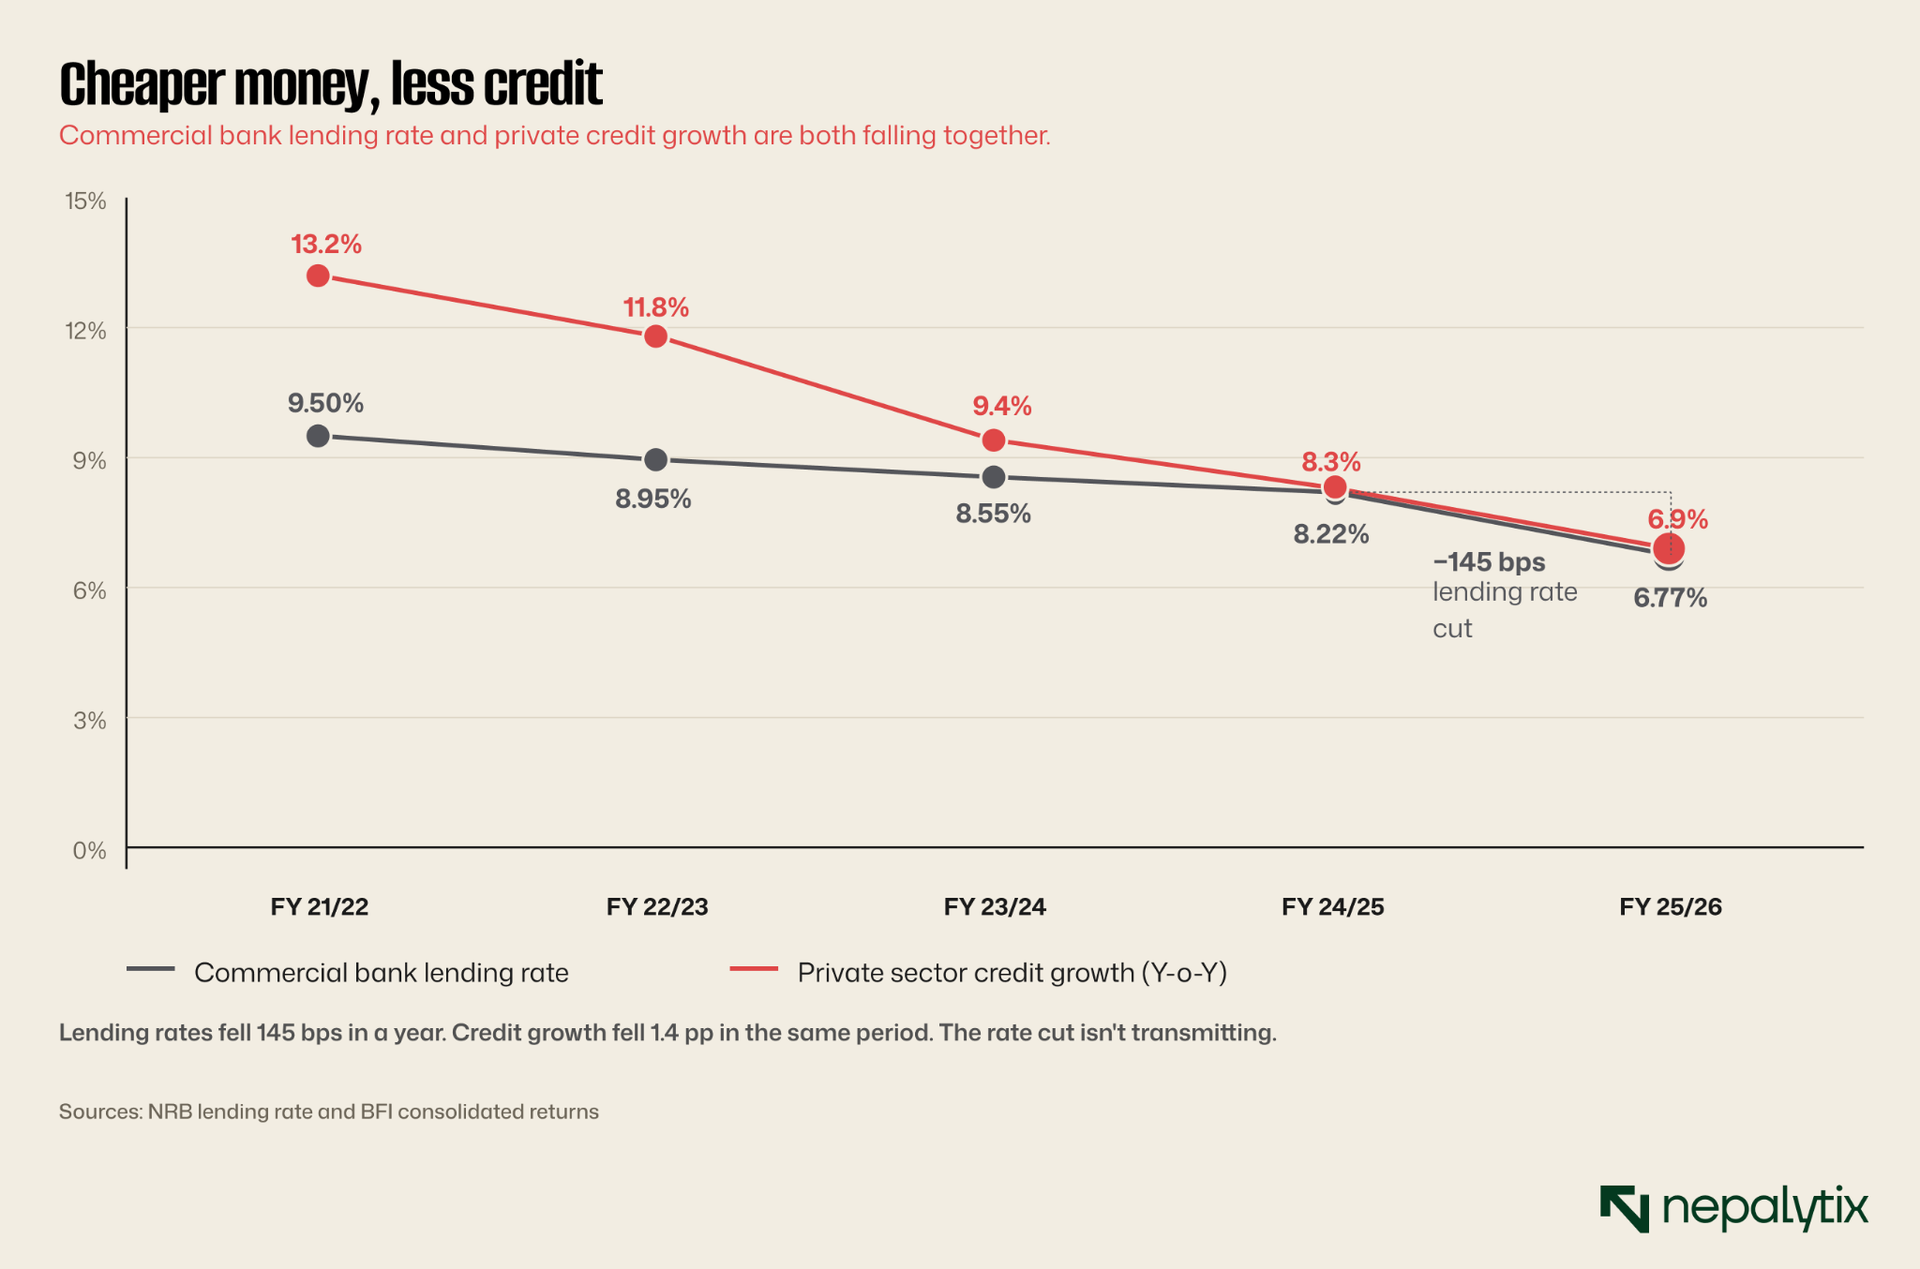
Deposits at banks and financial institutions grew 15.5 percent year-on-year through mid-April 2026 adding Rs 615.67 billion in just the nine months between July and April. Credit to the private sector grew only 6.9 percent year-on-year over the same horizon adding Rs 311.95 billion. The gap is the tell. Banks are receiving deposits faster than they're lending them out, and the rate at which they're lending is decelerating from 8.3 percent Y-o-Y a year earlier to 6.9 percent now.
This is happening while interest rates are falling sharply. Commercial banks' weighted average lending rate dropped from 8.22 percent in mid-April 2025 to 6.77 percent in mid-April 2026, a 145 basis point cut in a single year. The base rate at commercial banks fell from 6.29 percent to 5.06 percent. Treasury bill rates went from 3.06 percent to 2.61 percent. By every measure of price, money has gotten cheaper. By every measure of quantity, less of it is reaching the productive economy.
This is the textbook definition of a liquidity trap. Credit demand is weak even at lower rates. Banks have money to lend. Borrowers either don't want it or can't qualify for it. The interest rate signal isn't transmitting into investment activity.
The bigger question is why credit demand is weak. Three reasons show up in the data.
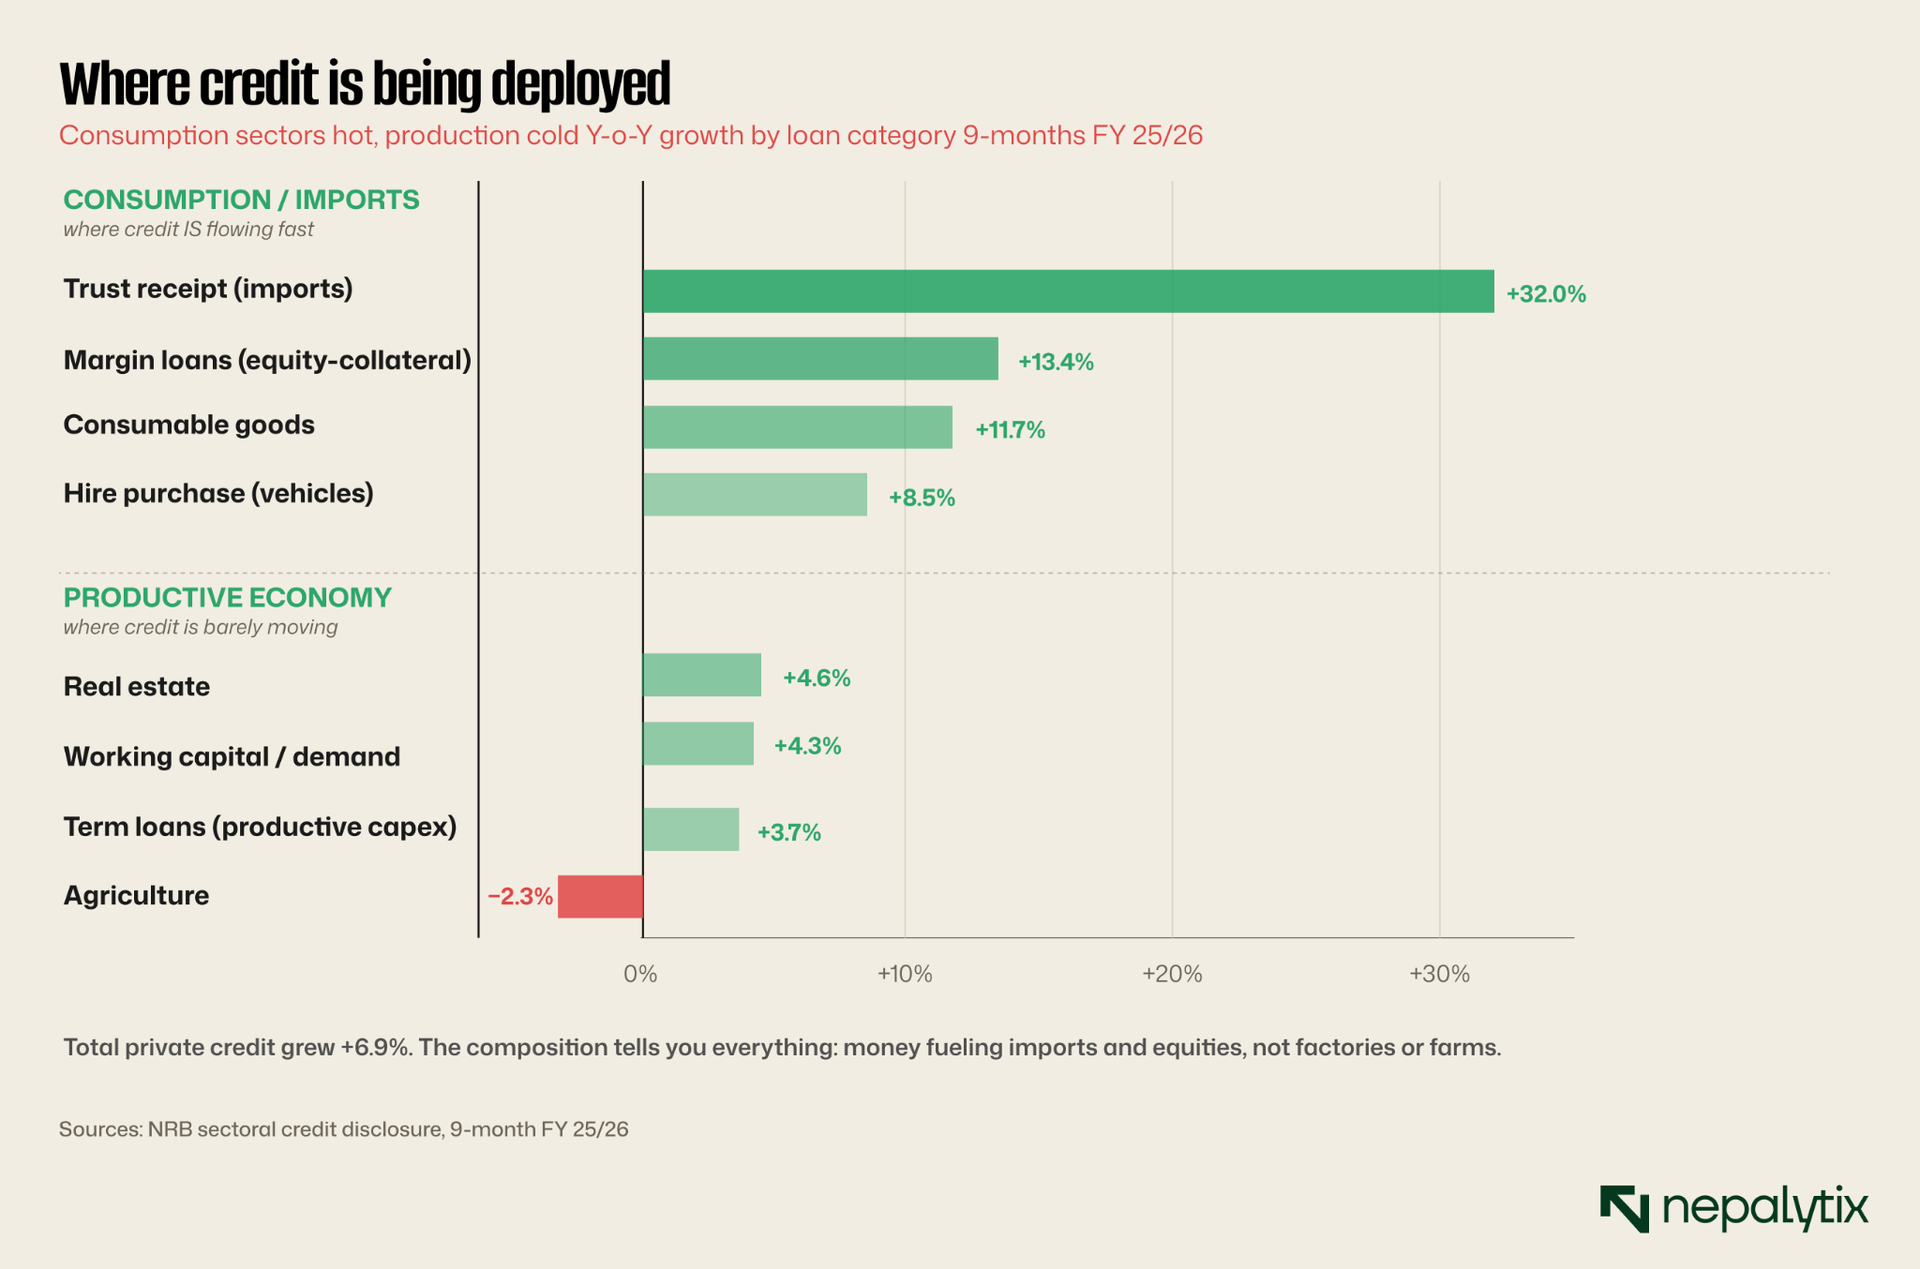
Private sector capex demand is muted. Term loans grew only 3.7 percent in the period. Hire purchase loans grew 8.5 percent. Working capital and demand loans grew 4.3 percent. None of these are the kind of growth rates that signal businesses are investing in new productive capacity.
What credit is growing is consumption and imports. Trust receipt (import) loans grew 32 percent. Margin loans grew 13.4 percent. Consumable sector loans grew 11.7 percent. Real estate loans grew 4.6 percent. The credit that's flowing out is funding imports, equities, and houses not factories or farms. Agriculture credit fell 2.3 percent. That isn't a deceleration. That's an absolute decline in lending to the country's largest employer.
Government capex is falling, not rising
Of the Rs 1,059.95 billion total government expenditure in nine months, Rs 747.52 billion (70.5%) was recurrent; salaries, pensions, operations. Rs 96.20 billion (9.1%) was capital expenditure. The capex figure is down 6.5 percent from the same period last year. The recurrent figure is up 10.2 percent.
This is the second consecutive year that government capital spending has come in below the previous period. The gap matters because when the private sector is reluctant to invest at the cycle's current rates, the public sector is supposed to step in with infrastructure spending to absorb capacity. Nepal is doing the opposite; recurrent spending is up, capital deployment is down.
Where is the cash going? Government cash balance at NRB jumped from Rs 137.78 billion in mid-July 2025 to Rs 429.17 billion in mid-April 2026. That's Rs 291 billion of fiscal resources sitting idle at the central bank rather than circulating in the economy.
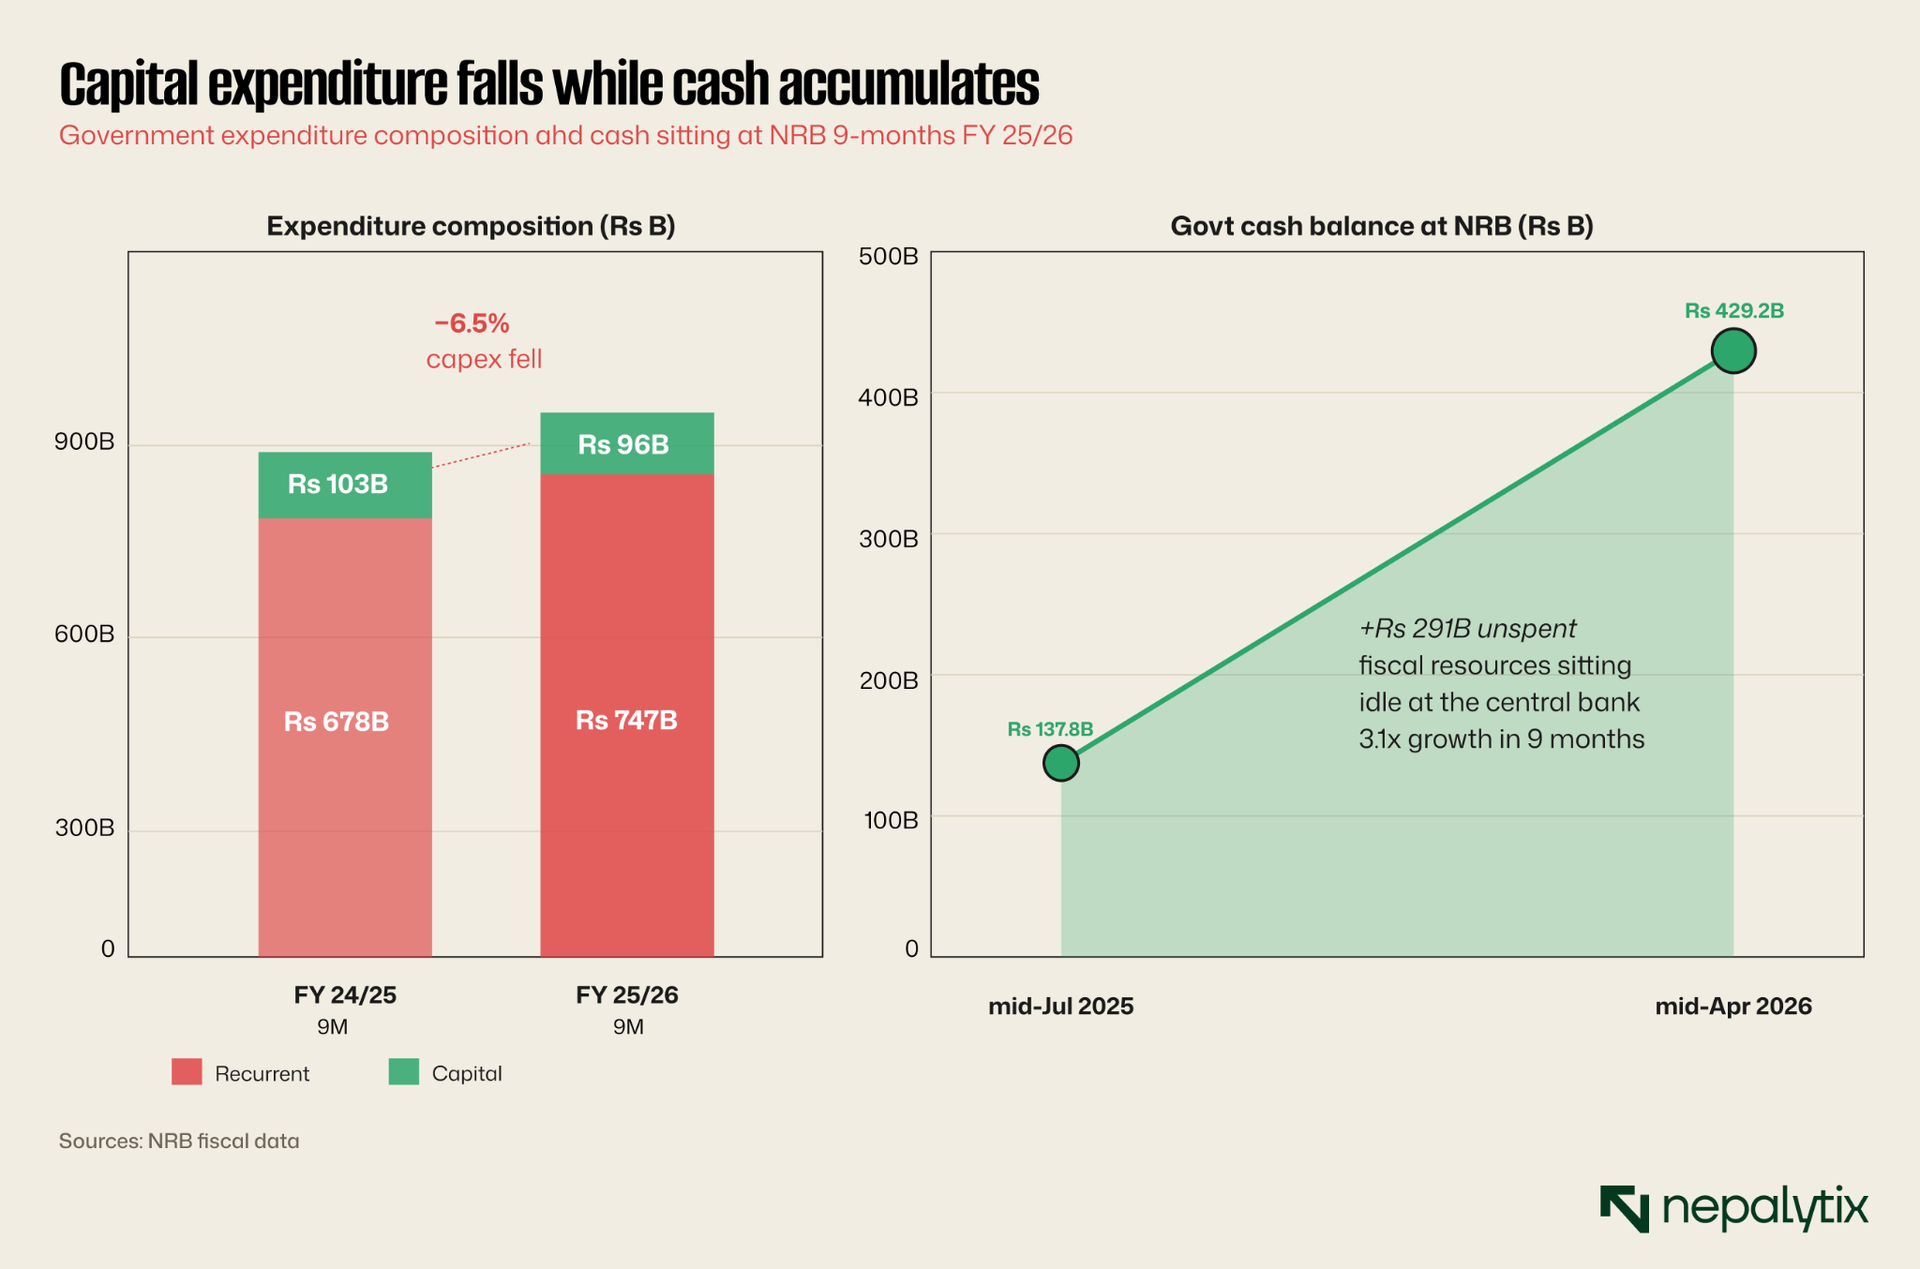
The combination is striking. Rs 429.17 billion sitting at NRB unspent by the government. Rs 35.4 trillion absorbed by NRB through liquidity facilities and bonds during the nine months. Banks holding more deposits than they can productively lend. This is what an economy looks like when money is abundant but absorption capacity is constrained.
The rupee is depreciating despite the FX windfall
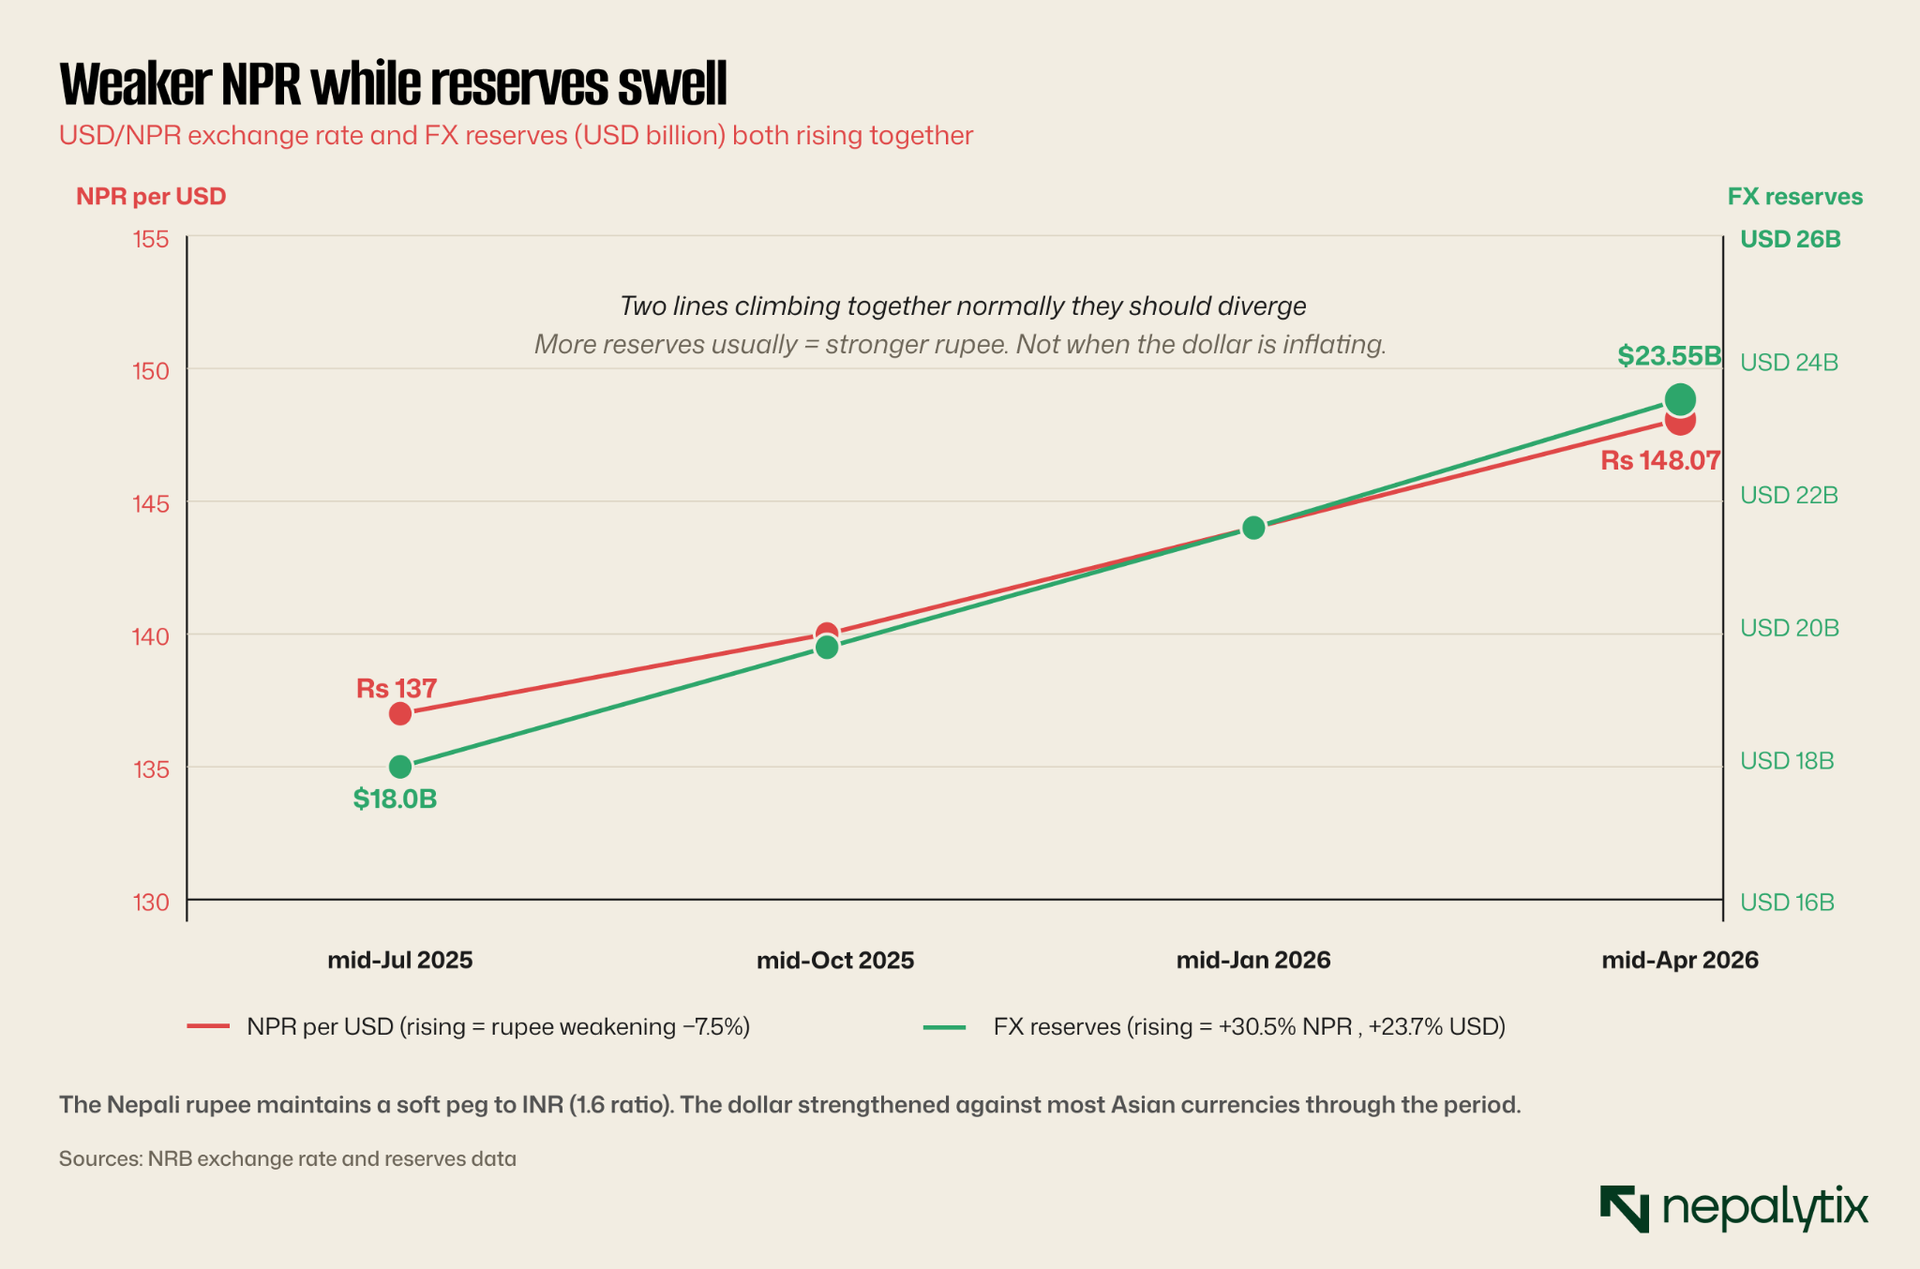
This is the counterintuitive part. Despite reserves growing 30.5 percent in NPR terms, the Nepali rupee depreciated 7.5 percent against the US dollar during the same period. Per NRB's official figure, the buying rate moved from approximately Rs 137 per USD in mid-July 2025 to Rs 148.07 per USD in mid-April 2026.
The reason isn't Nepal-specific weakness. The dollar strengthened broadly against most Asian currencies through this period, and the Nepali rupee maintained a soft peg to the Indian rupee which also depreciated against the dollar. NPR-INR exchange remained at the conventional 1.6 ratio, with the NRB purchasing Indian currency equivalent to Rs 431.06 billion through the sale of USD 3.00 billion. The mechanics are functioning. But the net effect is that import prices in NPR terms are rising even before global commodity moves are factored in.
The global commodity move is real and large. Brent crude rose 84.5 percent year over year to USD 123.28 per barrel in mid-April 2026 from USD 66.83 a year earlier. Gold rose 46.2 percent to USD 4,722.65 per ounce. For an economy that imports approximately 90 percent of its petroleum, this hits the trade deficit through the import bill which grew 13.8 percent to Rs 1,490.50 billion and shows up in inflation.
Inflation is rising while the economy is cooling
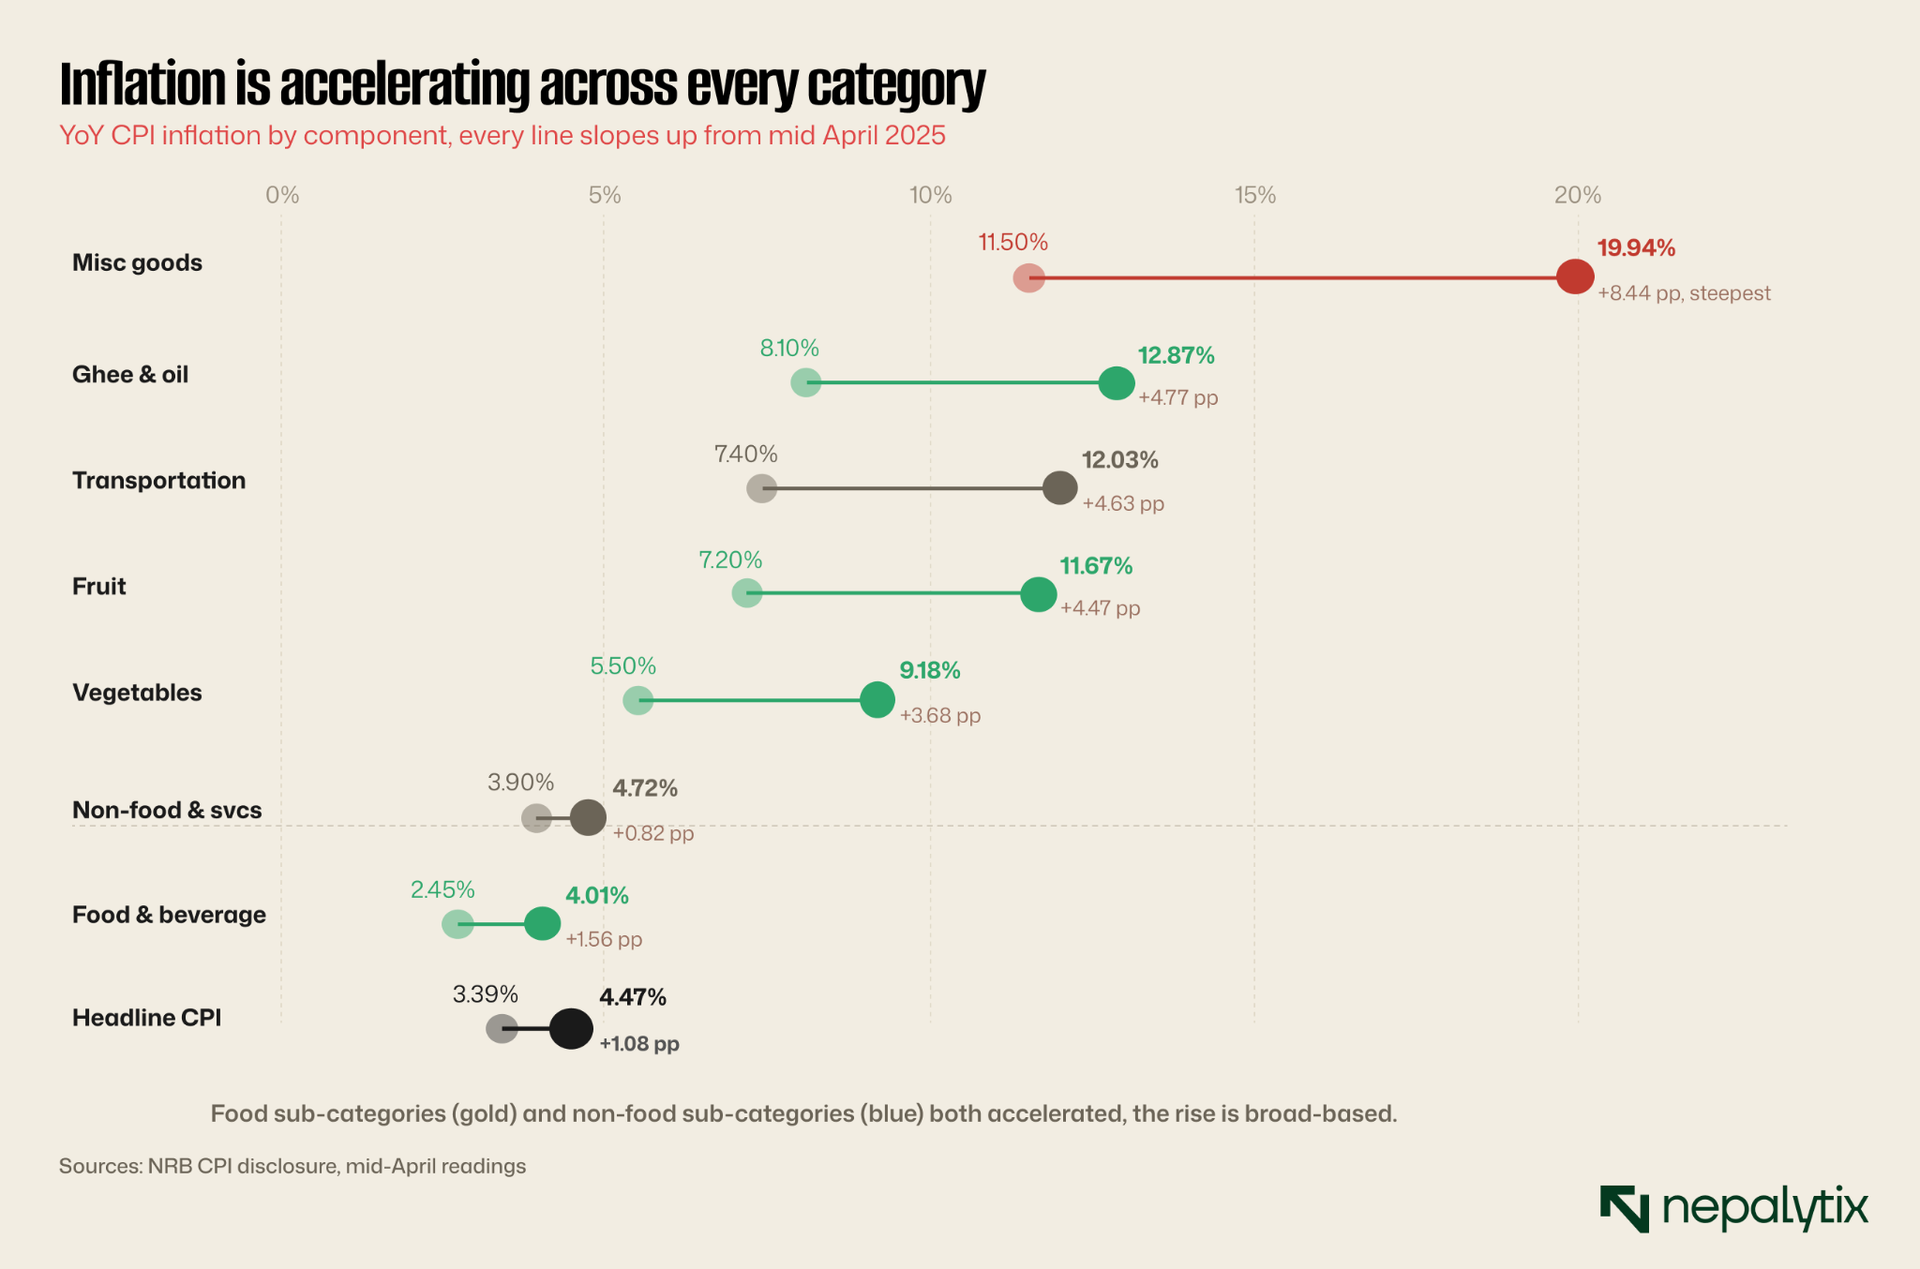
Y-o-Y consumer price inflation hit 4.47 percent in mid-April 2026, up from 3.39 percent a year earlier and 3.62 percent in mid-March. The number itself is comfortable within NRB's policy target band but the trajectory is firmly upward.
Food and beverage inflation reached 4.01 percent (vs 2.45 percent prior year). Non-food and service inflation hit 4.72 percent (vs 3.90 percent). Within food, ghee and oil prices rose 12.87 percent, fruit 11.67 percent, vegetables 9.18 percent. Within non-food, miscellaneous goods and services rose 19.94 percent and transportation rose 12.03 percent. Education inflation reached 7.46 percent.
So the picture is: weak private sector credit demand, falling government capex, accumulating idle cash at the central bank, depreciating rupee and inflation accelerating from 3.39 percent to 4.47 percent in twelve months. This is closer to a stagflation pattern than a healthy disinflation. Money is reaching consumers (through remittances) faster than it's reaching production capacity (through credit), and the resulting demand without supply expansion is pulling prices upward.
What banks are doing with the money
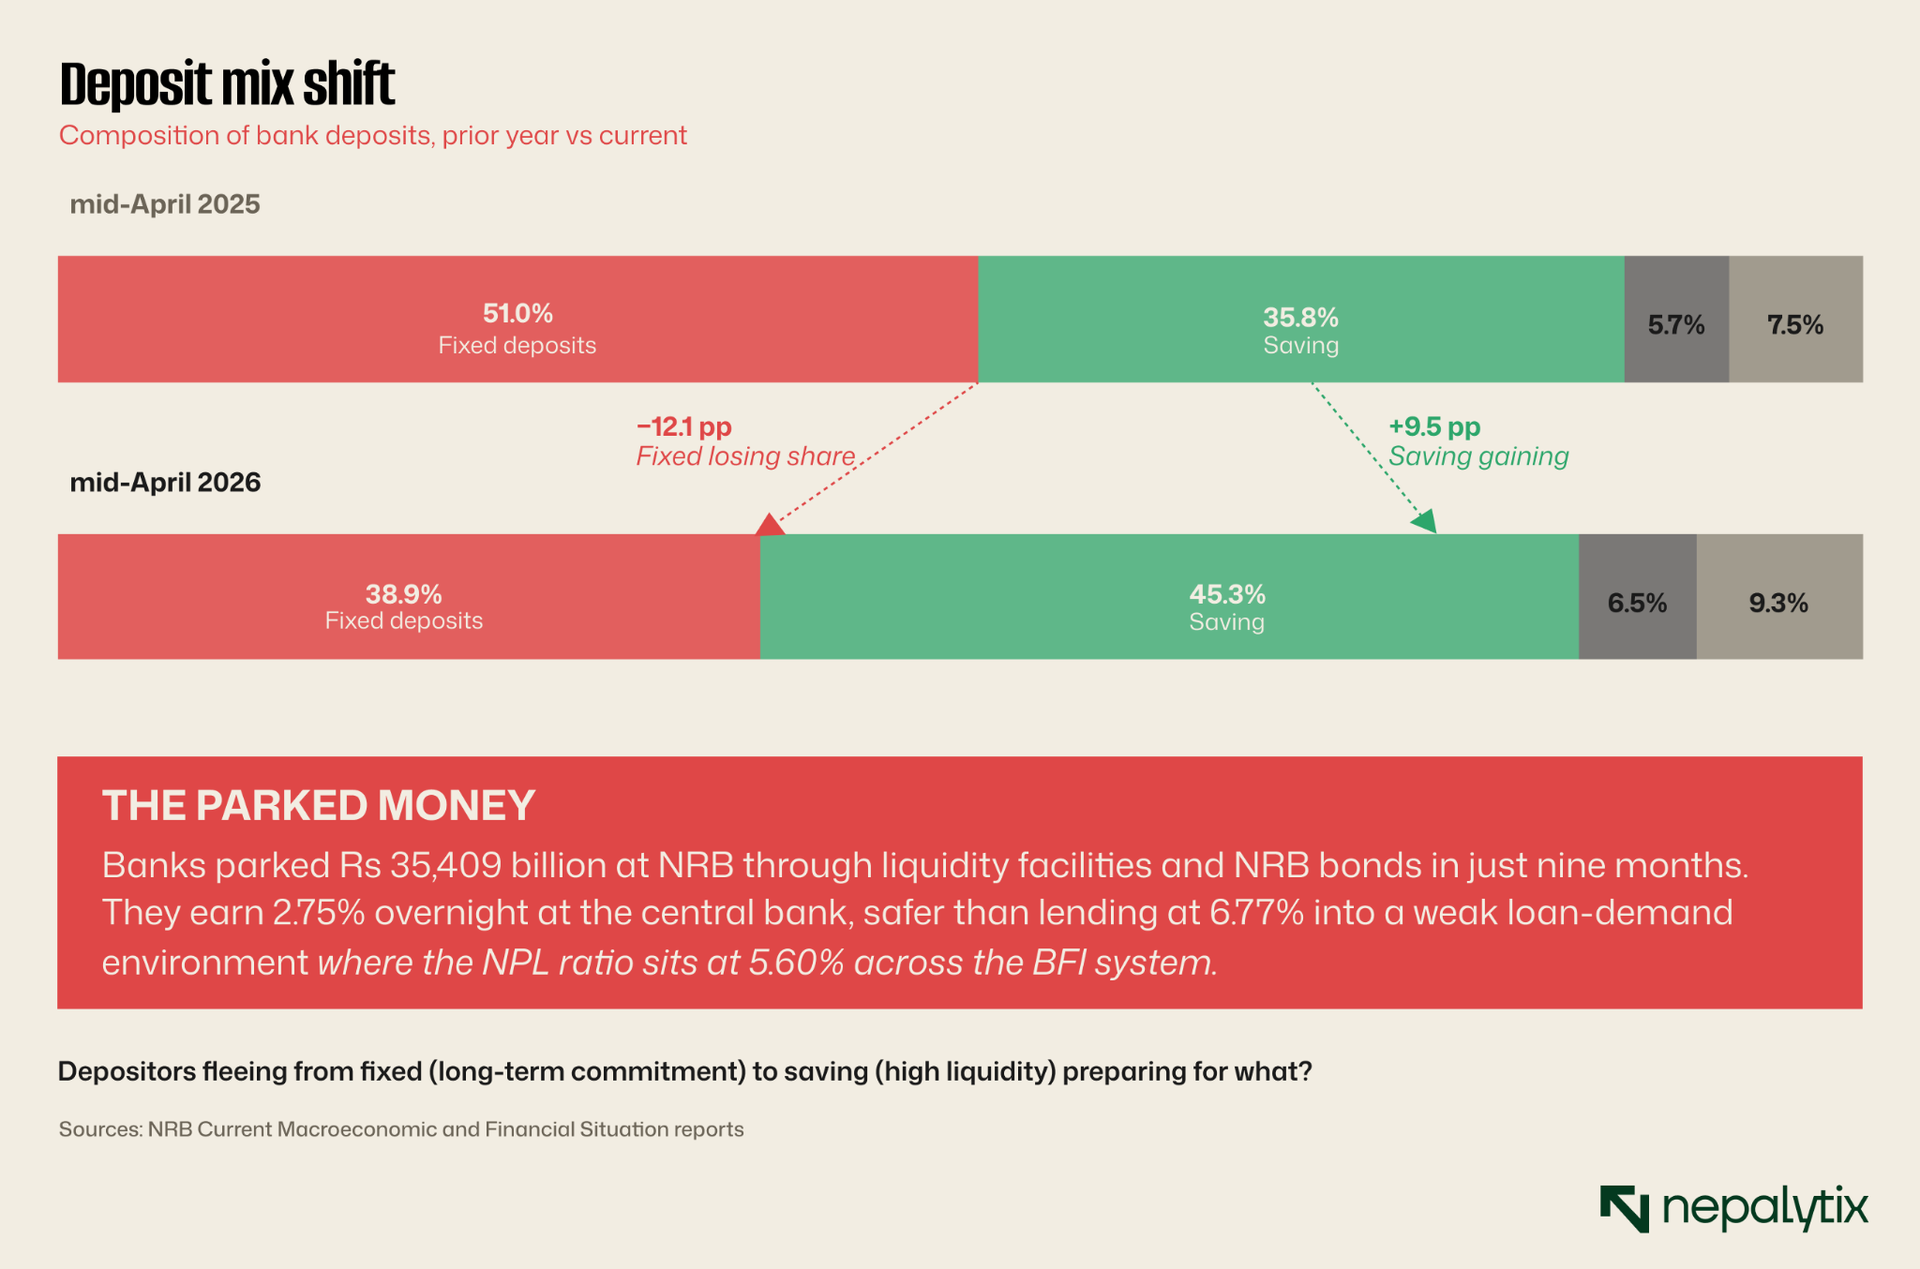
If deposit growth so far outpaced credit growth, where did the difference go? The disclosure shows the answer in the NRB liquidity management section: the central bank absorbed Rs 35,409.25 billion in liquidity through deposit collection auctions, the Standing Deposit Facility, and NRB bond issuance. Banks are parking the excess at the central bank to earn 2.75 percent overnight rather than lend at 6.77 percent into a weak loan-demand environment.
That makes commercial sense individually. Risk-free 2.75 percent at NRB is better than a 6.77 percent loan that might turn into a 5.60 percent non-performing loan ratio statistic (the NPL ratio for the BFI system in mid-April 2026, per the NRB report). But collectively, it's the economy not absorbing its own liquidity. Banks are choosing the central bank over the borrower.
The deposit mix tells the same story from a different angle. Fixed deposits fell from 51.0 percent of total deposits a year ago to 38.9 percent now. Saving deposits jumped from 35.8 percent to 45.3 percent. Demand deposits rose from 5.7 percent to 7.0 percent. The money is in shorter and more liquid form, depositors don't want to lock it up because rates are low and they can't see investment opportunities either.
What this signals for the cycle
The strongest external accounts in Nepal's modern history are sitting alongside the weakest productive credit transmission in eight years. Money is coming in faster than it can be put to work. The central bank is absorbing excess liquidity. The fiscal machinery is letting cash pile up at NRB rather than deploying it. Banks prefer parking deposits at NRB to lending them. The agriculture sector is seeing absolute credit contraction.
The implications for the capital market are not as one-directional as the macro headlines suggest.
For banks: Net interest margins are compressed by the cheap-money environment (lending rate down 145bps, cost of fund also down but by less). Asset quality stress (5.60 percent system NPL) keeps impairment charges elevated. The Q3 disclosures from NABIL, NMB and NIC Asia walked through to show the divergence: stronger banks releasing provisions, weaker banks building them. Watch which side any specific bank is on.
For sectors that import: Cheap working capital financing is available (trust receipt loans grew 32 percent). This benefits trading companies, importers, and businesses with high inventory turnover. The dollar-rupee depreciation cuts the other way imported inputs cost more in NPR terms.
For sectors that export: Cardamom, soyabean oil, palm oil, jute, and noodles led export growth at 18.5 percent overall. Exporters to India (which grew 22.6 percent) are seeing real momentum. Exporters to China declined 46.8 percent, a sharp move that bears watching for the sectors exposed.
For real estate and construction: Construction sector credit grew 10.7 percent the second-fastest sector after consumable goods. Real estate loans grew 4.6 percent. Land-and-building remains 63.4 percent of total BFI loan collateral. This is the channel through which excess remittance liquidity reaches asset prices in Nepal: deposits → bank lending → real estate. Whether that's healthy financialisation or a slow-motion bubble depends on whom you ask, but the credit numbers say the channel is active and growing.
For NEPSE: The index stood at 2,833.6 in mid-April 2026 versus 2,662.1 a year earlier, a 6.4 percent gain that's broadly consistent with deposit-flow dynamics rather than earnings strength. The same liquidity that isn't being absorbed by productive credit is finding its way into financial assets. BFIs and insurance still represent 50.2 percent of market capitalisation, so the index is mostly tracking financial sector performance under cheap-money conditions.
What to watch next
Three data points will tell us whether the pattern is breaking or deepening when the next NRB report (10-month, published mid-June) drops.
1. Credit growth. If private sector credit growth at commercial banks moves above 7 percent year-on-year by mid-May, the transmission is starting to work. If it stays below 6 percent, the pattern is entrenched.
2. Government capex execution. The fiscal year ends mid-July. The government typically rushes capex in the final quarter. If capex growth turns positive by year-end, the fiscal pulse is alive. If it ends FY 25/26 still below FY 24/25 levels, fiscal drag is structural.
3. NPR-USD trajectory. The 7.5 percent depreciation reflects dollar strength rather than rupee weakness. If the dollar weakens globally (US Fed cuts, dollar index falls), some of that depreciation reverses naturally. If the dollar stays strong, imported inflation becomes a sustained problem.
Until then, the reading is straightforward. Nepal has more money than it can use. The central bank is mopping it up. The banks are parking it at the central bank. The government is sitting on cash at the central bank. The household sector is depositing it in increasingly liquid forms. And the productive economy is growing at a pace that doesn't justify the absorption challenge.