NEPSE Concentration Explained: How 10 Stocks Control Nepal’s Entire Stock Market
Nepal’s stock market appears broad, with 263 listed companies across 16 sectors. But beneath the surface, just 10 stocks drive nearly 60% of total trading activity and dictate index movements.

263 Companies Listed on NEPSE. Ten of them set every price.
The index moves every session. Sectors rotate. Analysts publish targets. And underneath all of it, the same ten names trade the same volumes, set the same prices, and determine whether the headline number goes up or down. The other 253 companies are priced by whoever happens to place the only order of the day.

Start with the basic arithmetic. The week ending April 11, 2026, NEPSE recorded Rs 57.27 Arba in total turnover, one of the stronger weeks of Q3 FY26. Reliance Spinning Mills alone posted Rs 2.57 billion. National Hydro Power followed at Rs 2.11 billion. Seven more hydropower and one additional manufacturing name completed the top ten. Together, those ten stocks accounted for roughly Rs 34 billion, 59.4% of everything traded on a market with 263 listed companies across 16 sectors.
This is not a one-week anomaly. The same cluster has dominated NEPSE turnover for years, with only occasional reshuffling when a large IPO or rights issue temporarily inflates a new entrant's volume. The concentration is structural. Understanding it, where it comes from, what it does to prices, and what it means for anyone trying to read NEPSE as a signal about Nepal's economy, is the purpose of this Signal.
1. The market cap Vs Turnover disconnect, where the real anomaly lives
The standard description of NEPSE is that it is a banking-heavy market. By market capitalization, this is correct. Nepal's commercial banks, NABIL, EBL, NIC Asia, Standard Chartered, collectively represent the largest share of total listed market value. Their paid-up capital dwarfs every other sector. If you are measuring economic weight, banking dominates.
But market cap and trading activity are two different things. And when you plot them against each other for every listed company, NEPSE splits cleanly into two separate markets that happen to share the same exchange. On one side: large market cap, modest daily turnover, the banking stocks that institutional holders rarely trade and retail investors treat as long-term positions. On the other: small to medium market cap, explosive daily turnover, the hydropower stocks where retail speculation concentrates every single session.
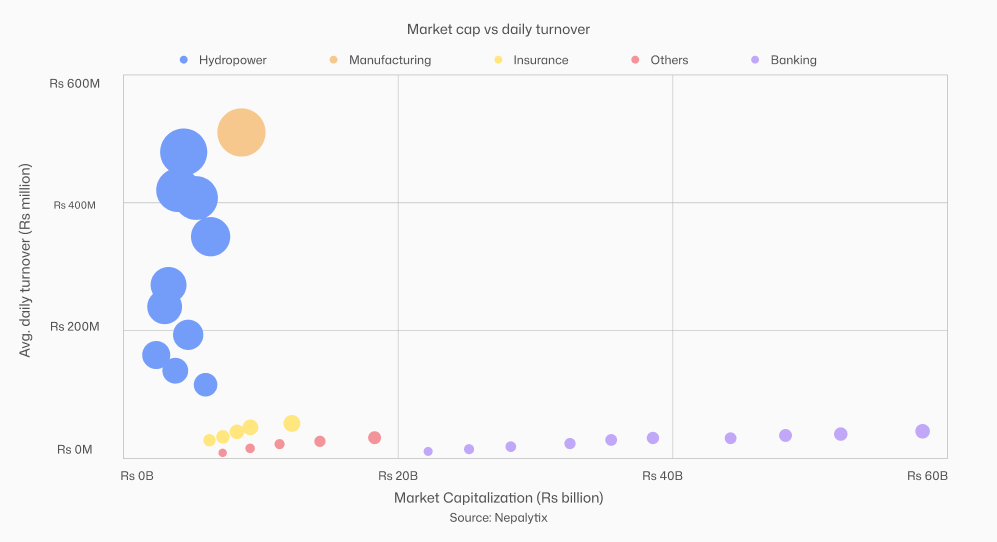
The diagonal tells the story. In a healthy market, turnover and market cap move together, big companies trade more. NEPSE shows the opposite bifurcation: banking stocks (top right in market cap, low on turnover) vs hydropower stocks (low-mid market cap, high on turnover). The companies most actively traded are not the companies with the most economic weight.
This bifurcation has a specific cause. Nepal's banking stocks are dominated by institutional holders, promoter-locked shares, and long-term retail investors who bought during merger consolidation and rarely sell. Free float, the proportion of shares that actually change hands is low. You cannot trade what is not available to trade.
Hydropower stocks are the opposite. They were issued to the general public in small lots, have high free float, and attract constant retail attention because of the narrative around Nepal's energy potential. NHPC, RIDI, AKJCL, NGPL, SMHL, these are not Nepal's most economically important companies. They are Nepal's most speculated-upon companies. The distinction matters enormously for anyone trying to read daily NEPSE volume as a signal about where money is flowing.
2. Persistence, the heatmap that makes concentration undeniable
One response to concentration data is to argue it reflects temporary conditions, news flow, post-IPO activity, sector rotation. Pull a different week and the list changes. Average over a quarter and the concentration dilutes. This is the argument that makes concentration seem manageable rather than structural.
The floorsheet data from eight consecutive sessions in March and April 2026 destroys this argument. The same names appear, the same names dominate, and the only variation is which hydropower stock briefly surges on a given day before returning to its established rank. The heatmap below shows turnover rank, not absolute turnover for the twelve most consistently active stocks across those eight sessions.
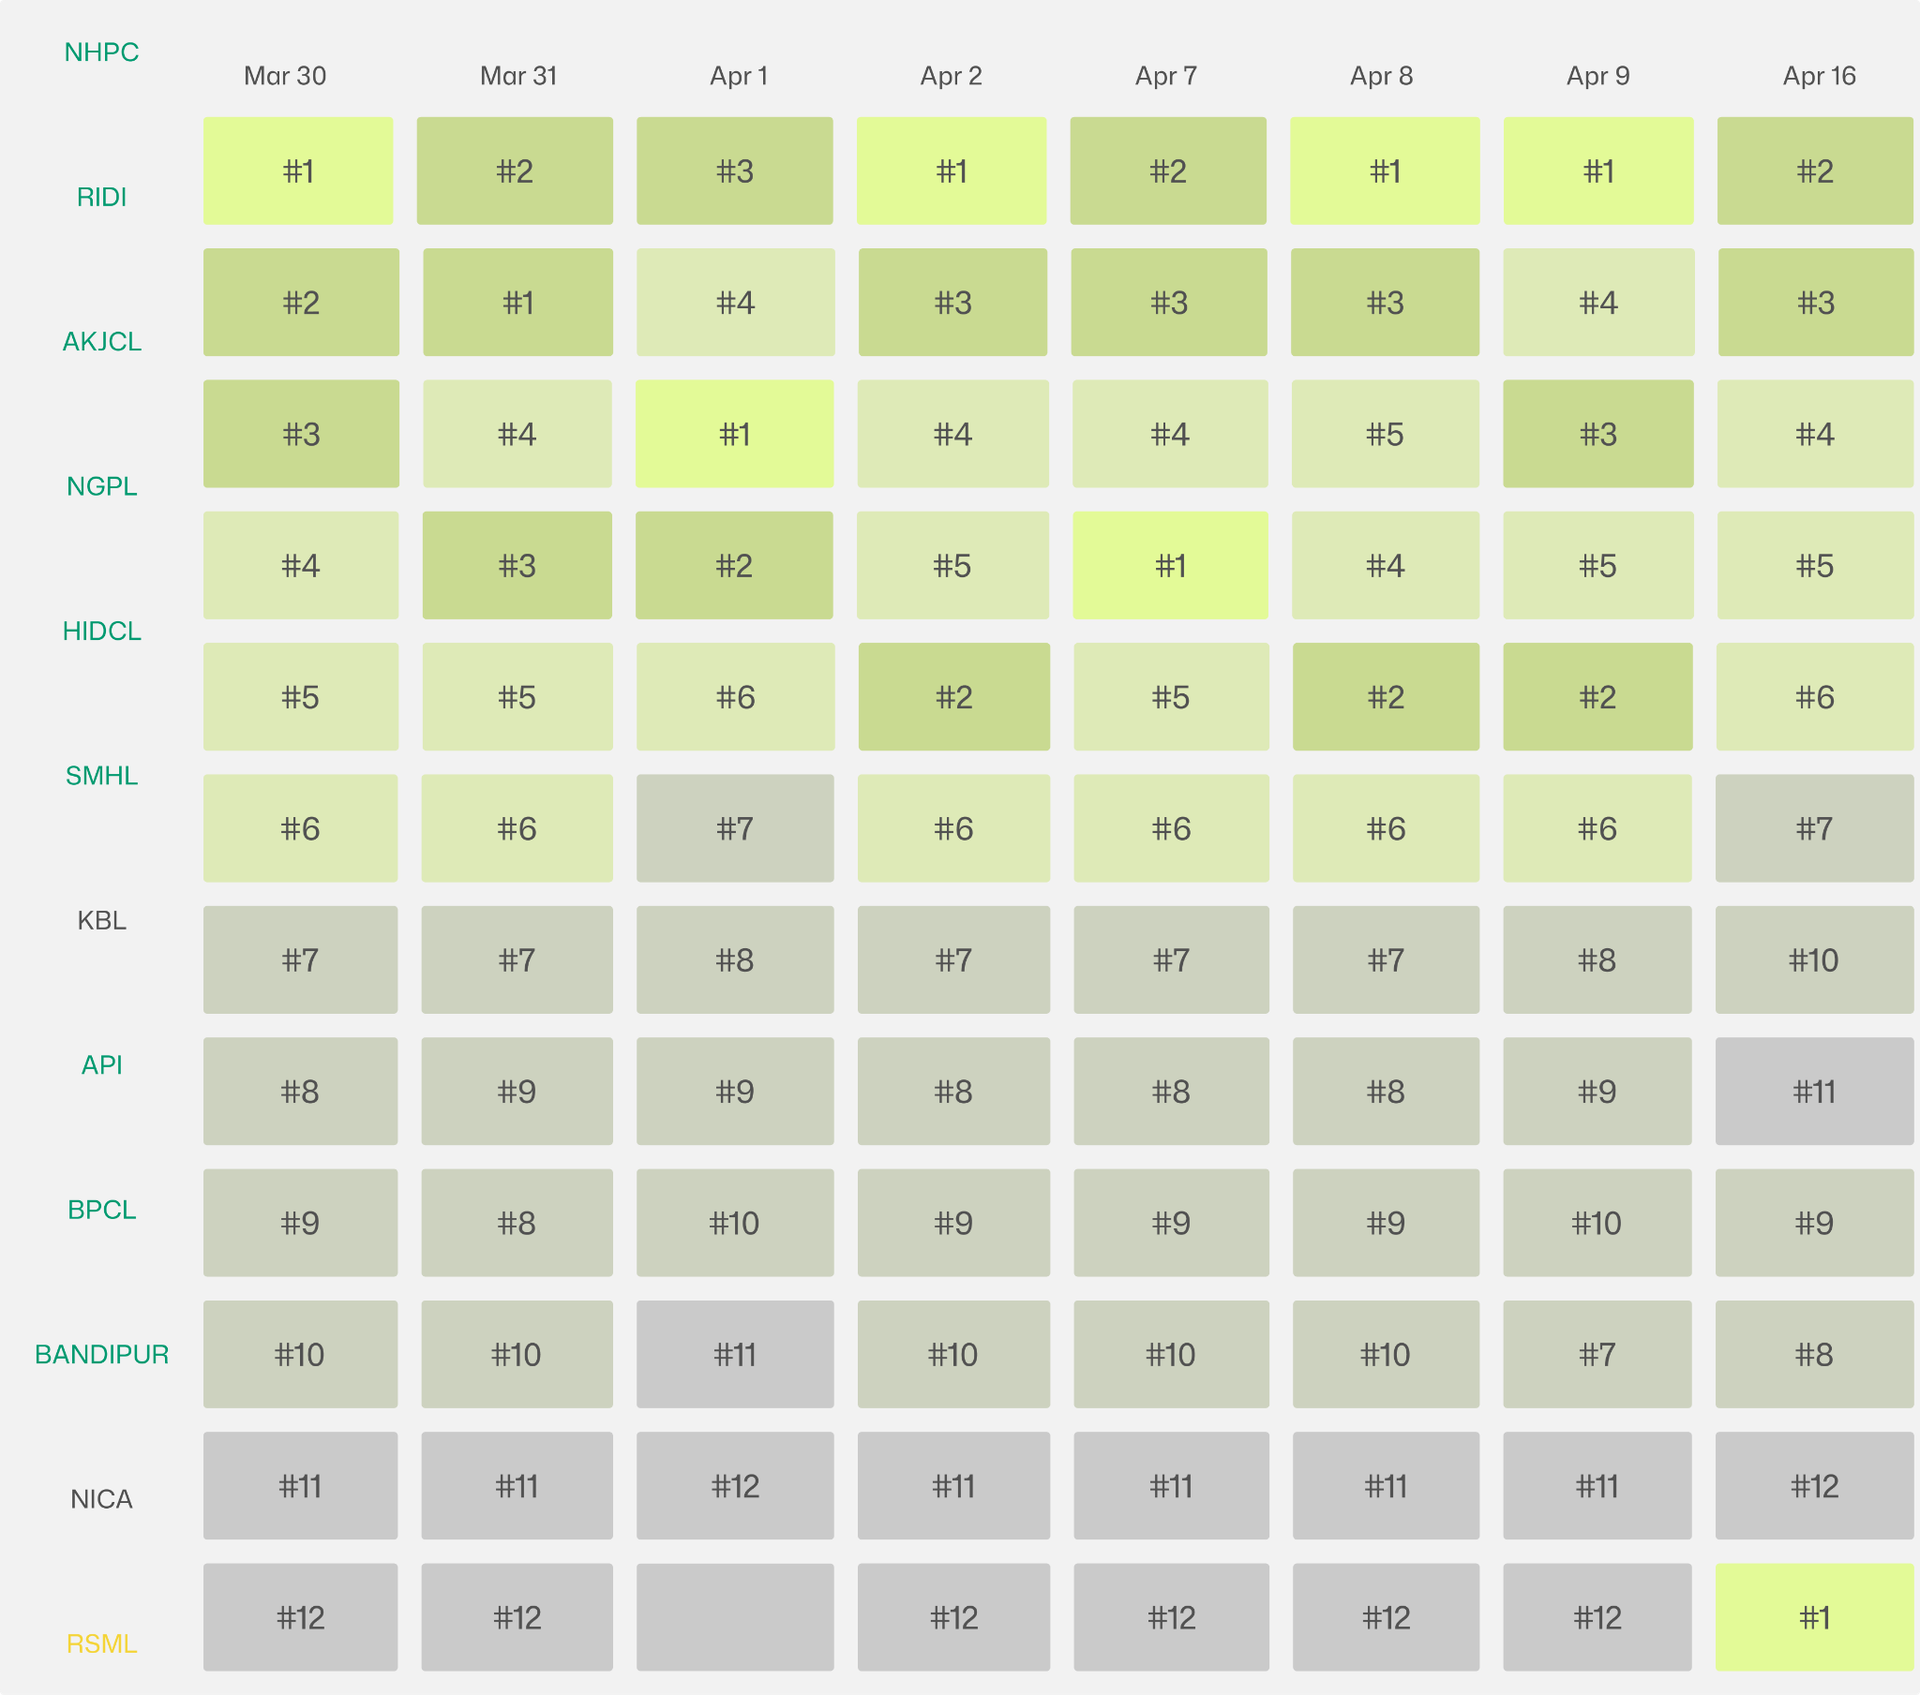
How to read this: Each cell is one stock on one session. Darkest gold = ranked #1 in turnover that day. Lightest = ranked 10–12. A stock with consistently dark cells across all sessions is a permanent top-tier name, not a temporary surge. NHPC and RIDI have not left the top 4 across any of these sessions.
What the heatmap makes visible is a two-tier structure that raw numbers obscure. There is a permanent core, NHPC, RIDI, AKJCL, NGPL, that holds the top four positions in 6 out of 8 sessions regardless of what the broader market is doing. Below them is a volatile second tier where HIDCL, SMHL, and KBL rotate in and out. And then there is RSML, which appears from nowhere in the final two sessions after listing and immediately claims the top spot, a textbook illustration of how post-listing volume distorts the picture temporarily before the permanent core reasserts itself.
The persistence of the top tier is the evidence that concentration is structural. These stocks are not popular because of news. They are popular because they have always been popular and in a market with limited institutional presence and millions of retail accounts all watching the same names, popularity is self-reinforcing.
3. The sector mismatch, listed weight vs trading weight
Nepal has 263 listed companies across 16 sectors. The distribution of those companies across sectors tells you approximately what Nepal's listed economy looks like. The distribution of trading activity across sectors tells you something completely different — what retail investors are speculating on. The gap between those two distributions is one of the more telling structural facts about NEPSE.
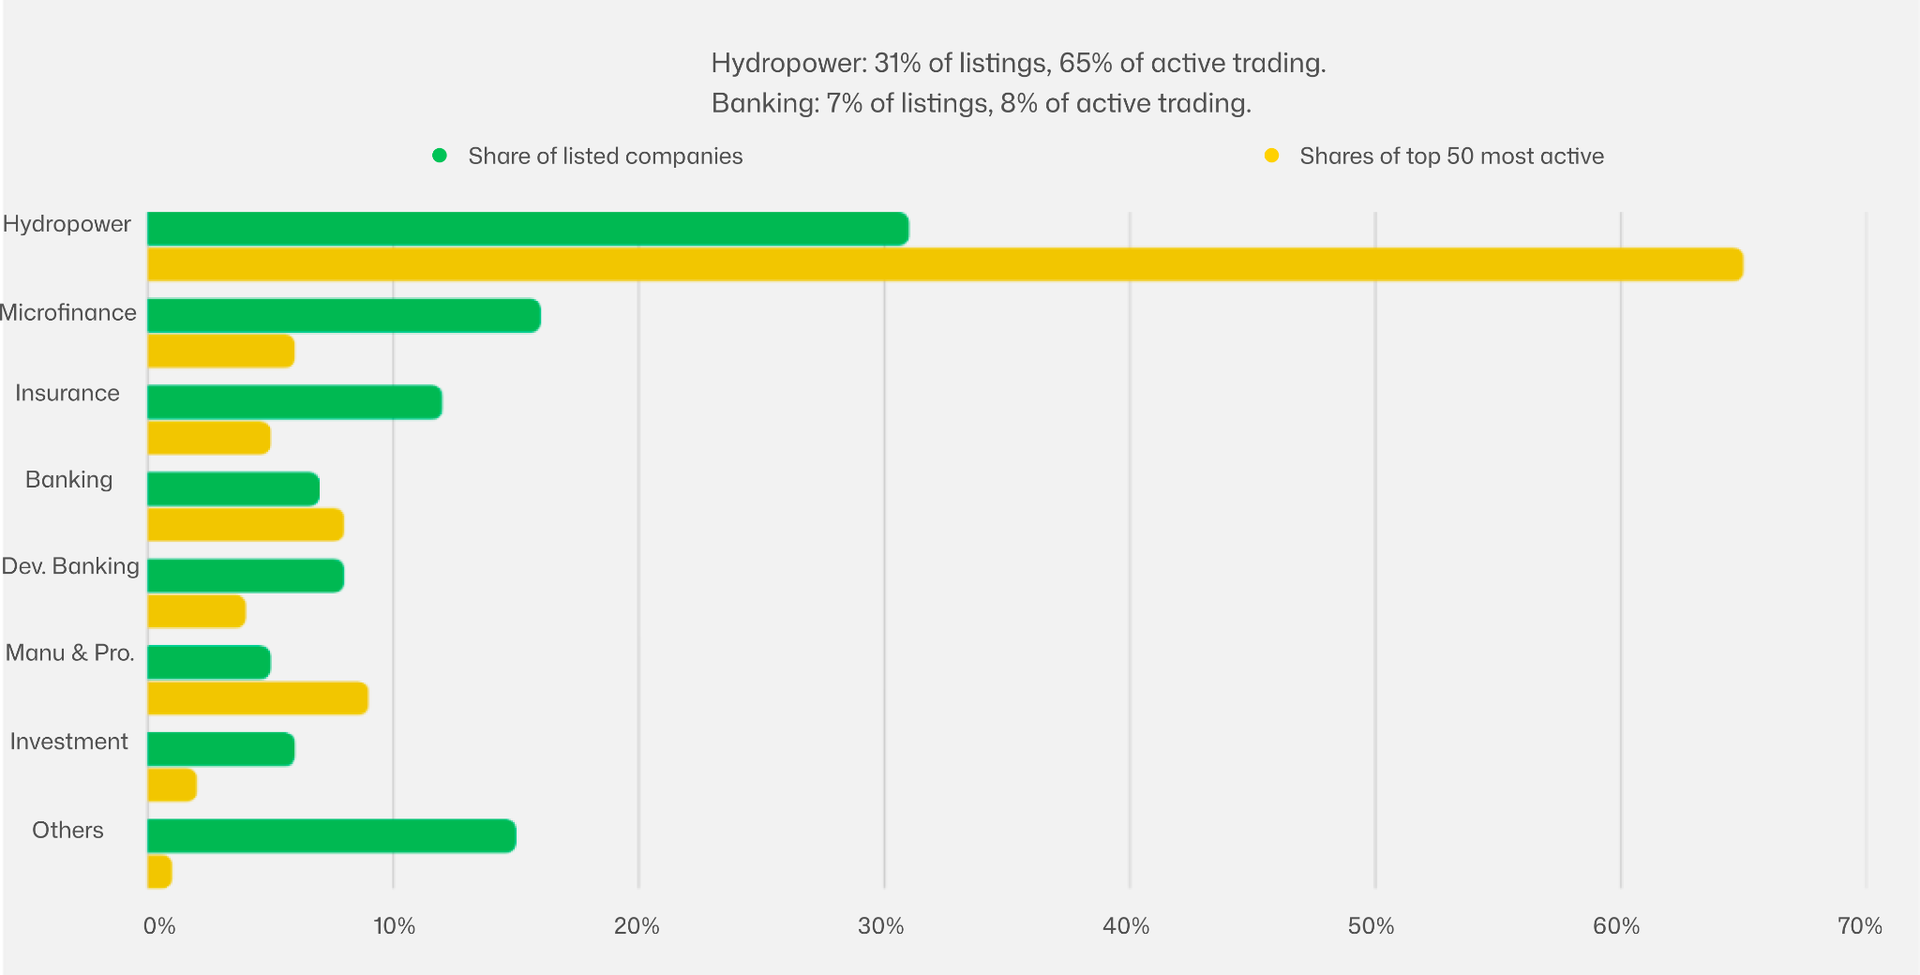
The overrepresentation is not subtle. Hydropower is 2.1x overrepresented in active trading relative to its listing share. Every other major sector is underrepresented. Microfinance has 16% of listings and 6% of active trading, the inverse of hydropower, and a sign of how many microfinance stocks effectively do not trade.
The microfinance data point deserves its own paragraph. Nepal has approximately 43 listed microfinance institutions. Most of them trade on fewer than three sessions per week. Several have gone entire fortnights without a single matched transaction. Their listing on NEPSE is nominal, they are present in the company count but absent from any meaningful price discovery. When the index reports a "microfinance sub-index" movement, it is reflecting the behaviour of perhaps eight to ten institutions that actually trade, not 43.
This same logic applies, to varying degrees, across most sectors. The 263 listed companies on NEPSE include a long tail of names that are listed but not liquid. The effective market, the one where prices are actually being set by supply and demand, is probably closer to 40 to 50 companies. The rest are ghost listings.
Finding: NEPSE's official market capitalization of Rs 4.76 trillion includes the full notional value of all 263 listed companies. But the portion of that market cap where you can reliably enter and exit a position at a fair price, without moving the market yourself is a fraction of that number. For any position above Rs 10 million, the effective universe on NEPSE is fewer than 50 stocks.
4. Breath Vs Headline, Why the index lies to you every session
Market breadth, the ratio of advancing stocks to declining stocks in a given session, is the most unbiased measure of whether a market move is genuine. When 180 stocks advance and 40 decline, the index is rising because the broad market is buying. When 10 stocks surge and 160 decline, the index is being held up by concentrated positions in a handful of names while the typical stock is selling off. NEPSE has been producing the second kind of session far more often than the first.
The April 2 session is the cleanest example available. NEPSE gained 5.82 points. Daily turnover reached Rs 8.81 billion, a healthy number. Anyone reading the headline would conclude: positive session, reasonable liquidity, market holding up. The breadth data told a completely different story: 158 stocks declined, 98 advanced, 12 unchanged. More than 60% of the market fell. The index rose anyway, because the concentrated leaders, the top 10 names that account for 60% of turnover, happened to trade up that day
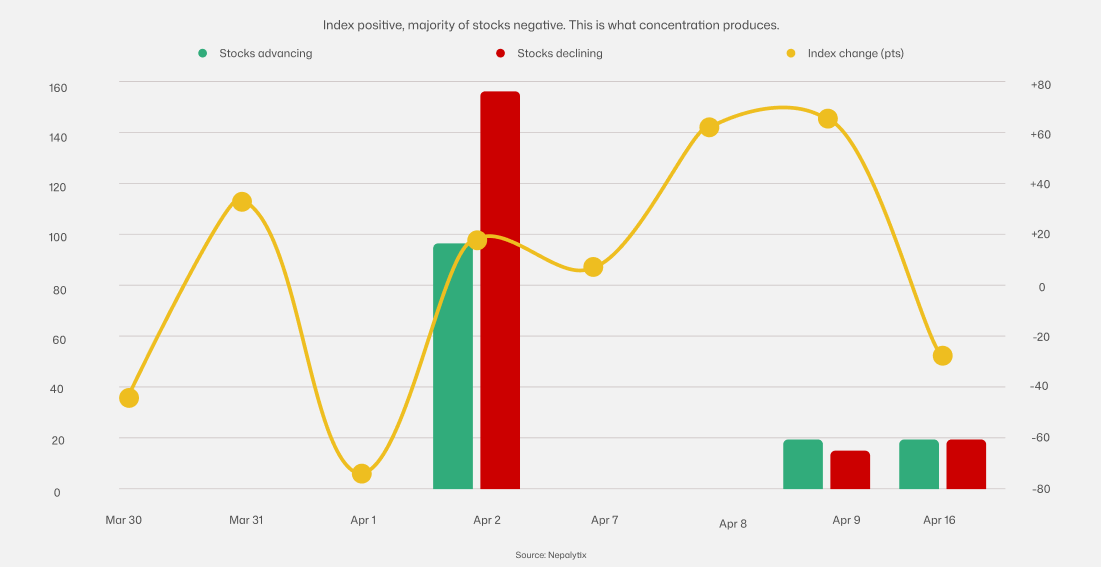
Apr 2 is the key data point: Index +5.82 pts on Rs 8.81B turnover, yet 158 stocks fell. This is only possible when concentrated leaders pull the cap-weighted index up against the grain of the broader market. The typical NEPSE investor holding a stock outside the top 10, experienced a down day while the headline said up.
The 5.69% index decline in the week ending April 4 tells the same story from the other direction. That week is remembered as a bad week on NEPSE. It was if you held the concentrated leaders. NHPC, RIDI, and AKJCL all sold off sharply. But if you held a mid-tier banking stock or a manufacturing company outside the top 50 by volume, your week was largely unremarkable. The concentrated leaders' decline dragged the index. The broad market barely moved.
This is the practical consequence of concentration for a retail investor. The NEPSE index is not a portfolio. It is a proxy for what ten to twenty names are doing. Using it to assess whether the market is "good" or "bad" is like using the temperature in Kathmandu to assess whether it is warm in Pokhara. Correlated, sometimes. Reliable, no.
5. What this means for anyone reading NEPSE as a signal
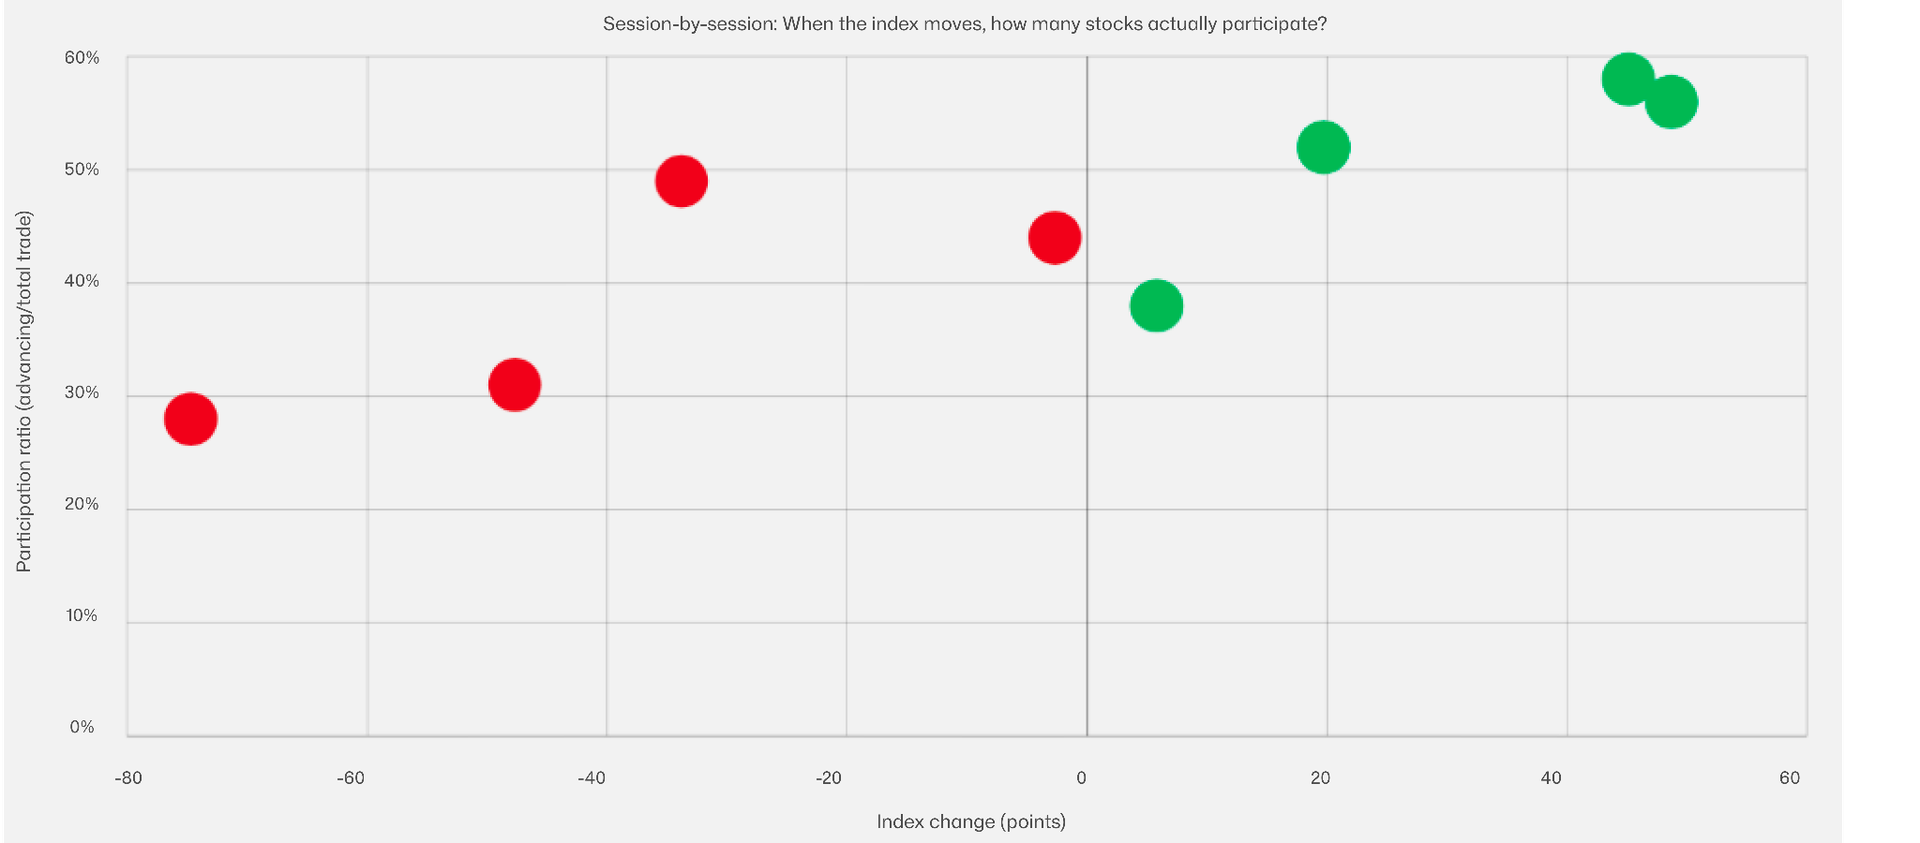
Participation ratio = advancing stocks ÷ total stocks traded that session. A ratio below 0.45 means fewer than half the trading stocks advanced even if the index rose. Apr 2: participation 0.38, index +5.8pts. The positive index number masked the negative broad market experience.
Five million Nepalis have active DEMAT accounts. That number represents a genuine democratisation of capital markets access in a country where financial products were historically unavailable to most of the population. The daily NEPSE close broadcast on television, shared on Facebook, discussed in offices and chiya pasal conversations has become a shorthand for "how the economy is doing."
The data in this Signal argues that this shorthand is misleading in a specific and consequential way. When the NEPSE index moves, it is reporting the weighted average performance of 263 companies but the weights are determined by market capitalisation, and the prices driving that calculation are being set in a market where 60% of daily turnover is concentrated in 10 stocks, 8 of which are hydropower companies with small to medium market caps and enormous retail speculation. The gap between "what the index says" and "what the typical listed company experienced today" can be and frequently is more than 5 percentage points in the same session.
Investors making decisions based on the headline index move are making decisions based on what NHPC and RIDI did that day, dressed up as a market-wide statement. The index is not lying. It is measuring exactly what it says it measures. The problem is that most users of the number are implicitly assuming it measures something broader than it does.
The NEPSE-30 index announced precisely this problem by creating a benchmark of the 30 most liquid, most representative stocks not launched. The absence of a credible alternative benchmark is not a minor administrative delay. It means the market continues to be interpreted through a lens that systematically overstates breadth and understates concentration. That is a separate Signal.
The one number to watch: The advance-decline ratio, published in every daily NEPSE summary, is more informative than the index level for assessing whether a session reflects broad market health or concentrated top-tier movement. On days when the index moves more than 1% in either direction but the advance-decline ratio stays below 0.45, the move is being driven by the concentrated core, not the market.