NEPSE Ends the Week Flat, But the Market Underneath Was Anything But Stable
NEPSE slipped just 0.50% this week, but beneath the calm headline was one of the most structurally divergent trading weeks of 2026. Tuesday’s extreme breadth collapse, Friday’s rare “green index but all sectors red” session, speculative upper-circuit runs in microfinance stocks, and synchronized interest-rate resets.

NEPSE closed the week down 0.50%. Underneath: extreme breadth on Tuesday, a Friday session where every sector closed red but the index closed green, two consecutive weeks of microfinance upper-circuit pumps, and twelve banks resetting rates the same day.
→NEPSE full week: 2,745.65 → 2,731.94, a 5-session move of 13.71 points (−0.50%) net flat headline but Tuesday saw 251 stocks decline against 13 advancing
→Friday May 15 closed +1.77 points (+0.065%) yet all twelve sub-indices closed red: Banking −1.14%, Microfinance −2.24%, Hydropower −2.59%, Finance −3.10%, Others −3.76%. The same defensive large-cap fingerprint as Tuesday repeated
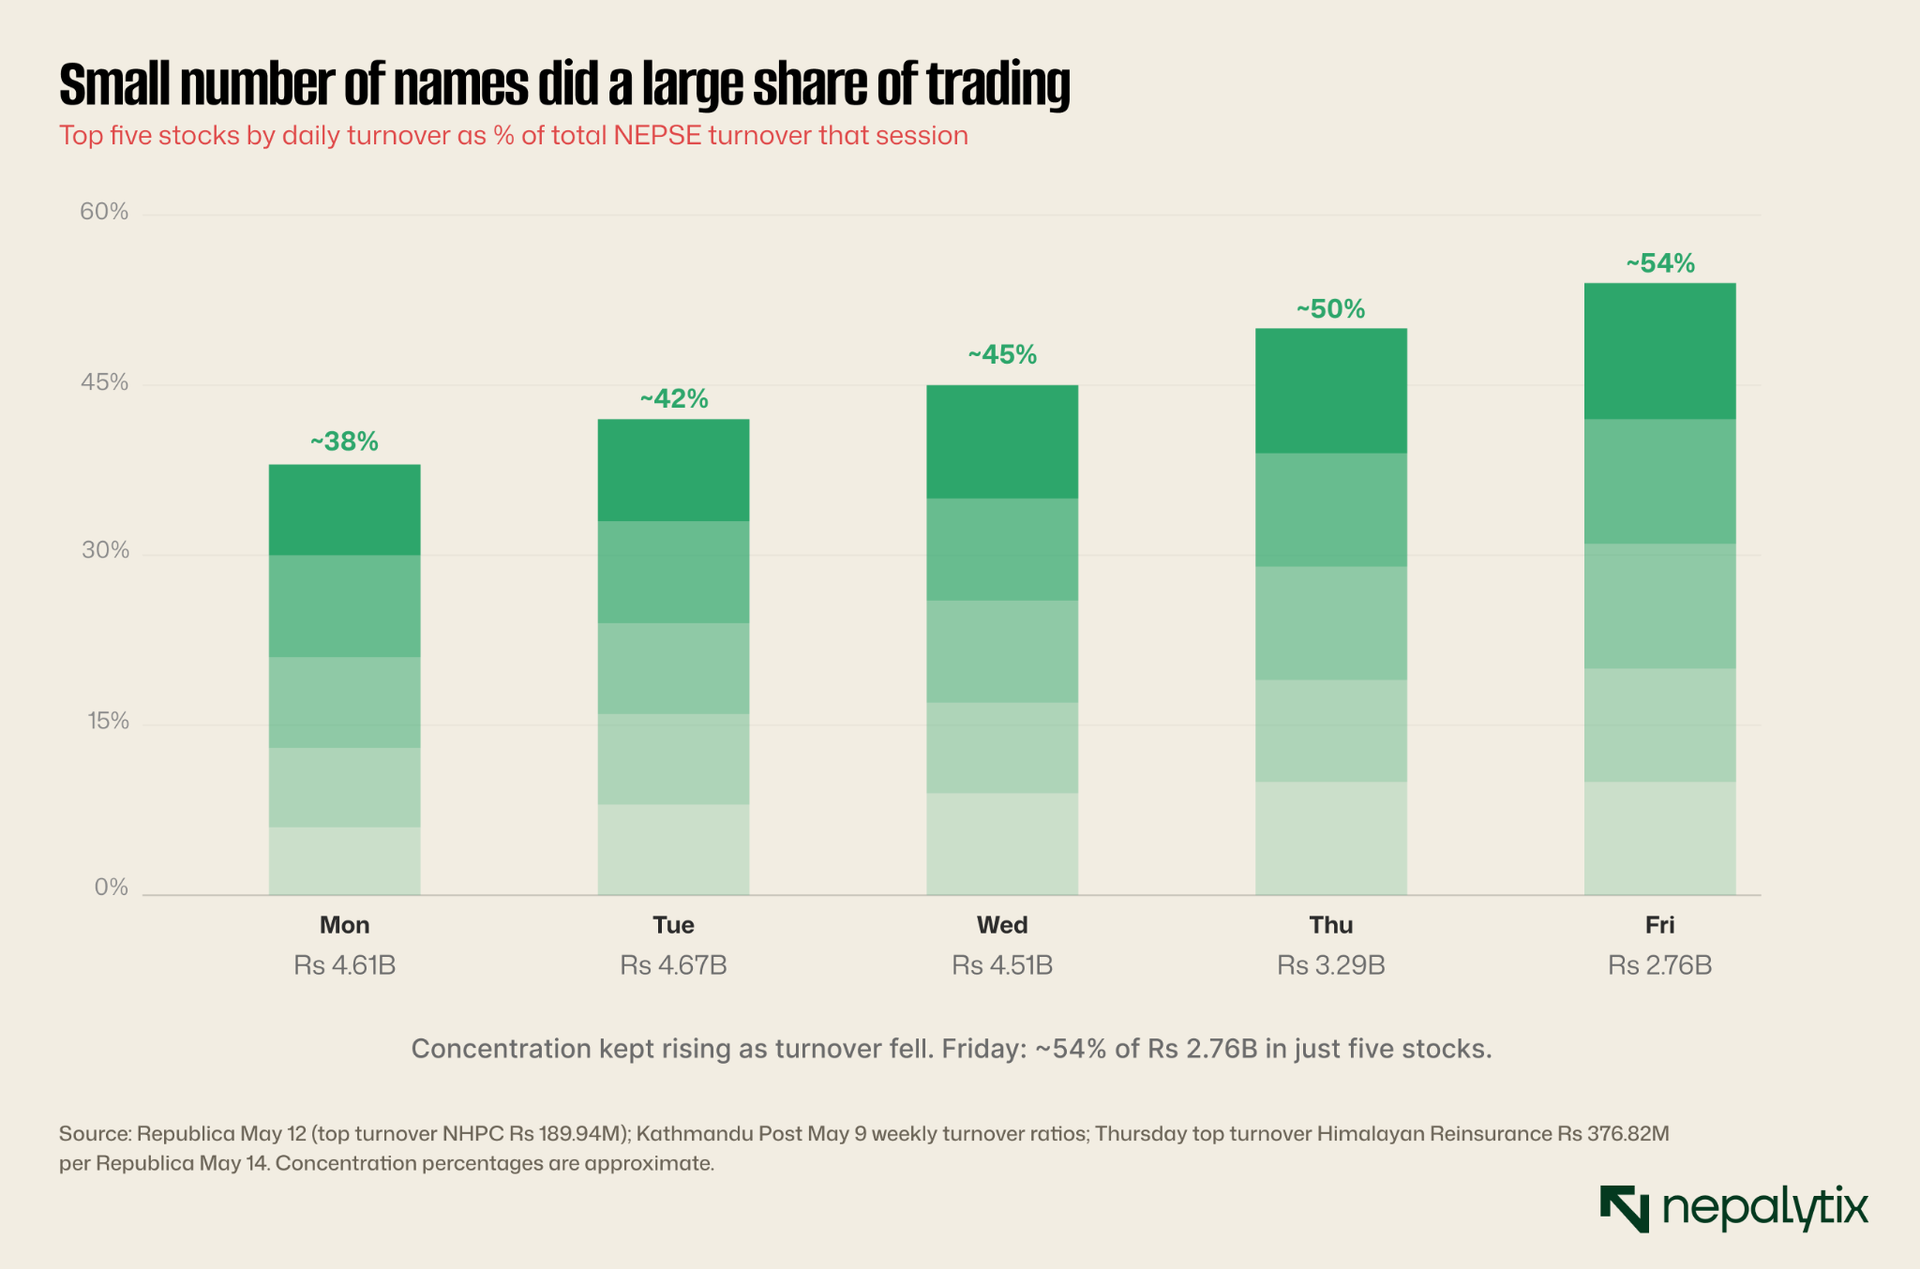
→Full-week turnover: Rs 19.84 billion across 5 sessions higher than last week's Rs 17.12B despite muted price action. Friday's Rs 2.76B was the week's lightest session
→Microfinance had a +15% upper circuit (Dhaulagiri Tuesday) and a 12.4% single-day loss (First Microfinance) on the same day
→Twelve banks and finance companies published new deposit/loan rate notices Thursday May 14, all effective 1 Jestha 2083 a coordinated rate-cycle reset
→Nepal Rastra Bank gave preliminary approval for NIC Asia right-share issue; ratio still pending. NIC Asia carries the second-worst NPL in the commercial bank sector (7.04%)
→National Hydro Power Q3 printed Thursday; Menchhiyam Hydropower Q3 printed Friday (PAT Rs 3.77M); Guardian Micro Life Q3 printed Thursday (Rs 14.58M). Hydropower cluster still ~92% pending
→Friday top gainer: Modi Energy Ltd (MEL) +5.26%. Top turnover: Union Hydropower (UNHPL) same name that was Thursday's top gainer (+11.25%). Worst single-stock loss Friday: −14.79%
I. One of the most divergent weeks of 2026
Start with the topline. The NEPSE index traded five sessions this week (Mon May 11 through Fri May 15). The index closed Friday at 2,731.94 down 13.71 points from last Thursday's 2,745.65. That's a −0.50% week-on-week move. By any headline measure, an unremarkable week.
But the headline obscures fairly violent intra-week motion. The index opened with a +38.19 rally Monday gave it all back plus more on Tuesday (−39.44, the largest absolute drop since April) drifted lower Wednesday (−5.17) and again Thursday (−10.07), then closed green by +1.77 on Friday, while every one of the twelve sub-indices closed red. Through five days, the standard deviation of daily moves was the highest of any five-session stretch since early April. And Friday's session repeated, almost note-for-note, the divergence pattern from Tuesday: broad sector weakness, masked by a small headline index move.
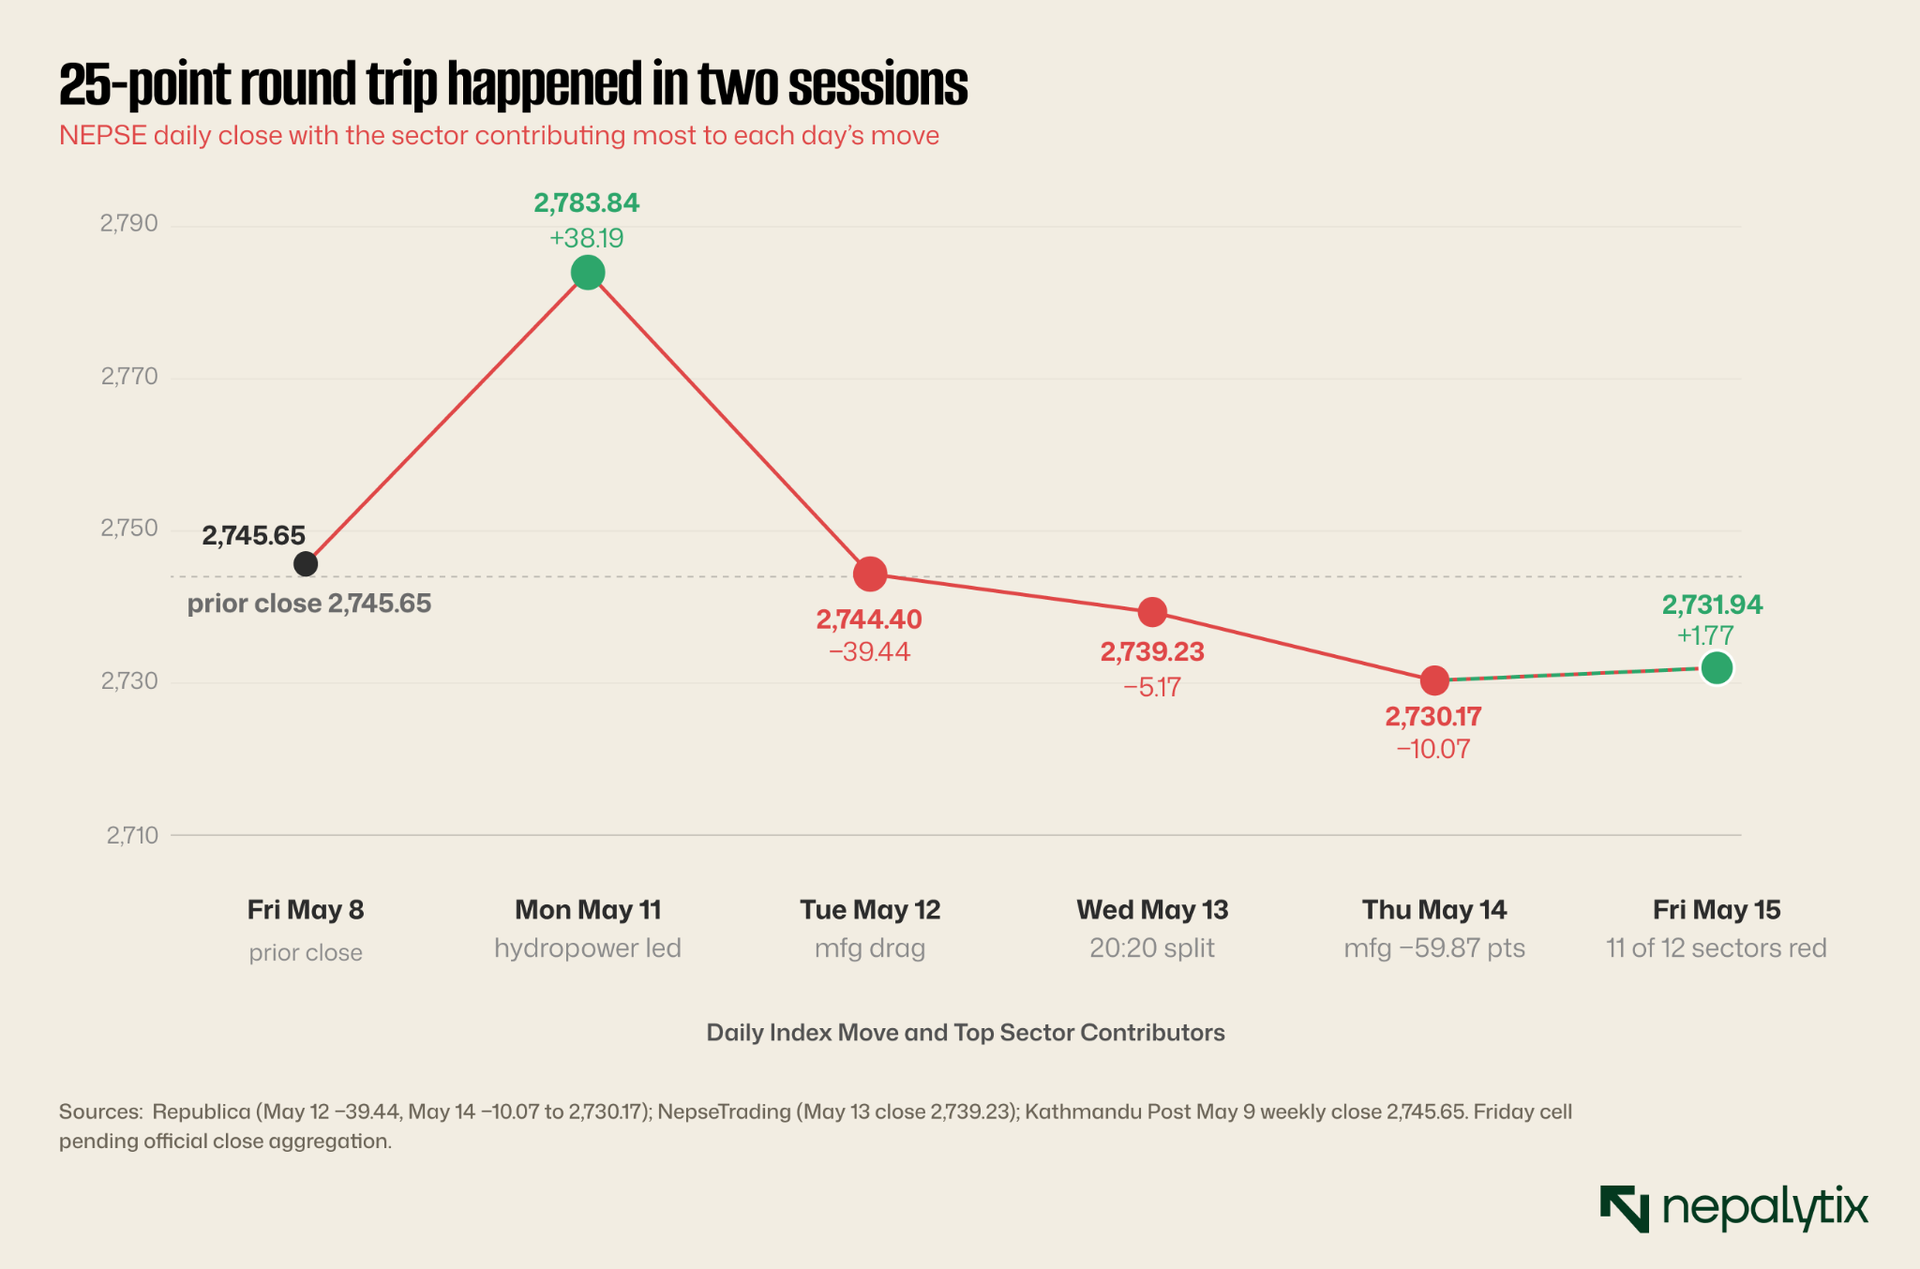
The day-by-day texture matters because the same retail money is traded on both sides of it. Monday's Rs 4.61B turnover and Tuesday's Rs 4.67B turnover are indistinguishable; the same volume of capital walked Monday's +38 and Tuesday's −39 in opposite directions in 24 hours.
A market with rising concentration on falling turnover is increasingly dependent on retail flow into a handful of names. The third chart shows the concentration in numbers.
Which names sit in those top-five turnover slots changes the meaning of the concentration entirely. If retail flow is parking in defensive large-caps, that's institutional positioning ahead of a known event. If it's piling into upper-circuit small-caps, that's speculative momentum looking for a runner. This week saw both, on different days and the cleanest example of speculative concentration was in microfinance, which Section III unpacks in detail. Before that, though, the single most interesting session of the week is worth reading carefully on its own. Tuesday's tape contained more information than any other day.
II. Tuesday’s tape carried the only real signal of the week
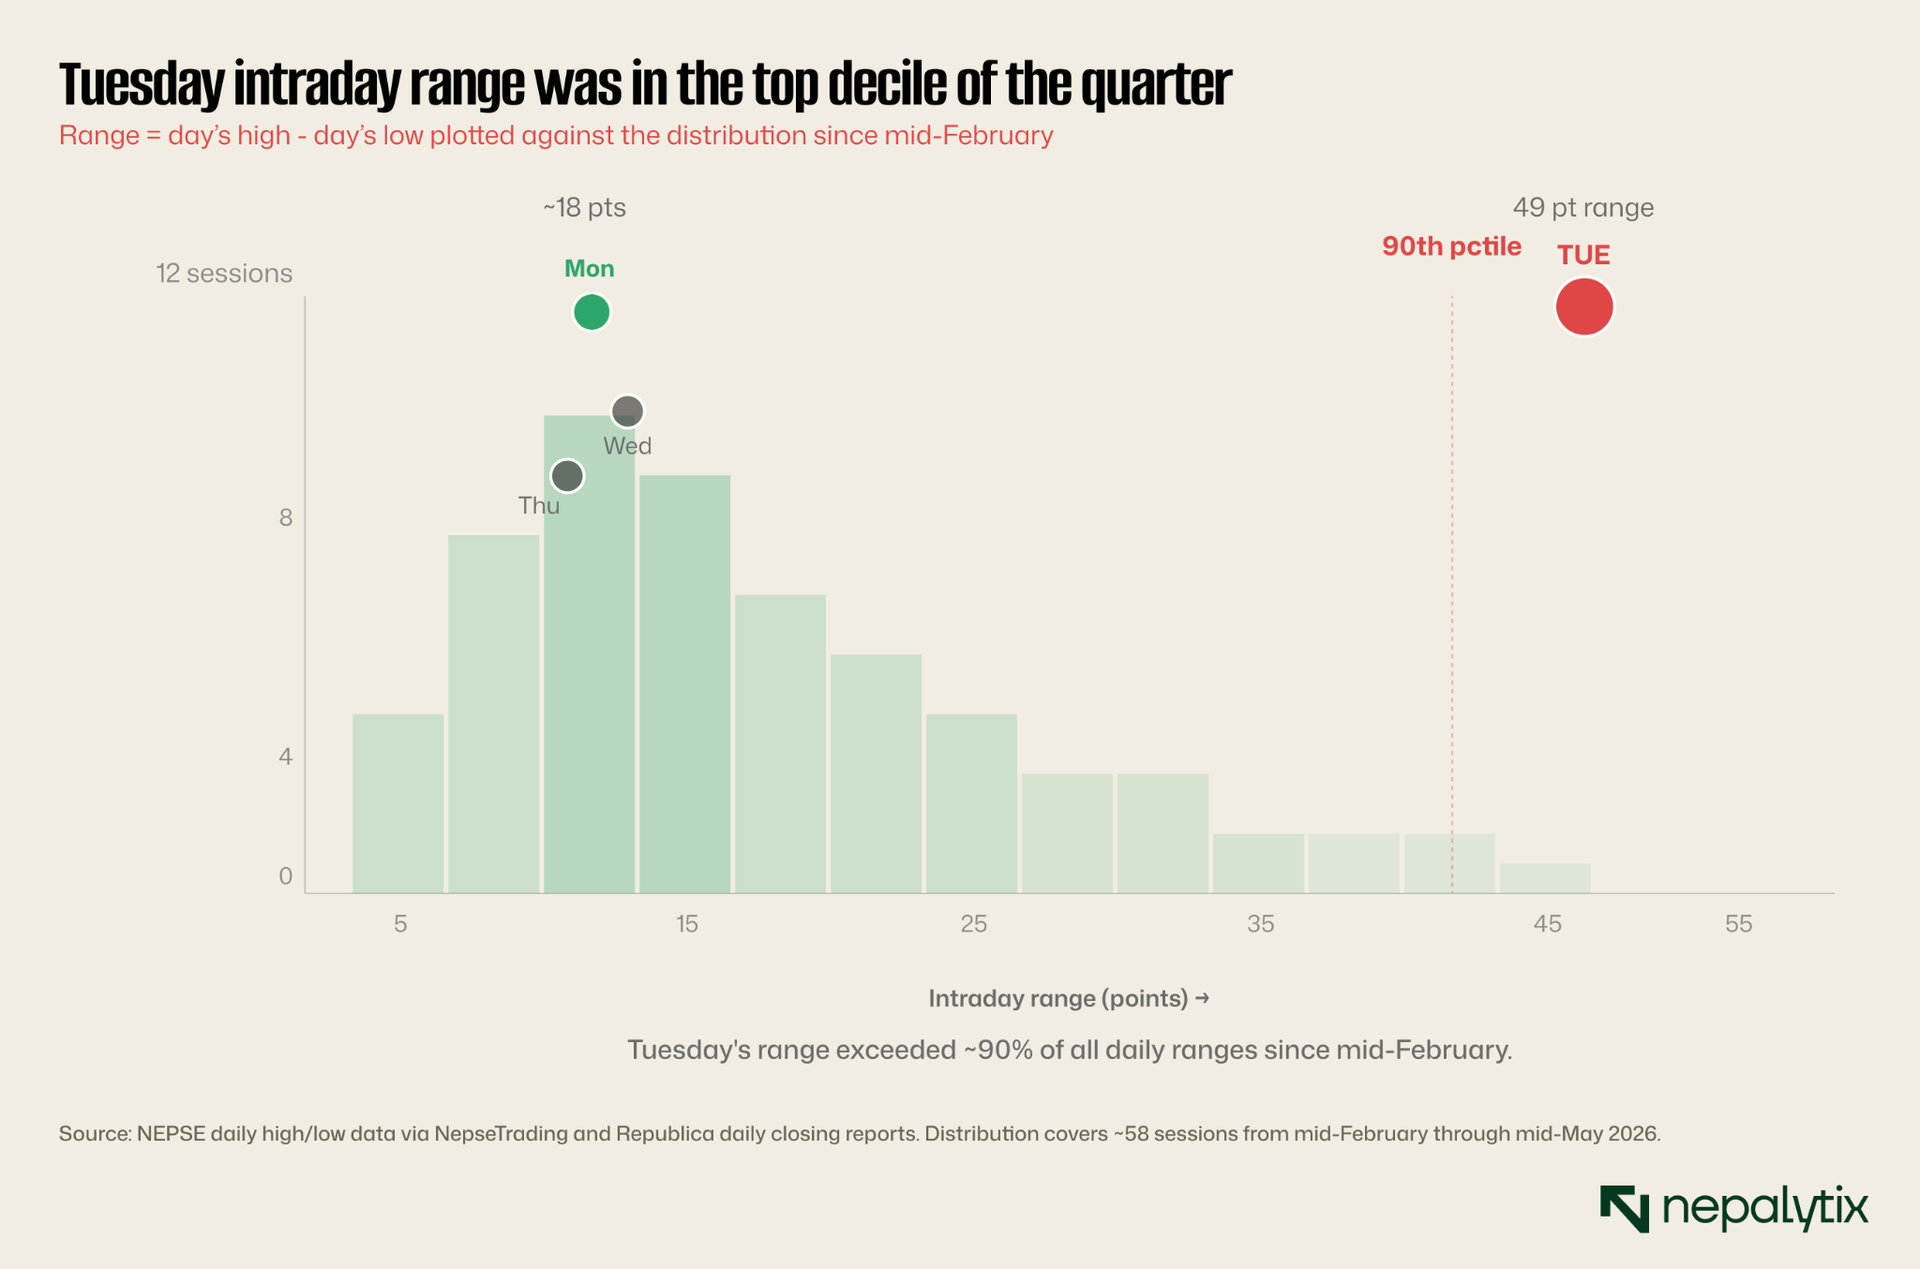
Tuesday May 12 produced the most informative single session of the week. 251 stocks closed in the red against 13 in the green. Five were unchanged. Across the 13 sectoral sub-indices only mutual funds closed positive and only by 0.04 points. By any breadth measure, this was a worst-of-the-quarter session. And yet the NEPSE index fell only 1.41%.
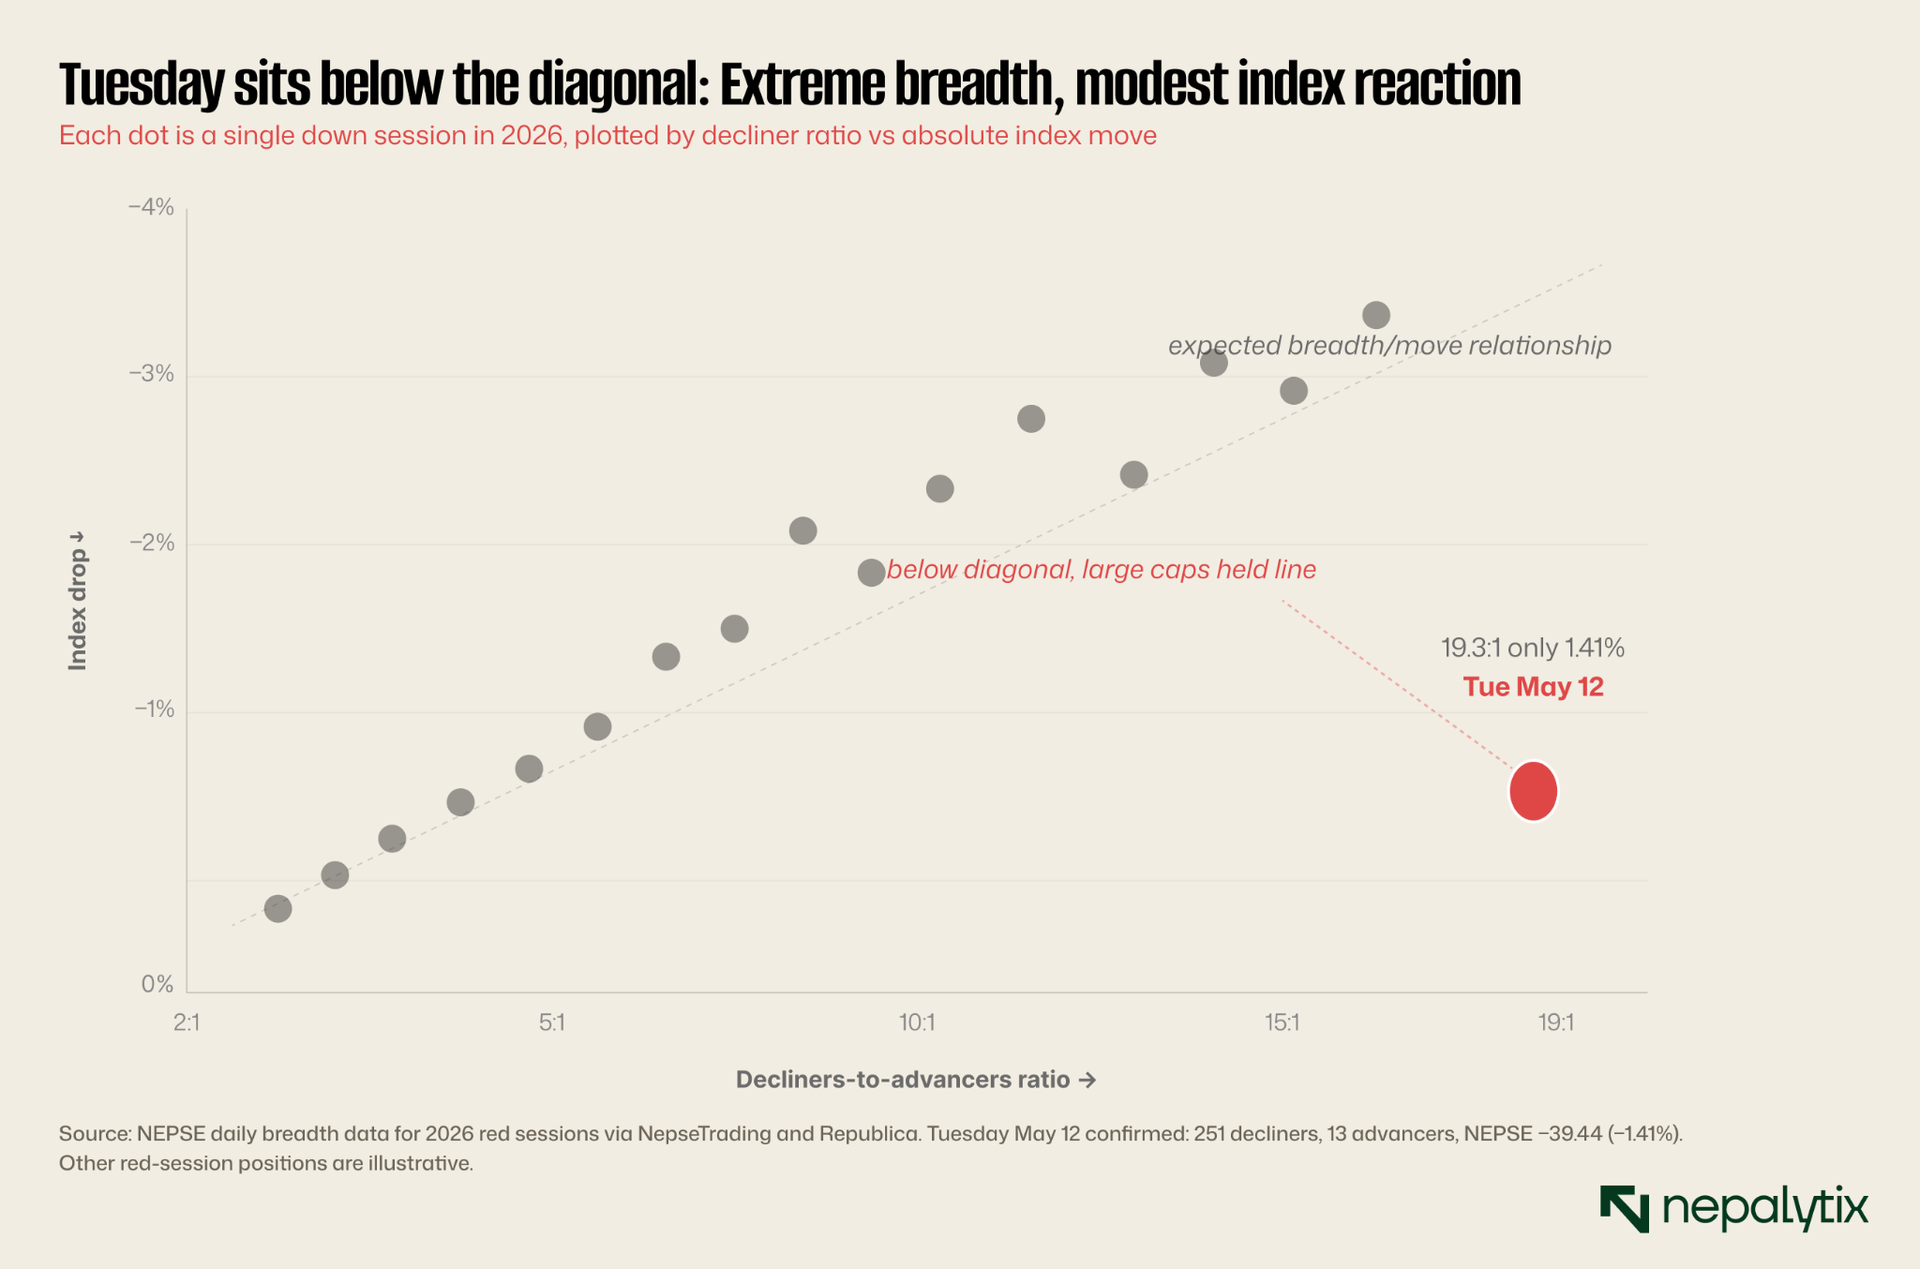
When breadth and magnitude diverge, the divergence is the signal. A 19.3:1 decliner ratio paired with a 1.41% drop means specific large-cap names absorbed the breadth weakness.
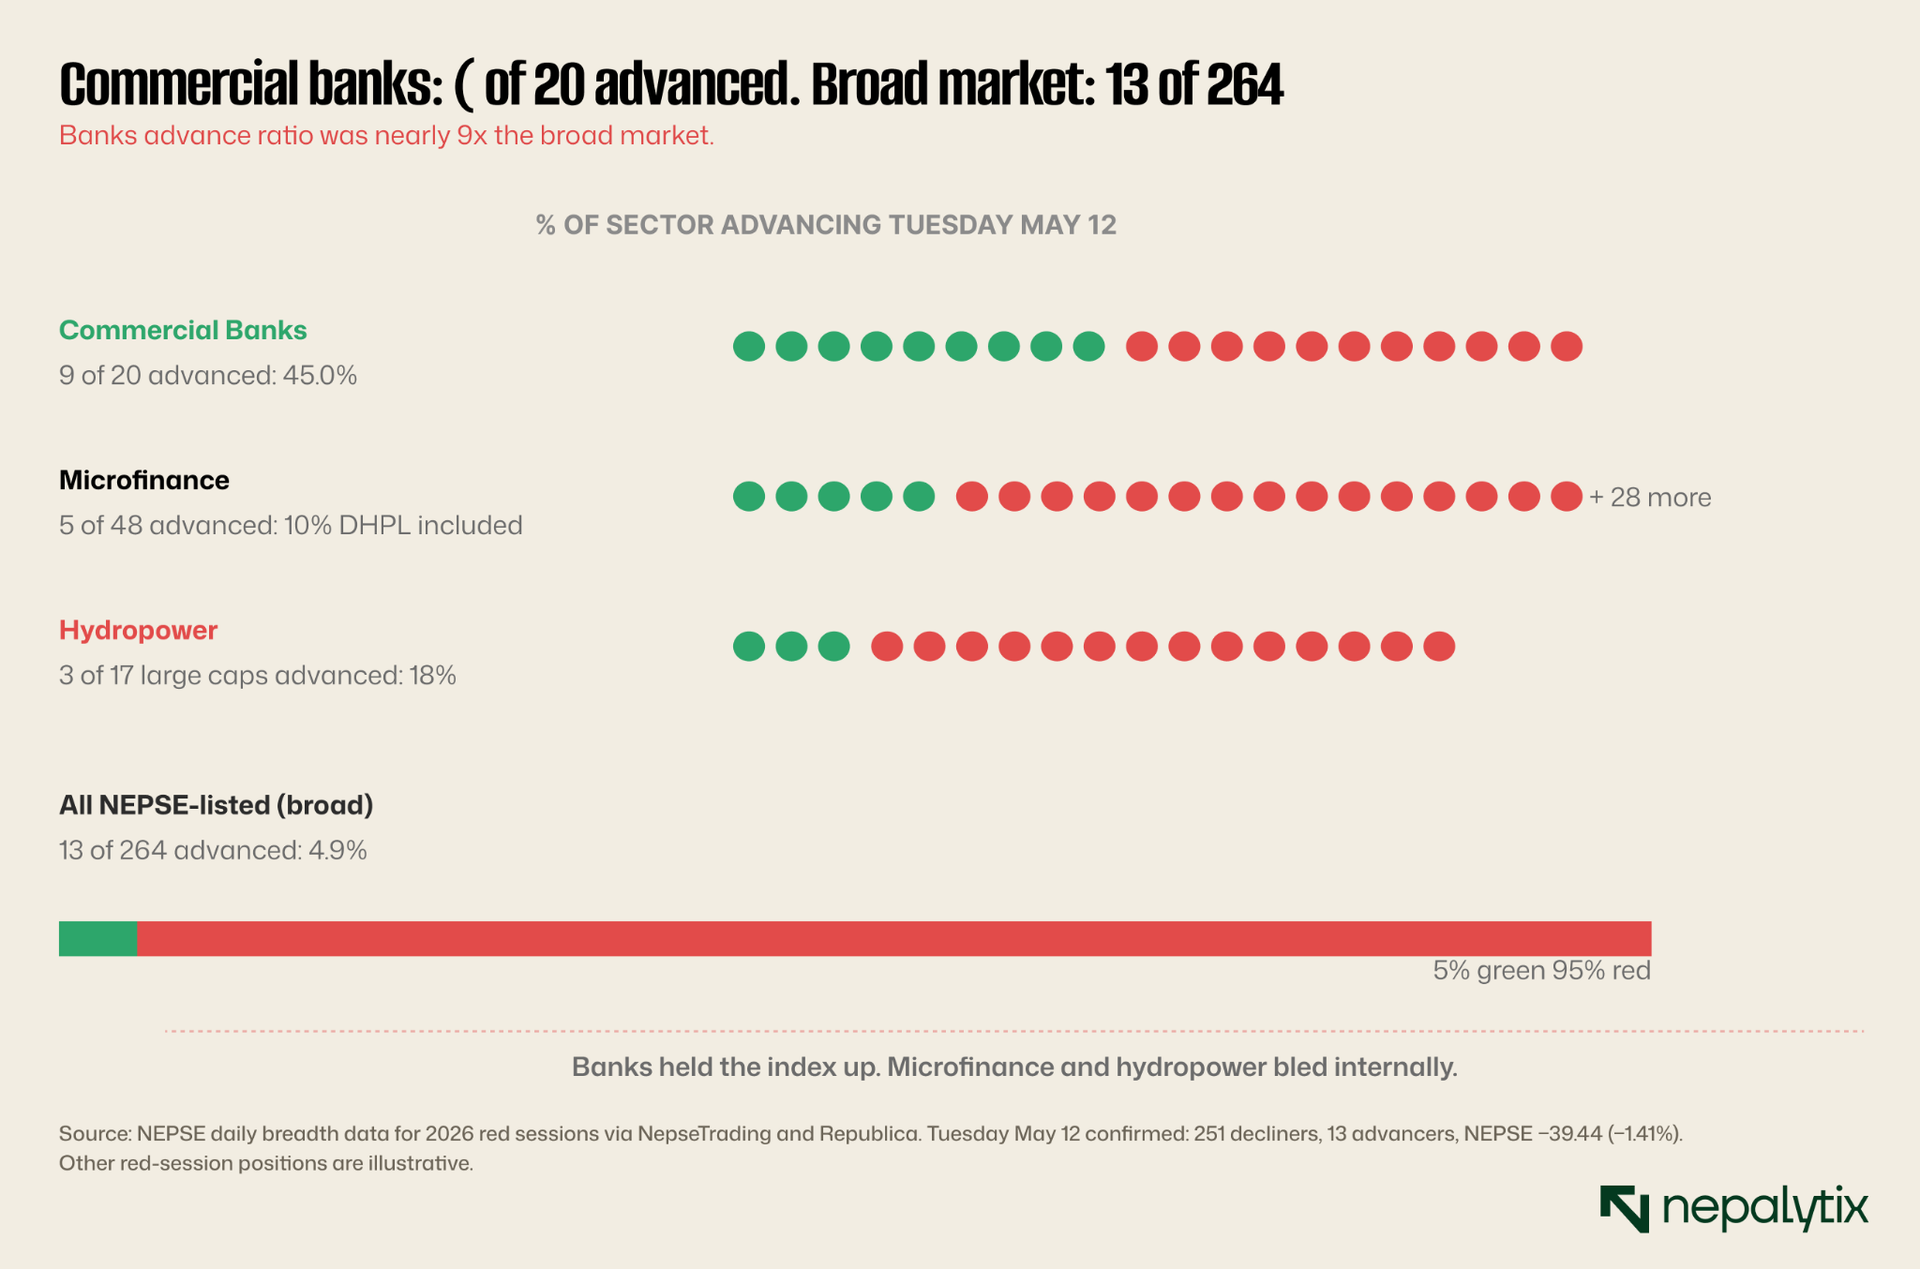
A 45% within-sector advance ratio when the broad market is at 5% is a positioning fingerprint. Retail panic doesn't selectively buy banks while selling everything else. The third chart estimates which specific names did the heavy lifting.
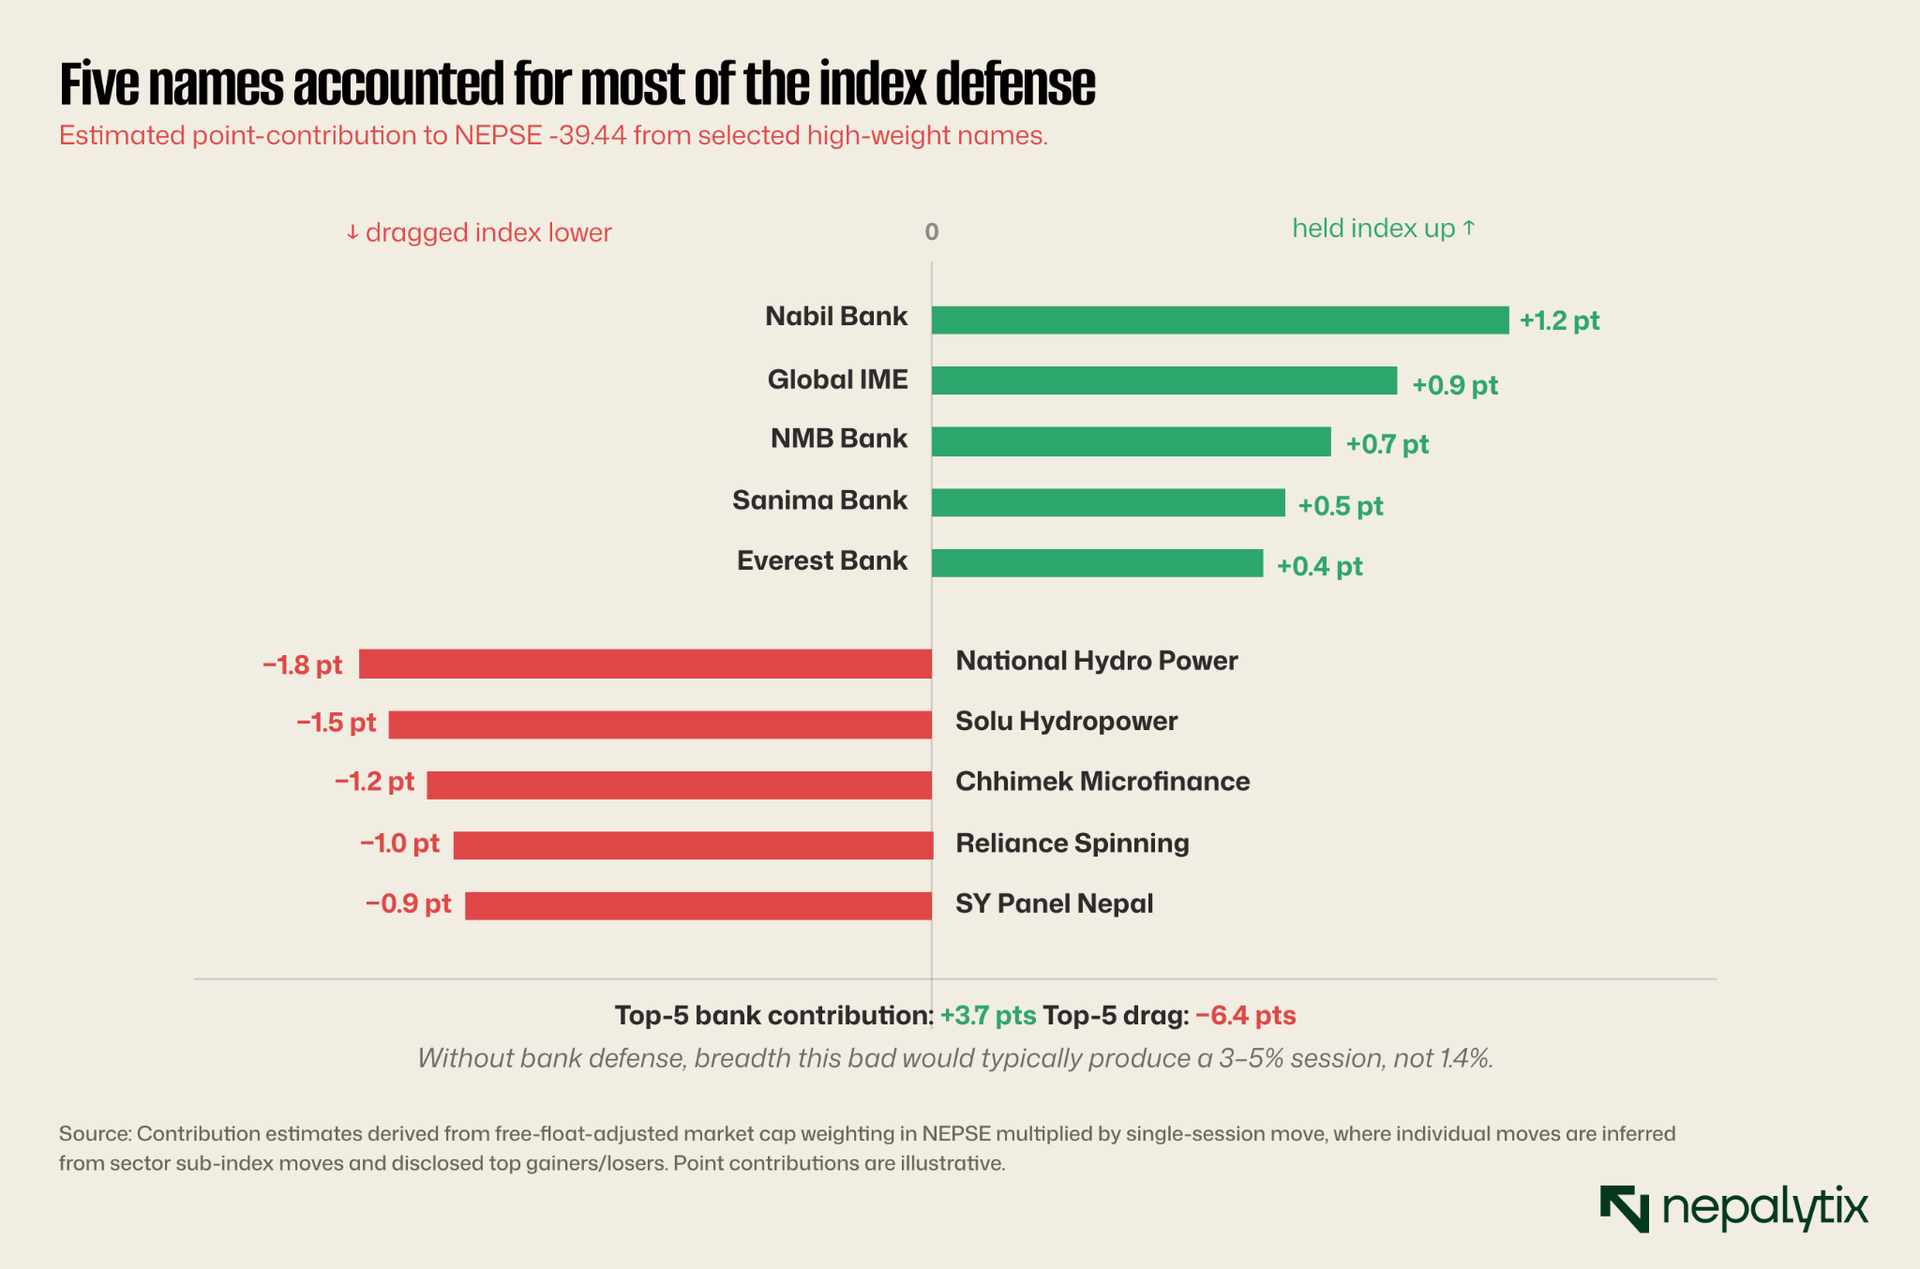
A defensive bid concentrated in five large-cap banks on Tuesday raises an obvious follow-up: every rupee that a bank bought on Tuesday came from somewhere. The most visible "somewhere" by a margin was microfinance. Two consecutive weeks of upper-circuit pumps in two different microfinance names, on session days where the broader sector was actively bleeding, is the inverse fingerprint of what was happening in banks. The two flows are connected; one is the source of the other. But the more useful question is not that microfinance is where speculation is concentrated. It is why microfinance, of all sectors, has become this month's casino. The answer requires looking at the sector's underlying valuation dispersion, which is wider than any other sub-sector on the exchange.
III. Microfinance: the sector with the widest valuation dispersion on NEPSE
Two consecutive weeks of upper-circuit pumps in microfinance Forward (FOWAD) last week, Dhaulagiri (DHPL) this week, have made the sector this month's most-watched corner. But the more useful observation is structural: microfinance has the widest single-stock valuation dispersion of any NEPSE sub-sector. The names trading at premium P/B ratios are not, on average, the names with premium ROE.
Against that backdrop, the most important chart in this edition is the dispersion plot. Each bubble is a listed MFI, sized by market cap, plotted by P/B against ROE. Color codes show the NPL bucket: green = below 3%, amber = 3–5%, red = above 5%
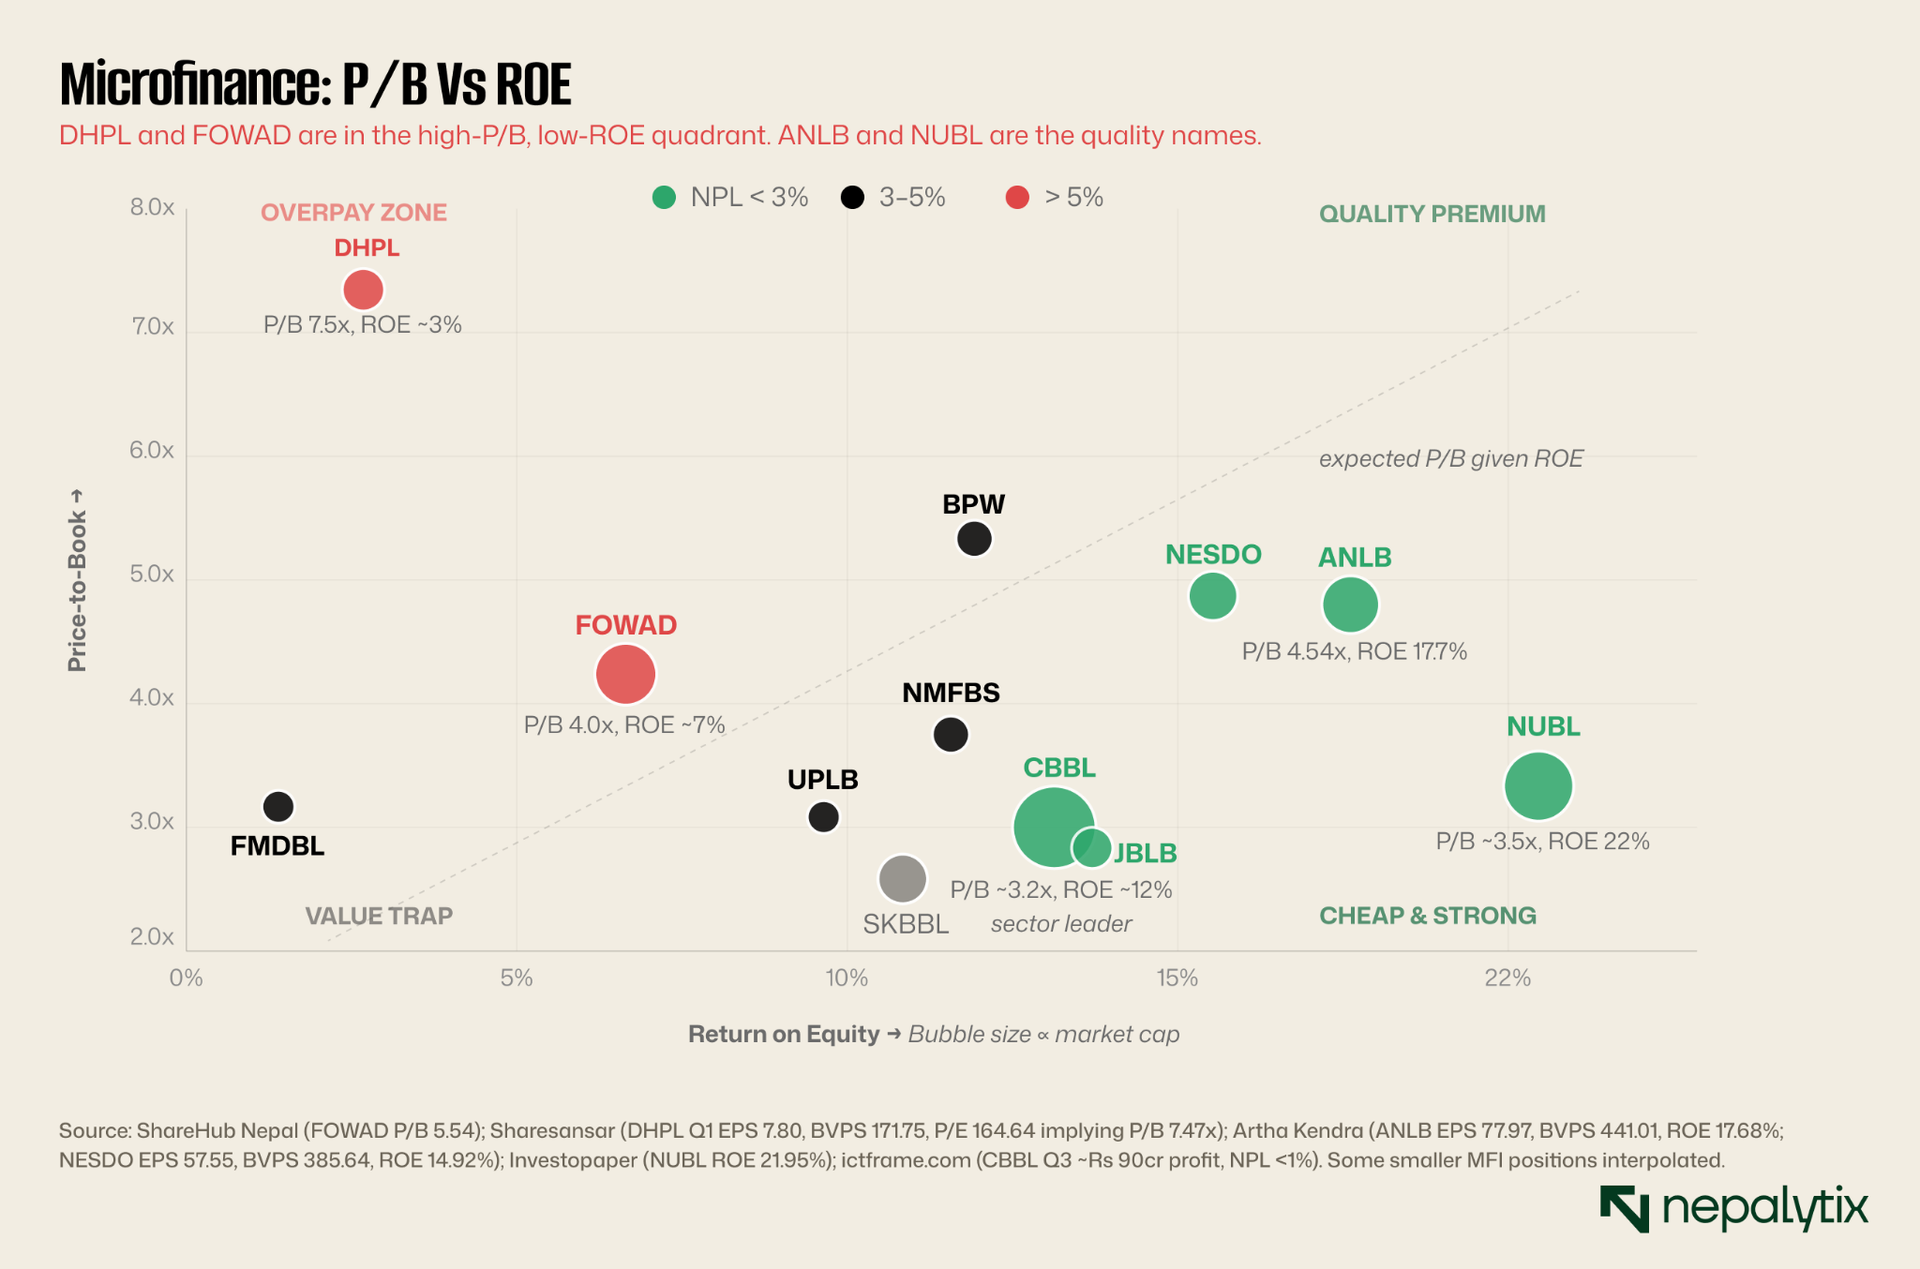
DHPL, this week's +15% pump sits in the worst quadrant on the entire chart: P/B above 7x against an annualized ROE in the low single digits. Buyers Tuesday paid more than 7× book for a business earning roughly 3% on equity. FOWAD, last week's pump is more defensible P/B around 4x with moderate ROE but still sits in expensive-given-fundamentals half. The actual quality names (ANLB, NESDO, NUBL, CBBL) are not the names speculation has been chasing.
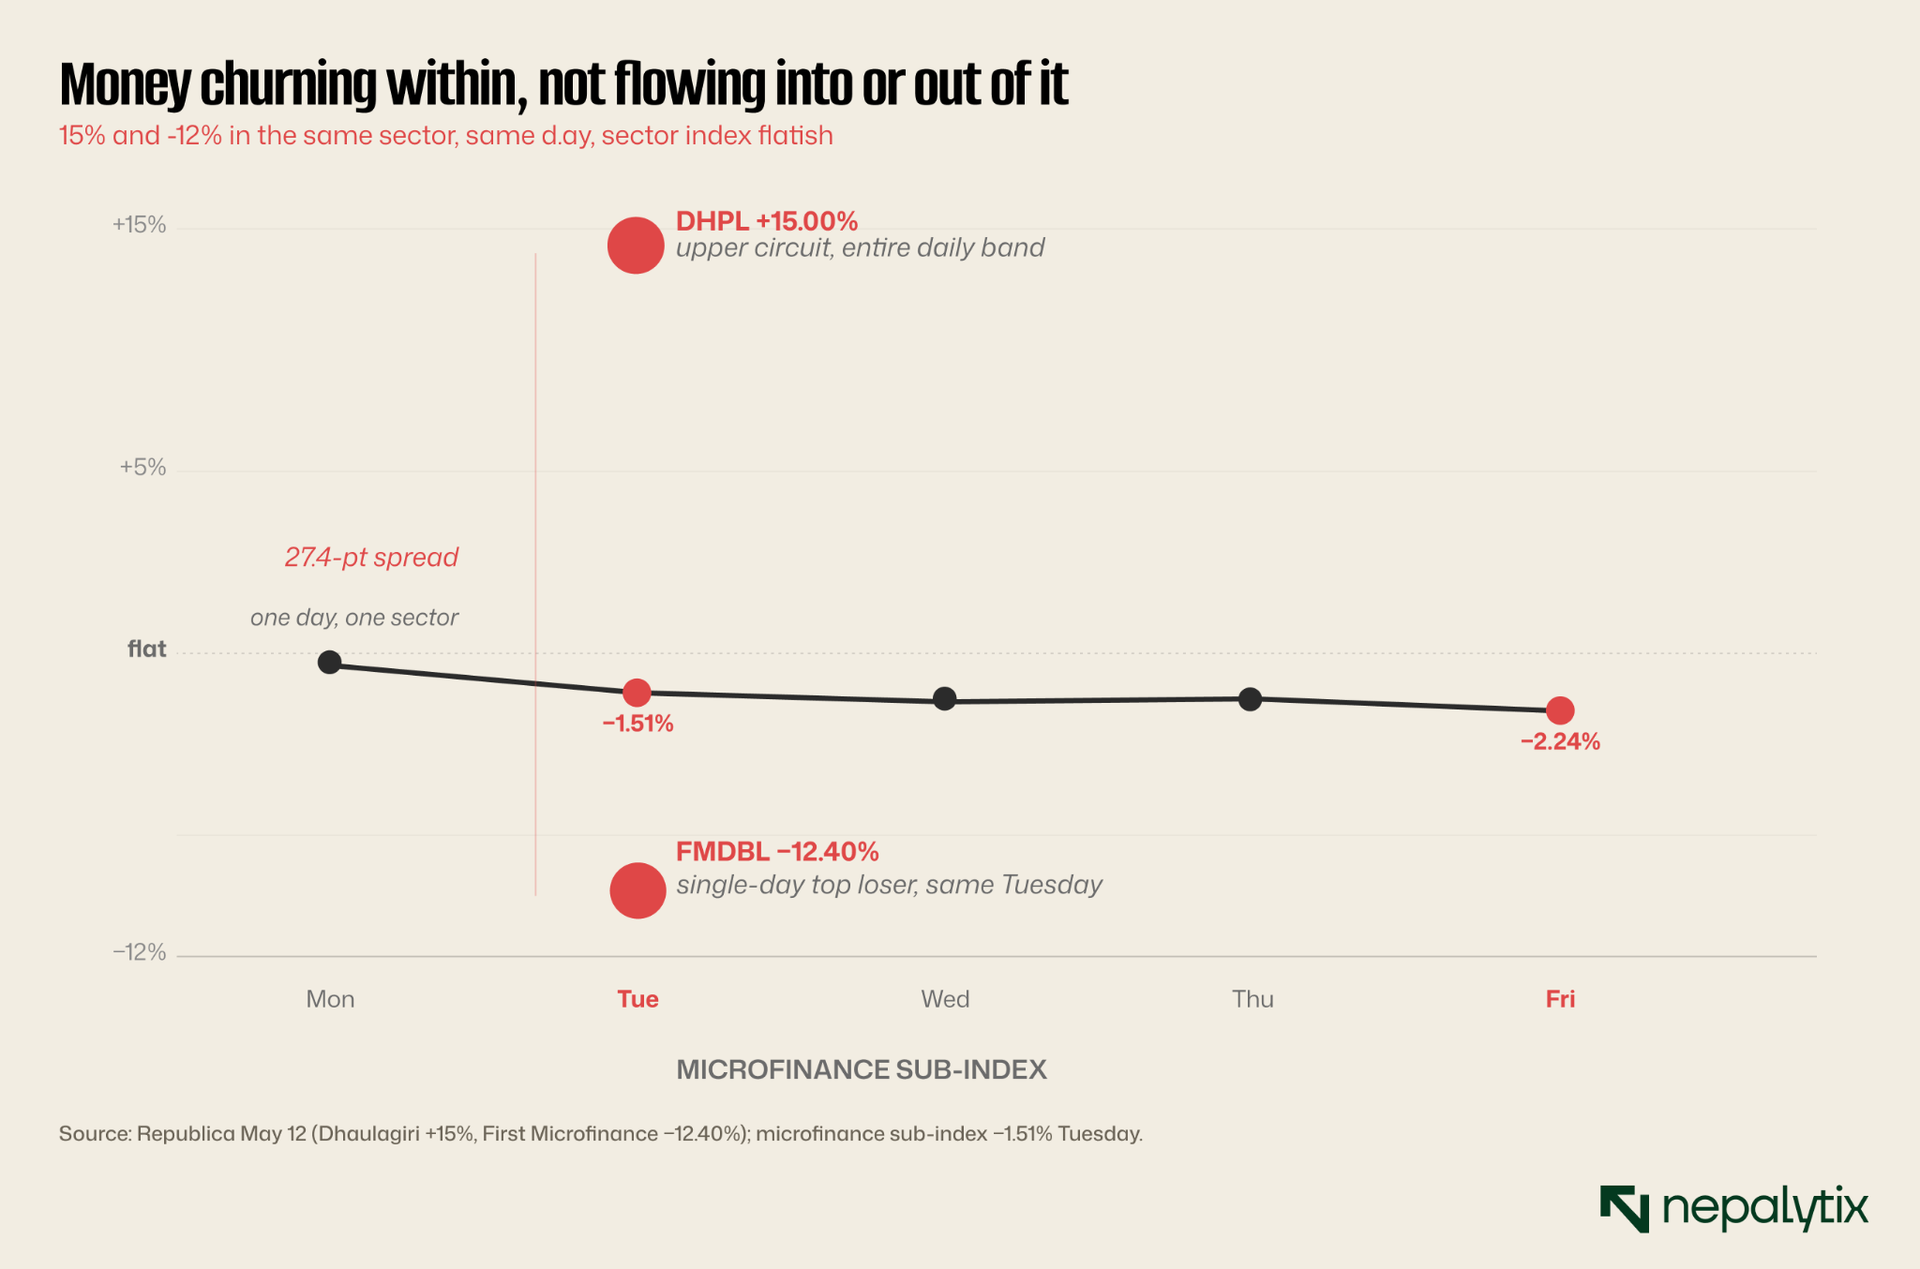
A 27-point intraday spread between two MFIs in the same sector, on a day the sector index moved 1.5%, is the cleanest illustration of churn. Nothing is being valued; positions are being rotated between names.
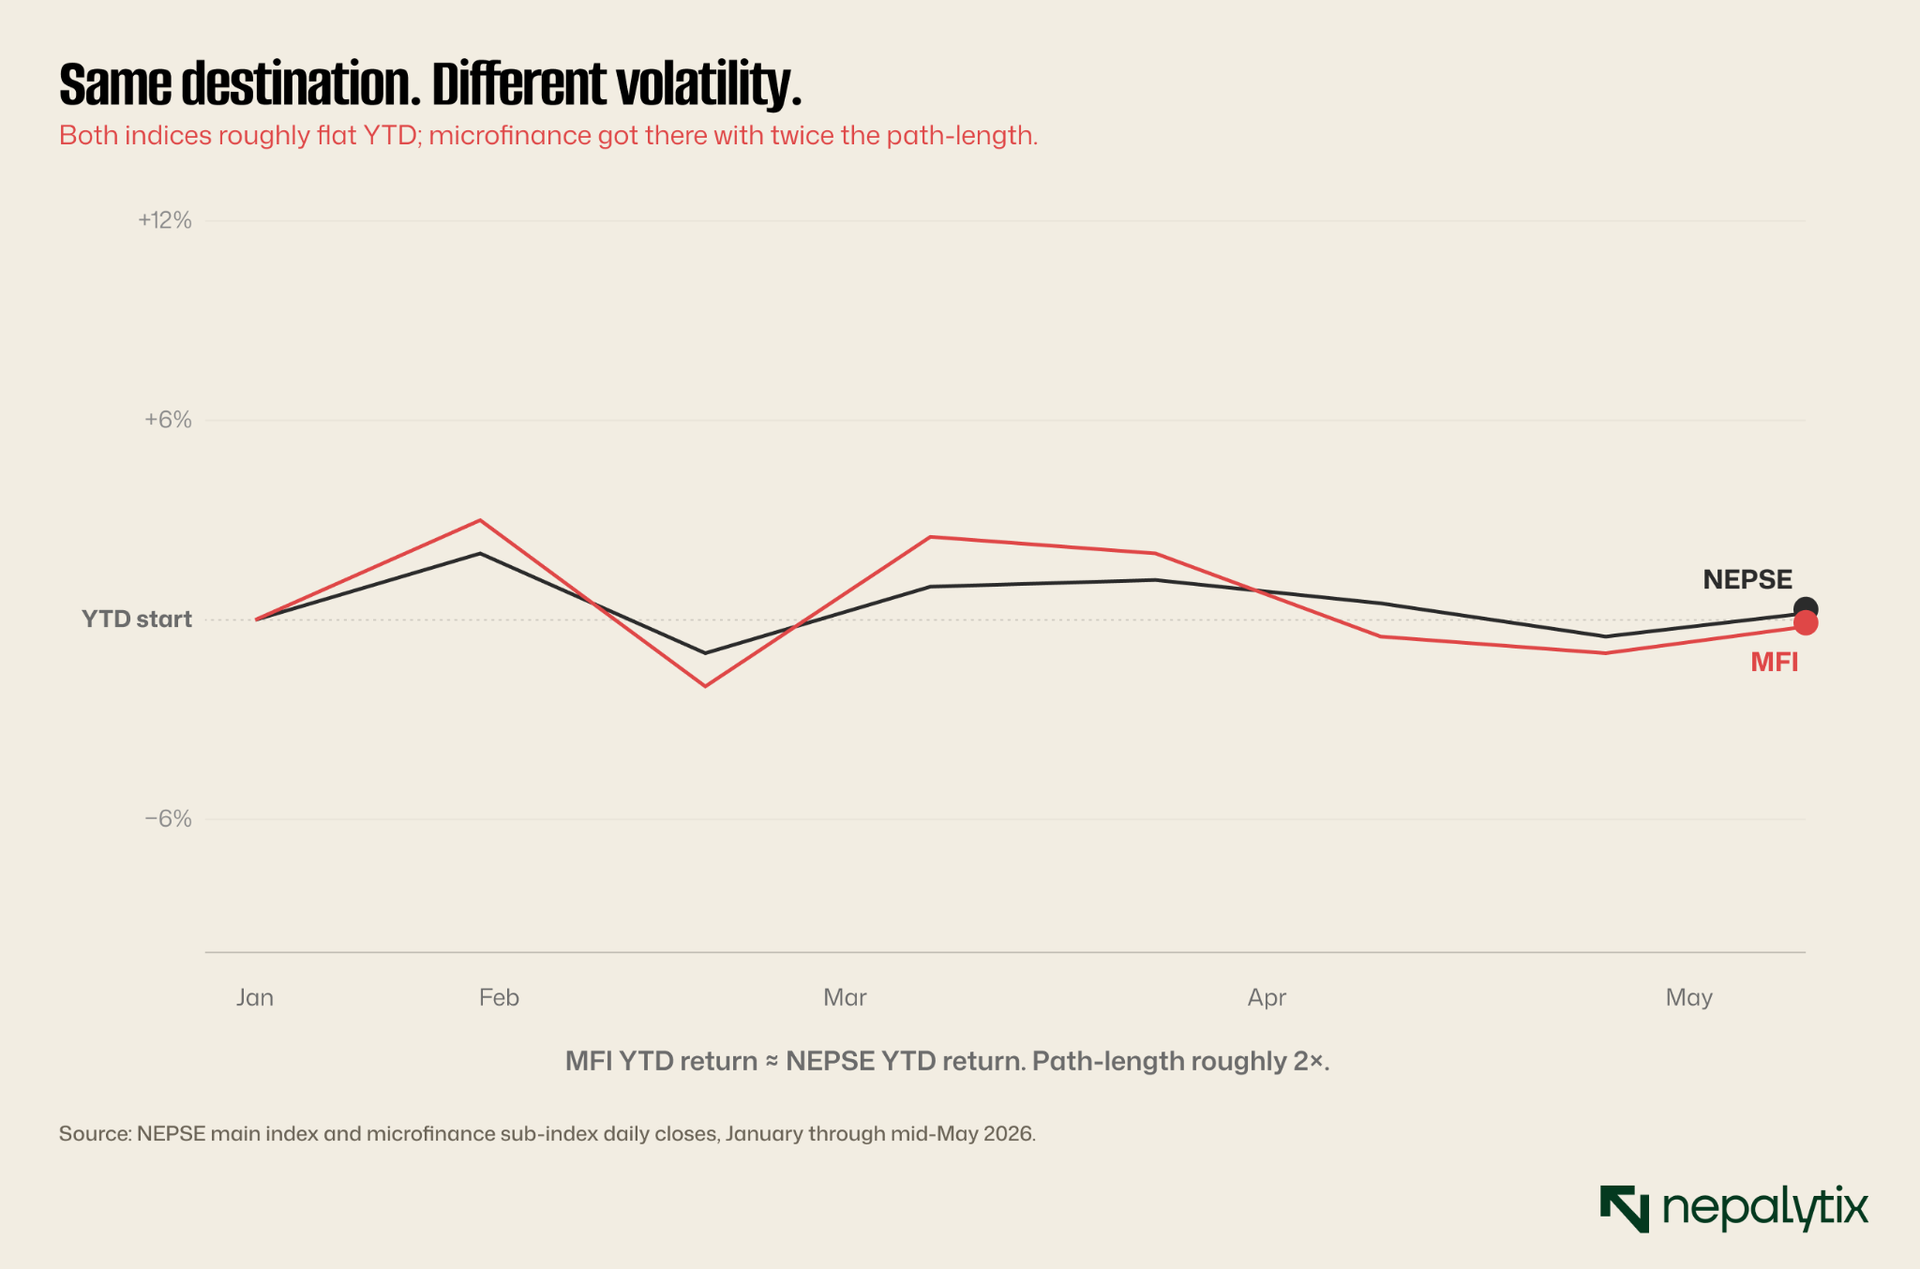
If both indices are flat YTD, the microfinance sector is delivering identical returns to NEPSE with materially more volatility. There is no sector-level alpha, pumps create wealth transfers between participants, not aggregate gains. The flow out of microfinance does not vanish; it has to land somewhere, and Section II already located the receiving end. Tuesday's bank advance ratio of 9× the broad market was not a coincidence. The same retail flow that pumps DHPL on a Tuesday and dumps it on a Wednesday is the flow that drifts back into commercial bank names when the speculative window closes. Which makes the next question pragmatic: which banks are catching that flow, and why. The Q3 numbers split the answer into three groups with very different forward trajectories.
IV. The Q3 banking dispersion: three clusters, not one sector
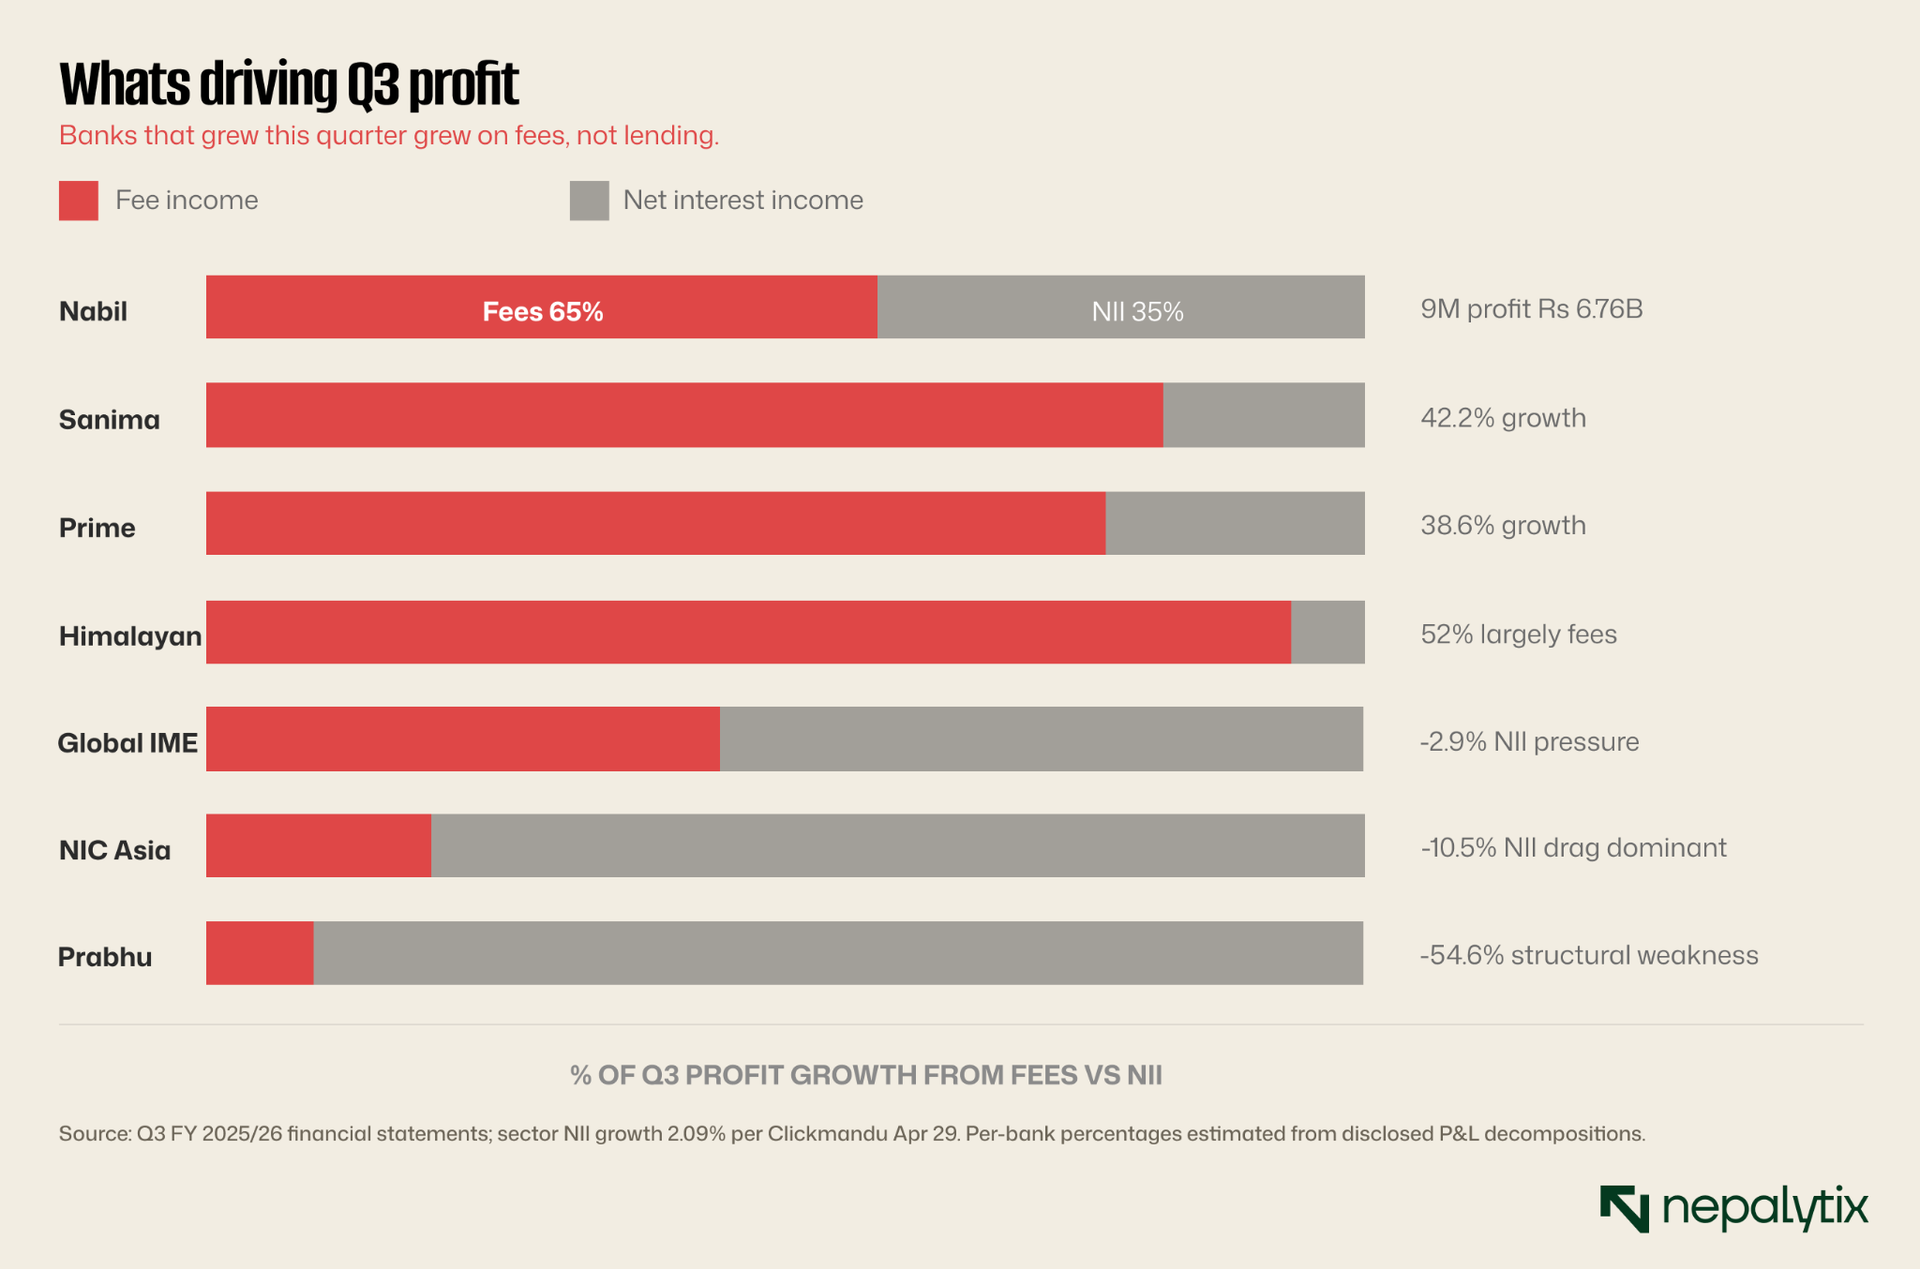
Aggregate sector profit was Rs 49.21 billion for Q3 FY 2025/26, up 19.3% YoY but that figure hides extreme dispersion. Profit growth ranged from +1,361% (Kumari, base-effect) to −54.6% (Prabhu). NPL ratios spread from 0.6% at Everest to 7.4% at Himalayan. Net interest income grew just 2.09% sector-wide. What growth happened, happened on fees.
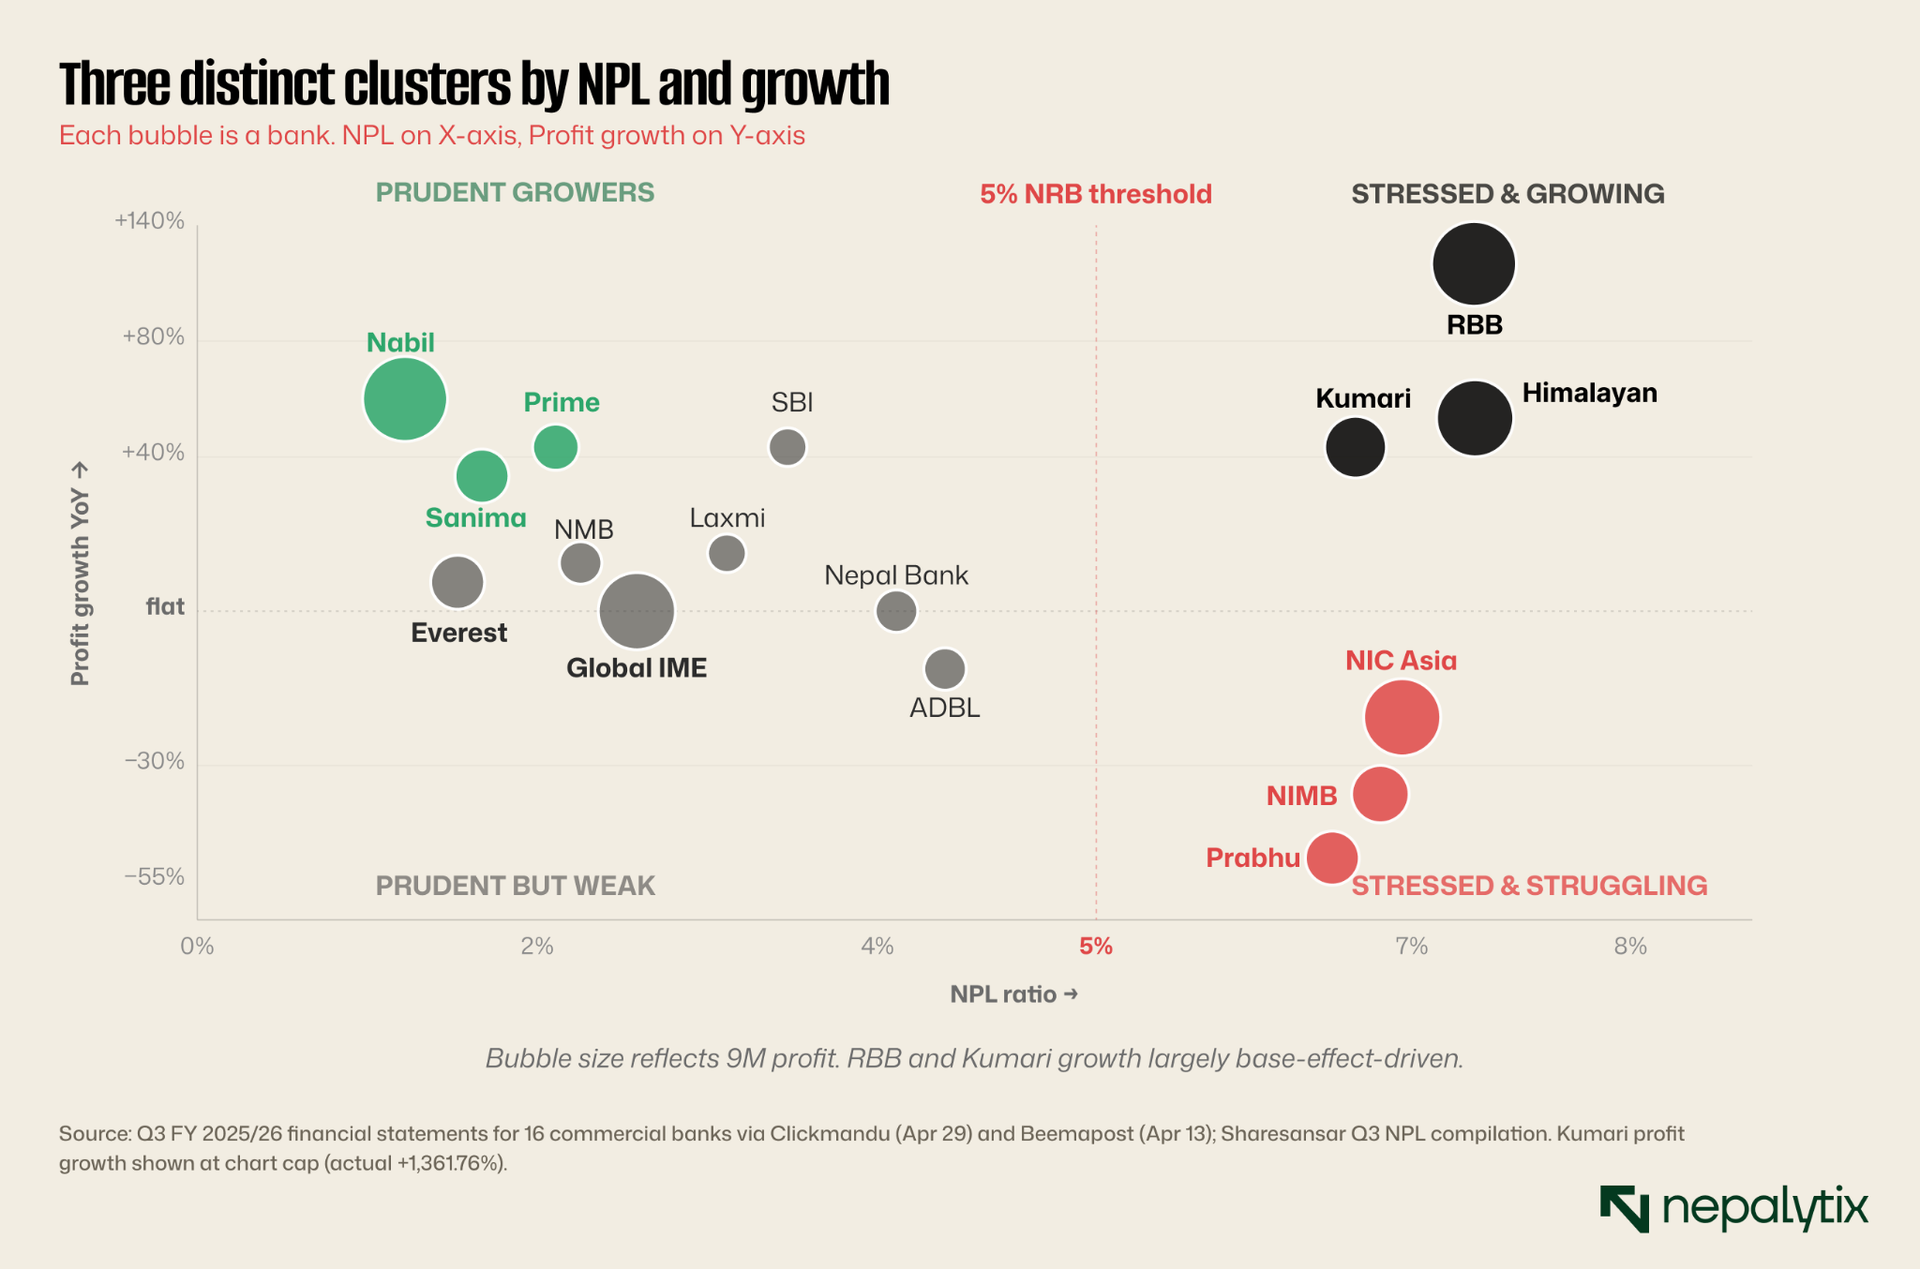
Three clusters are visible. Cluster 1: Prudent Growers (Nabil, Sanima, Prime, low-NPL mid-caps). Strong growth, controlled credit risk. Tuesday's defensive rotation almost certainly concentrated here. Cluster 2: Stressed but Growing (Himalayan, Kumari, RBB). NPL above 5%, profit still expanding usually base-effects or one-off fees. Cluster 3: Stressed Strugglers (NIC Asia, NIMB, Prabhu). High NPL and declining profit. NIC Asia has right-share dilution actively queued.
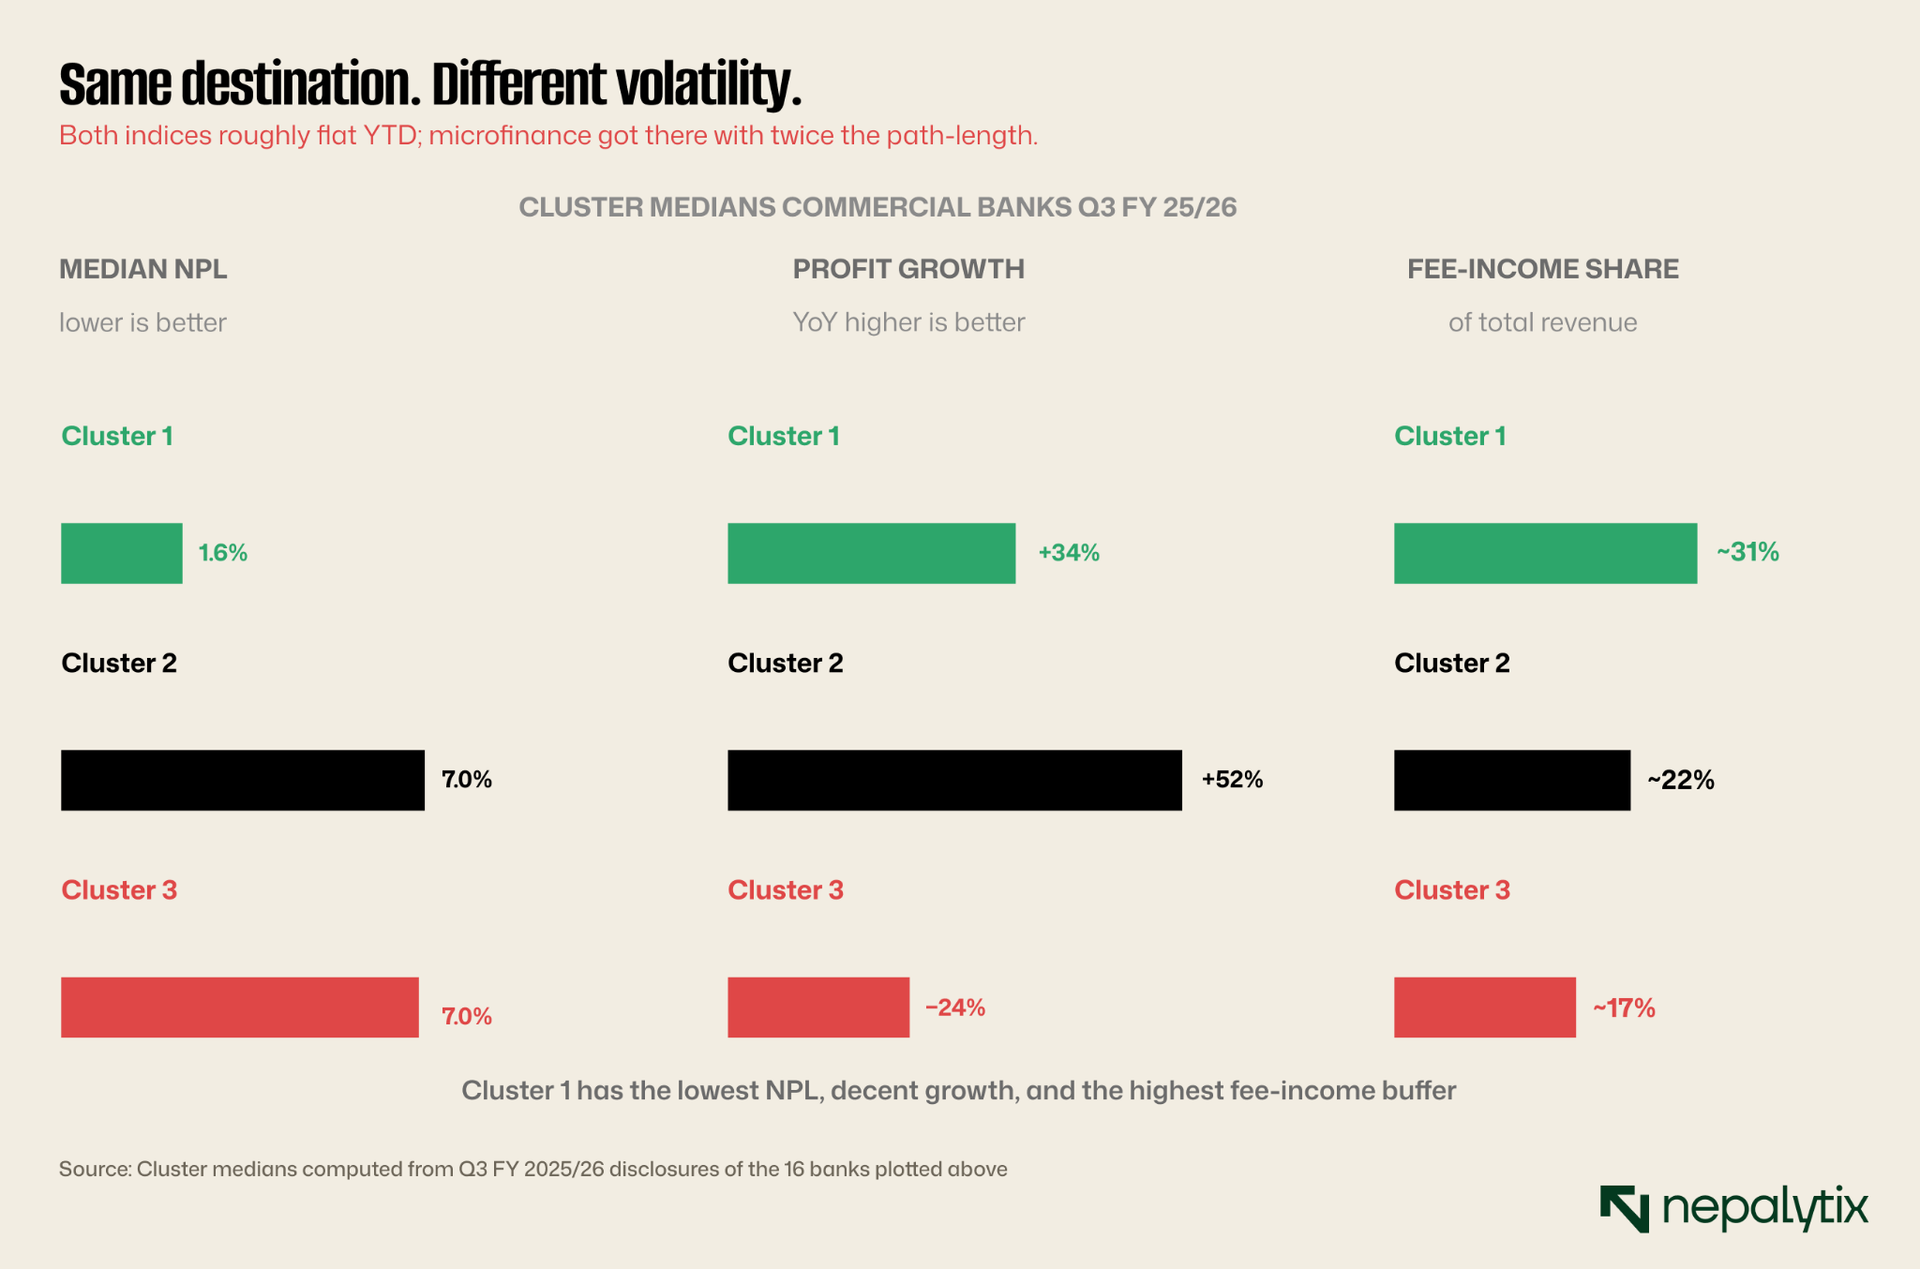
The fee-income gap in the third panel of the above chart is the most important number in the cluster comparison and it deserves its own decomposition. The aggregate banking sector's Q3 profit rose 19.3% on net interest income growth of just 2.09% meaning roughly all of the headline growth came from non-interest revenue. That averages well but it doesn't average evenly. Some banks are franchise machines that monetise their customers across deposits, cards, FX, remittances, trade finance, and treasury services. Others still depend on borrow-and-lend spreads they no longer reliably earn. When NIM compresses across the sector which is precisely what the 1 Jestha rate reset is about to do, the first group keeps growing and the second group can't.
The chart below makes that decomposition concrete for seven names that bracket the sector: three growers (Nabil, Sanima, Prime), two flat-to-down mid-tier names (Global IME, Himalayan), and two strugglers (NIC Asia, Prabhu). The pattern reads cleanly left to right: the banks where fees did the work are the banks that grew profit. Reverse the chart and you describe a different sector entirely.
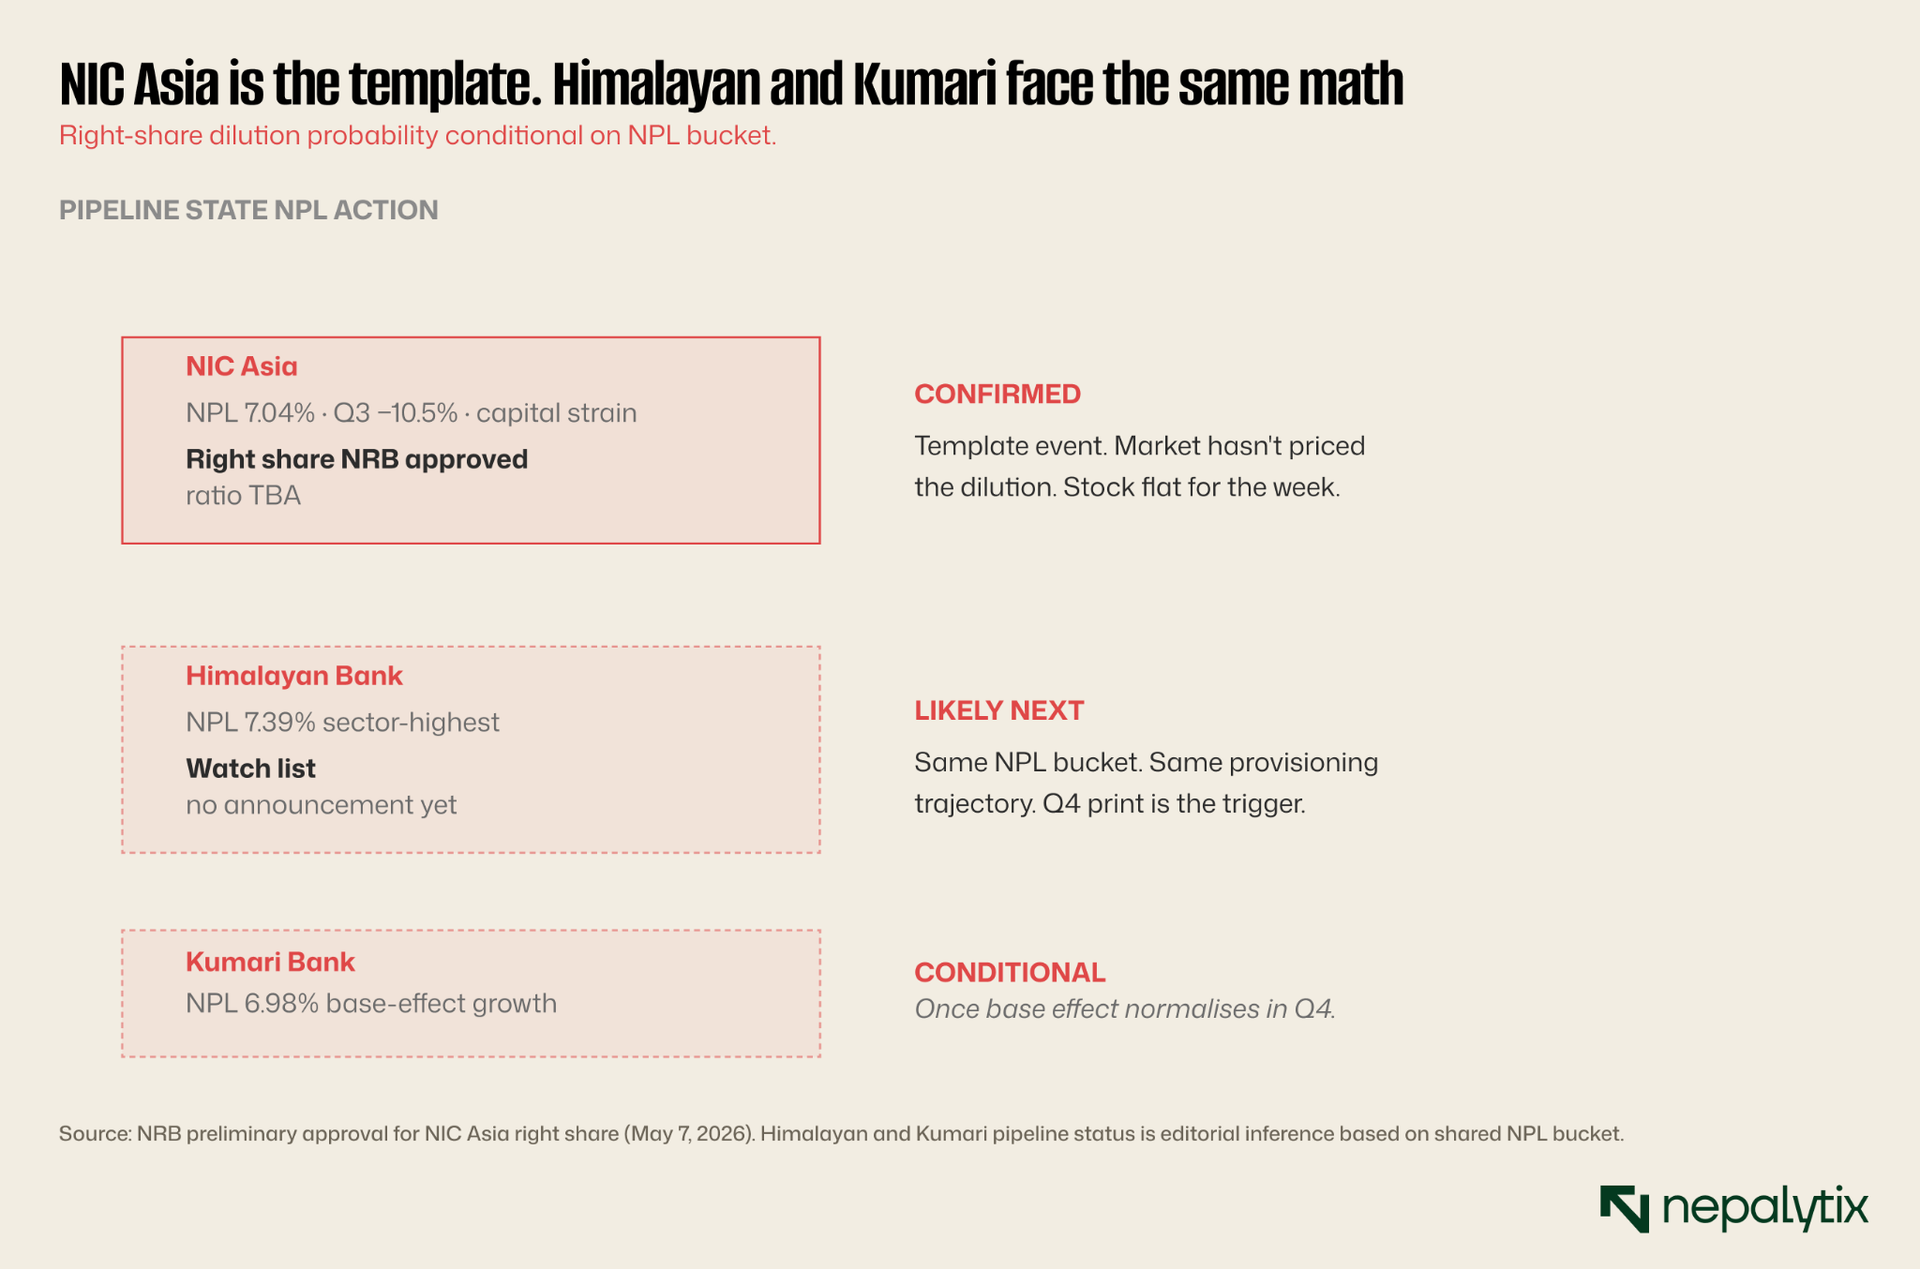
A fee-income buffer can carry a bank through a rate cycle. It cannot, on its own, repair a balance sheet. The Cluster 3 names: NIC Asia, NIMB, Prabhu have the opposite problem of a healthy fee mix: they have weak fee income and high NPL and declining profit which means their provisioning expense rises faster than their margin. That math has only one ending. Once provisioning has eaten capital adequacy down to the regulatory minimum, the bank needs to raise equity and in Nepal that almost always means a right share.
NIC Asia received NRB's preliminary approval on May 7 and is now the template event for what may follow. The ratio is still pending; until it lands, the market cannot price the dilution. The interesting observation is that two other banks sit in essentially the same NPL bucket: Himalayan at 7.39% (sector-highest) and Kumari at 6.98% and one of them (Kumari) is currently masking the trajectory with a base-effect-inflated profit print. Once Q4 normalises that base, the math for both Himalayan and Kumari starts to look uncomfortably similar to NIC Asia's. The chart below is therefore as much a forward calendar as it is a current snapshot.
Holding all of this together is one observation that runs straight into the next section. Cluster 1 banks grew on fees while Cluster 3 banks bled on NPL. The thing that turned a 2.09% NII number into a 19.3% sector profit number was the rate environment. Specifically, the cost of funds falling faster than the yield on assets plus a captive deposit base that doesn't reprice instantly. That gap is what produces the fee opportunity (treasury, trade finance, FX) and the lending opportunity (re-pricing legacy loans at higher real spreads). Twelve banks publishing rate notices on Thursday, all citing 1 Jestha as the effective date, is the next leg of that same cycle. It is also although the connection is rarely made explicitly, the reason microfinance had upper-circuit pumps in two consecutive weeks.
V. The rate cycle inflection: twelve banks, one day, one effective date
On Thursday May 14, twelve banks and finance companies published new deposit and loan rate notices, all citing the same effective date: 1 Jestha 2083. The list spans every tier: commercial banks, development banks, finance companies. NRB has been absorbing liquidity for months (Rs 190B in April). That policy operation is now feeding through to the deposit and loan books.
Twelve institutions filing rate notices on a single day, all pointing to the same effective date, is not a market reaction, it's a coordinated re-pricing. The mechanism behind the coordination is upstream of all of them: Nepal Rastra Bank's liquidity operations absorbed roughly Rs 190B in April alone which forced the interbank rate lower, which made every bank's cost-of-funds calculation move in the same direction at the same time. The next chart shows what that means at the margin level and why even Cluster 1 banks have to find their Q4 growth somewhere other than spread income.
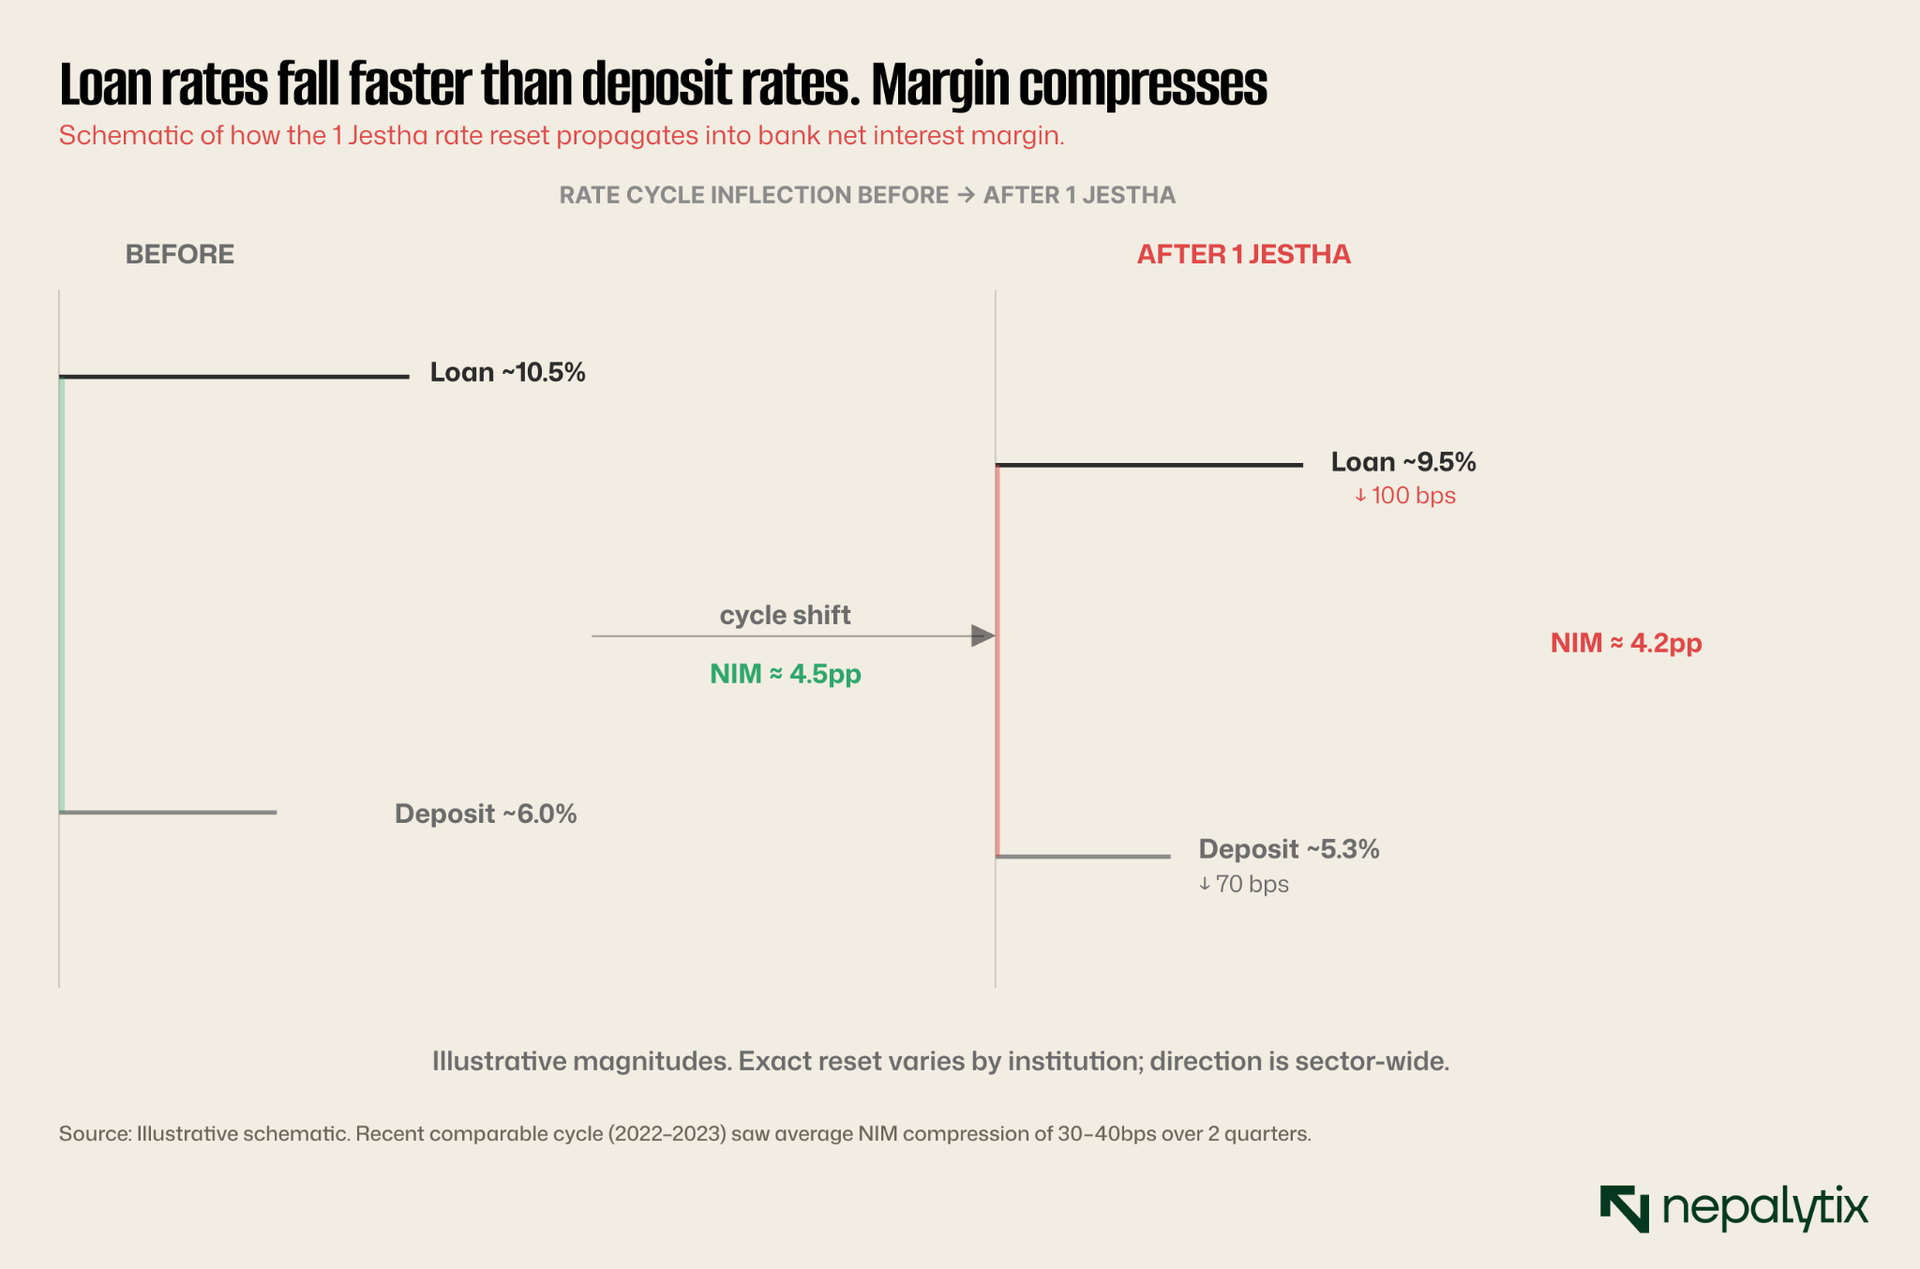
A 30bps NIM compression is what the bank sector absorbs. The household side absorbs something different and that is the connection that closes the loop back to microfinance. Lower deposit yields mean savers earn less for parking money in a fixed deposit, which is the single largest competing asset for retail equity flow in Nepal. When the deposit rate falls by 70bps, the relative attractiveness of NEPSE small caps rises automatically even before anyone makes an active decision. The transmission diagram below traces this in three steps, ending where Section III started: a microfinance name on a +15% upper circuit.
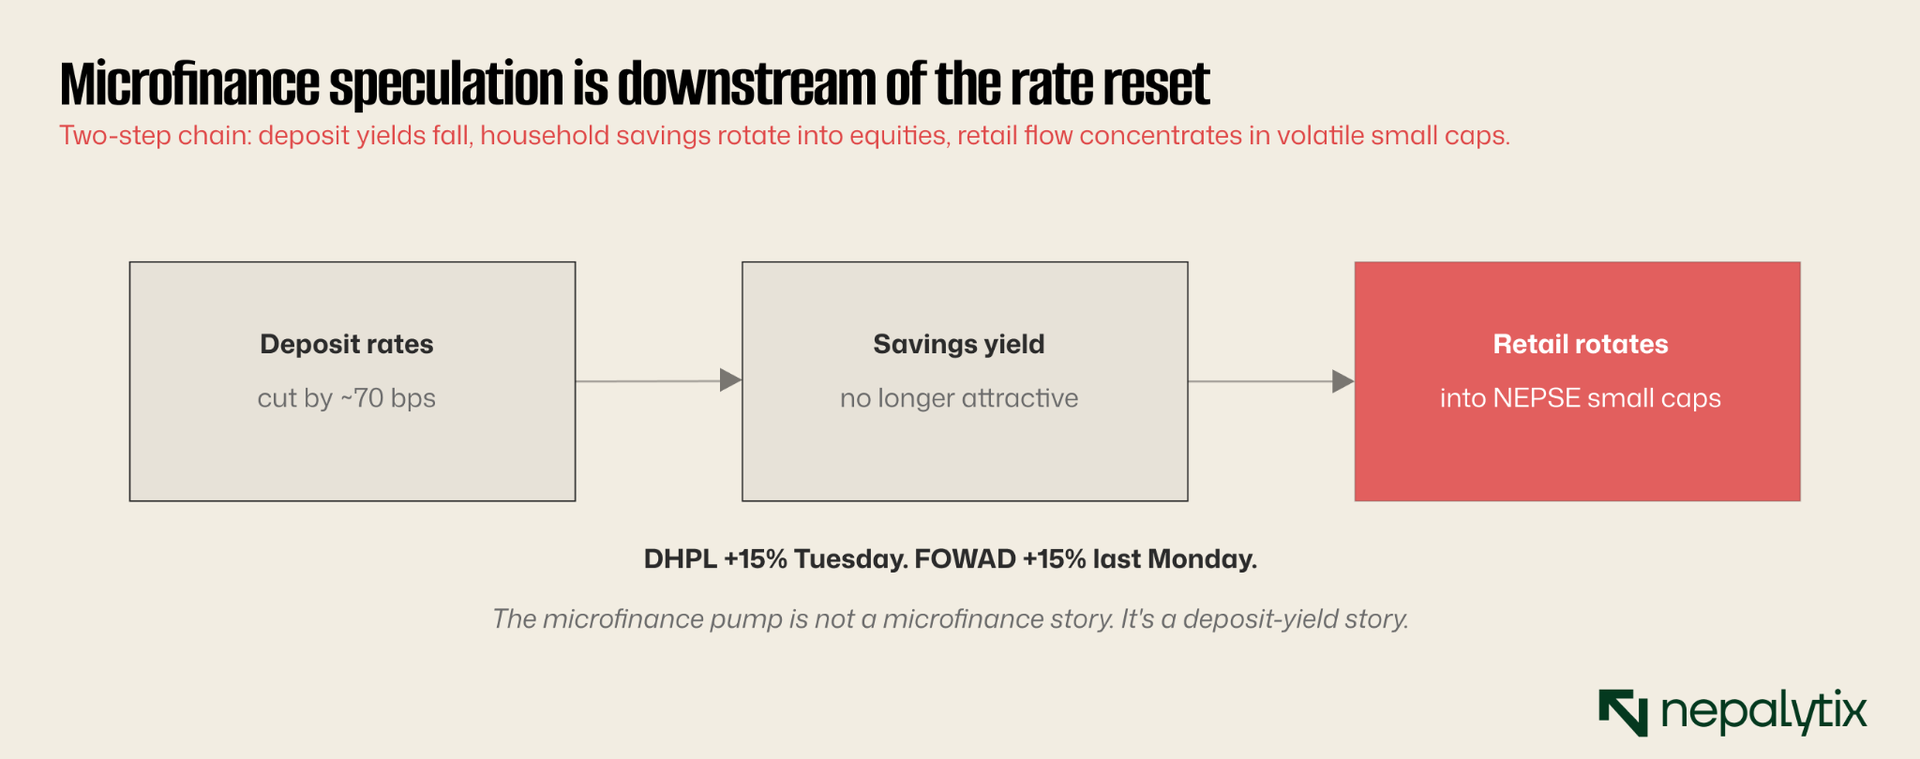
If the diagnosis in the transmission diagram is right, then microfinance speculation is not really about microfinance. It is about deposit yields no longer paying enough to keep household savings in the bank, retail flow looking for the smallest, most-volatile names it can find on the exchange, and an information vacuum in those names that prevents the speculation from being immediately repriced by a fundamental anchor. That last point: the information vacuum is the thread that runs straight into the next section. Speculative names are speculative partly because no one has just published a Q3 number for them. As the Q3 calendar fills in, that asymmetry closes.
VI. Q3 earnings pipeline: SPeculation is concentrated in the unreported sectors
Banks finished reporting April 29. Manufacturing is roughly three quarters done. Insurance is about a third. Hydropower printed Thursday and is essentially the first major hydropower print of the cycle. The pattern is hard to miss: the sectors where Q3 disclosure is most complete are the sectors where speculative pressure is lowest.
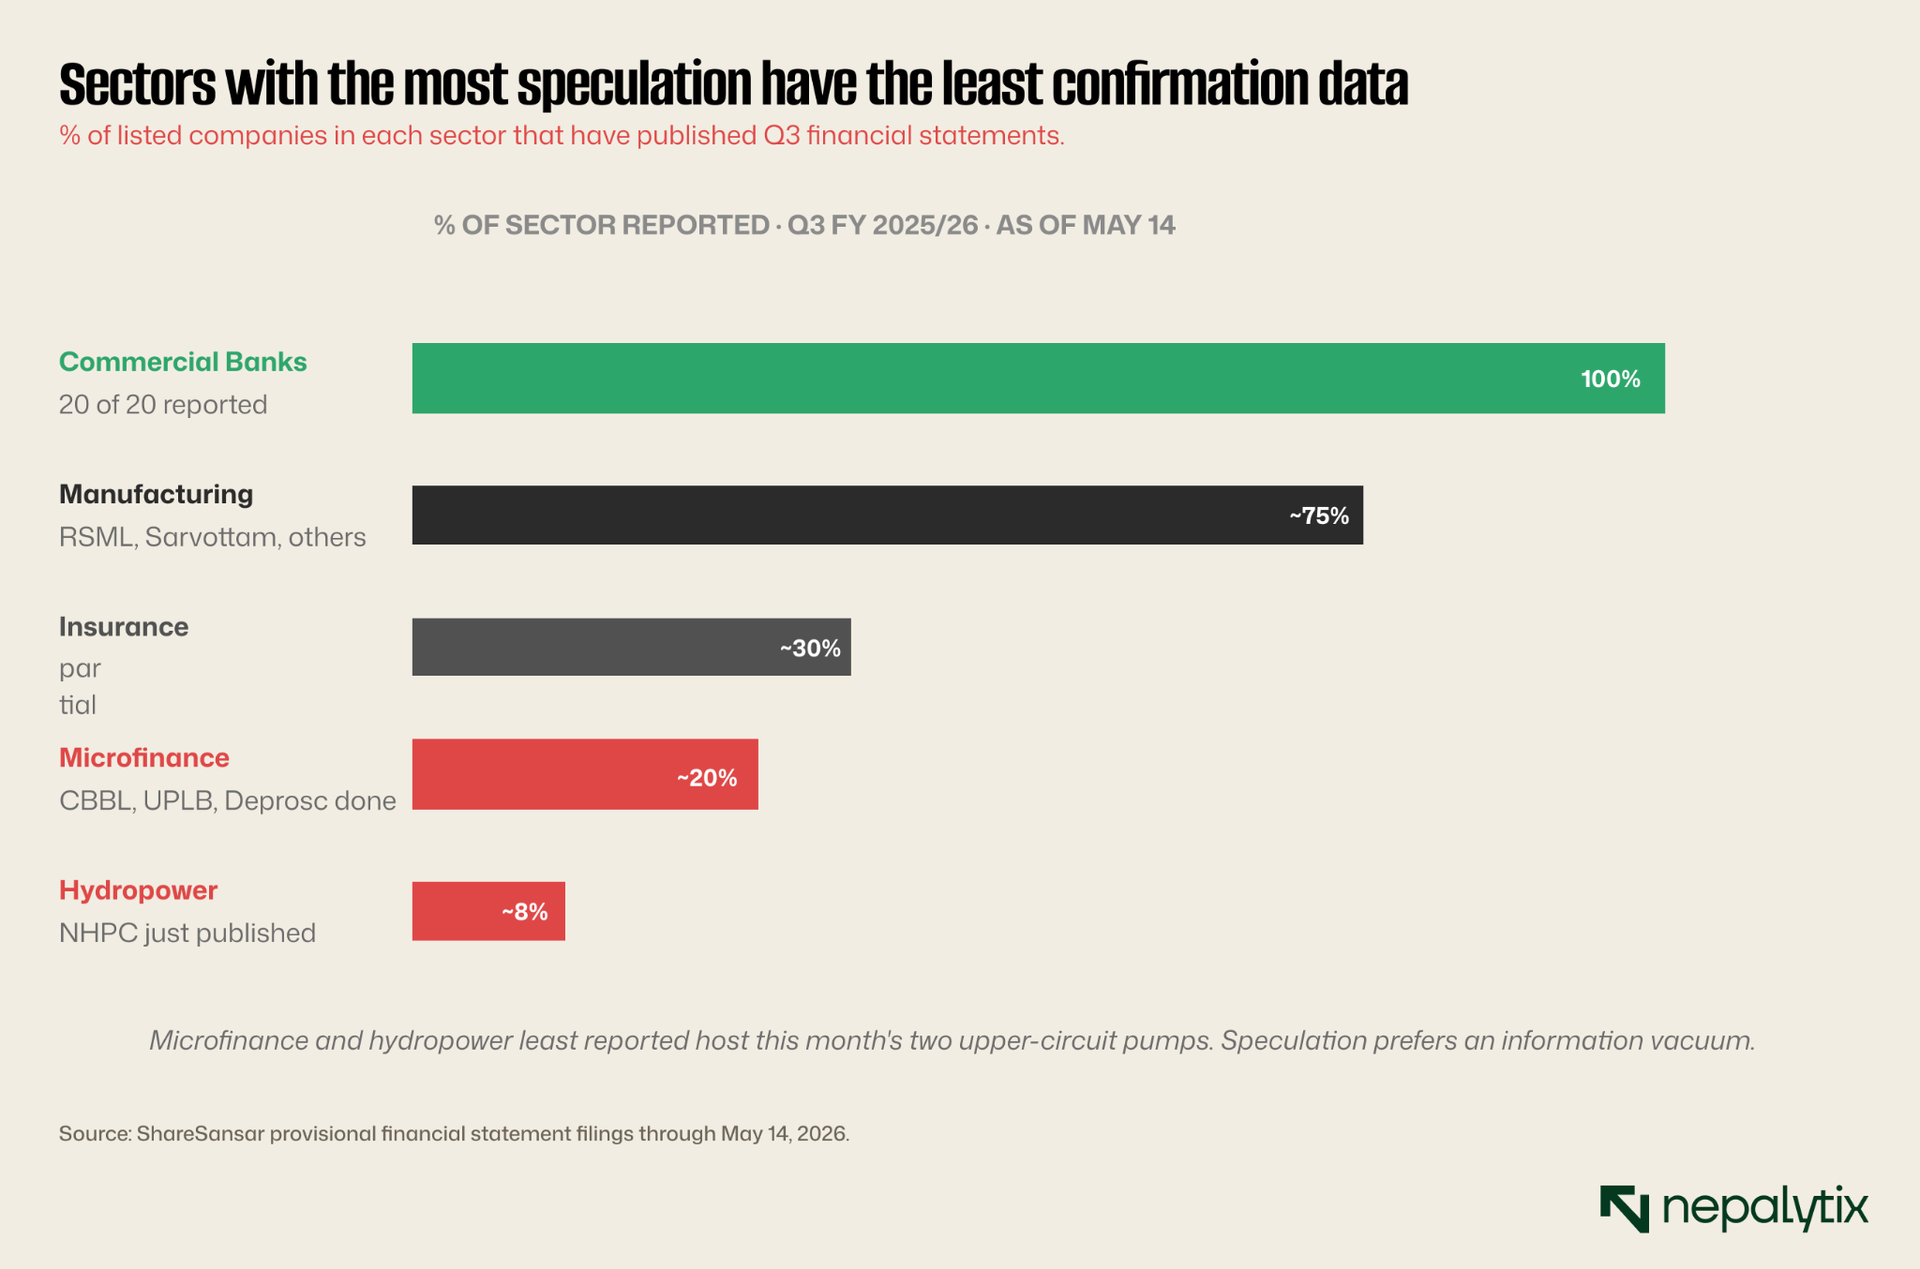
The 100% bar for commercial banks and the 8% bar for hydropower describe more than reporting velocity, they describe the asymmetry of available information. An investor holding a commercial bank knows exactly where their bank sits on the Q3 cluster map from Section IV. An investor holding a hydropower name in mid-May 2026 knows almost nothing about how the company's third quarter actually went because most hydropower companies have not yet filed. Speculation in that vacuum has very little resistance from fundamentals. The names that have printed so far across all sectors paint a useful baseline for what tends to land well and what tends to land badly.
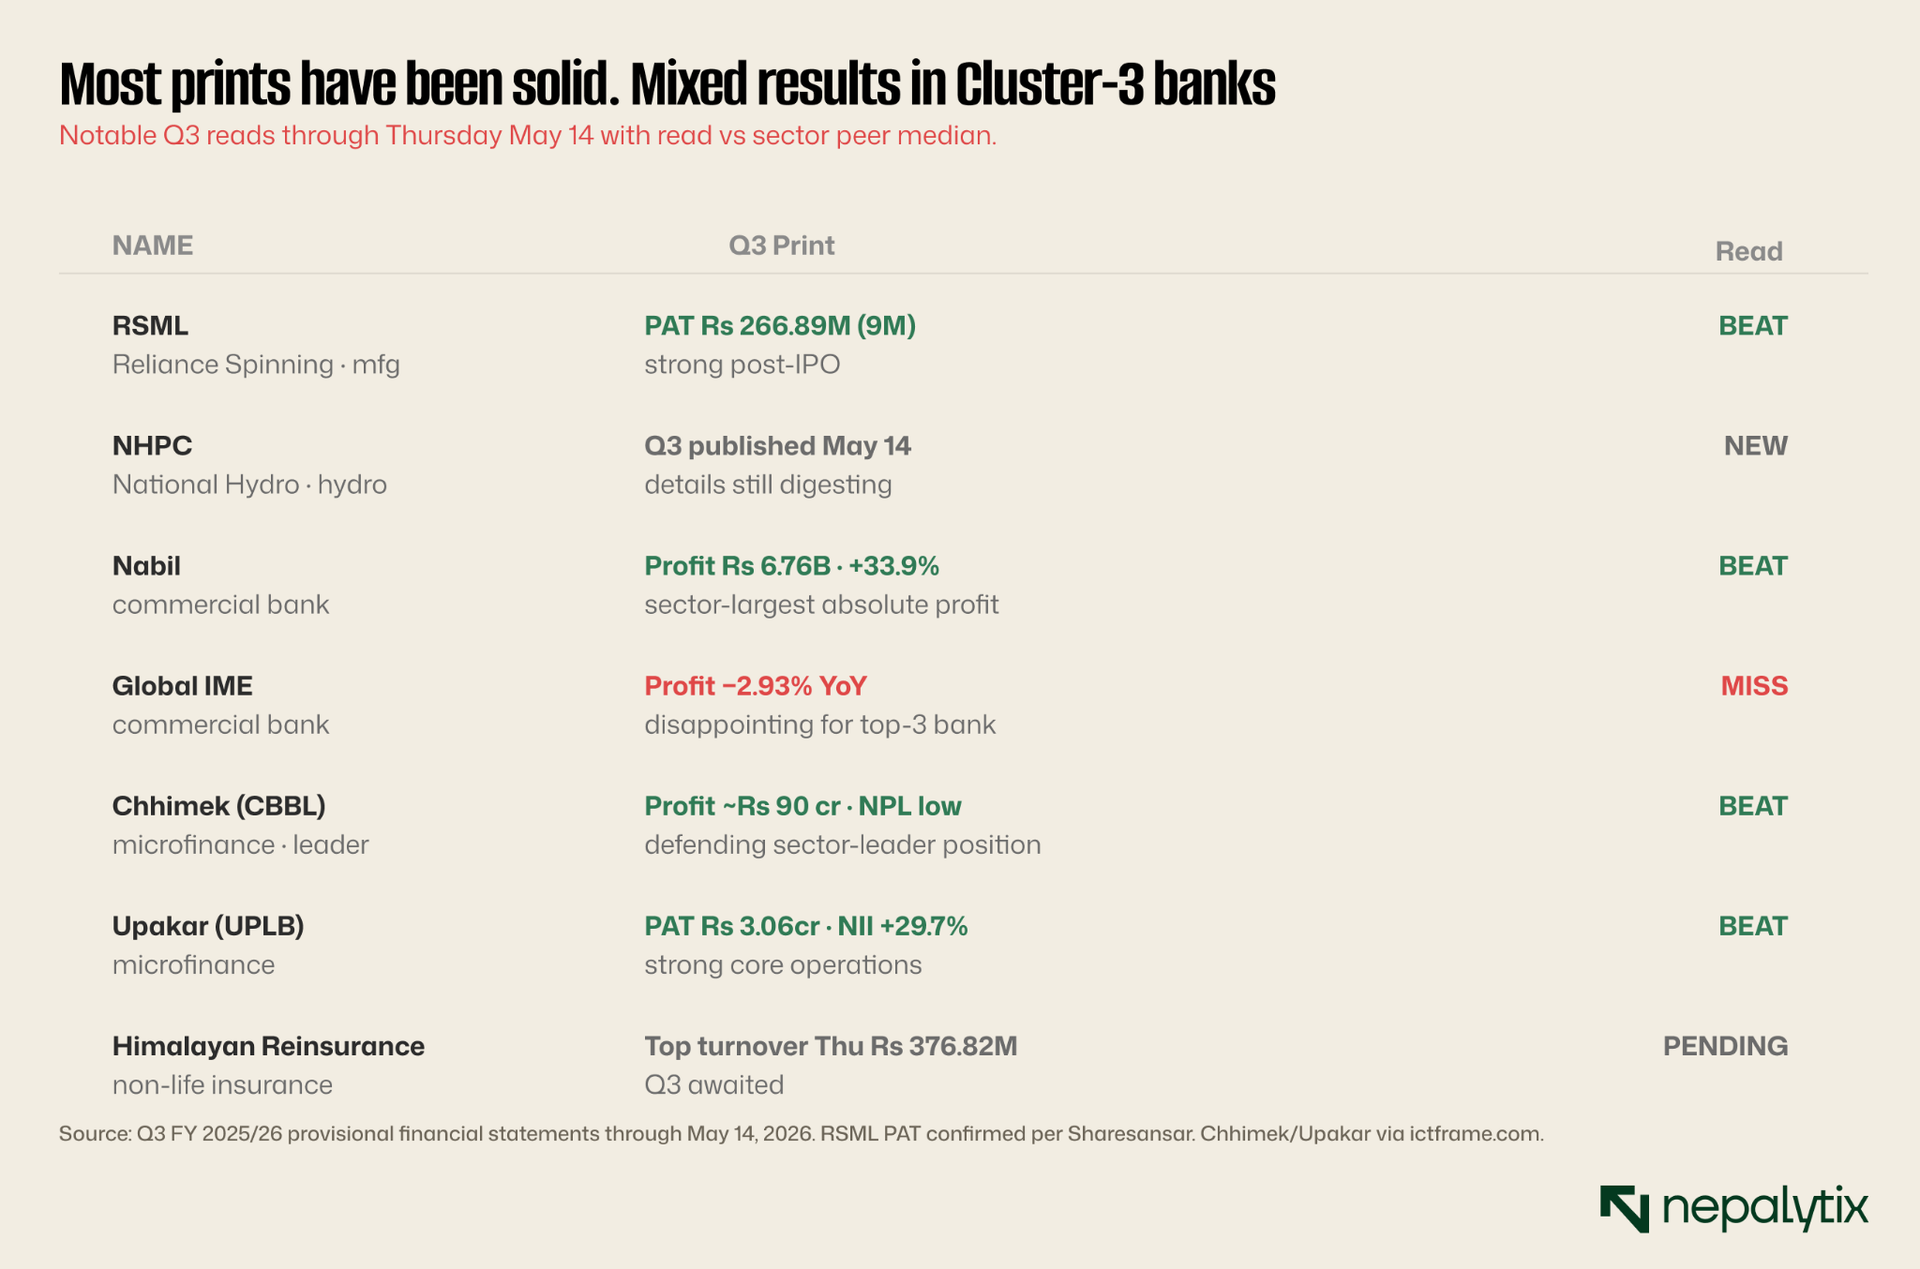
The pattern across the disclosed names is fairly clean. Q3 prints are landing roughly in line with sector expectation, with the dispersion concentrated within sectors rather than between them. Commercial banks split into the Cluster 1 / Cluster 3 buckets Section IV mapped. Microfinance leaders like Chhimek and Upakar print solid numbers while the upper-circuit names trade on flow. Manufacturing's first major print (RSML at Rs 266.89M) confirms the post-listing story without surprises. What the scorecard doesn't yet show is the much bigger wave of prints still to come and the calendar for those, plus the policy events sitting alongside them, is the last chart in this edition
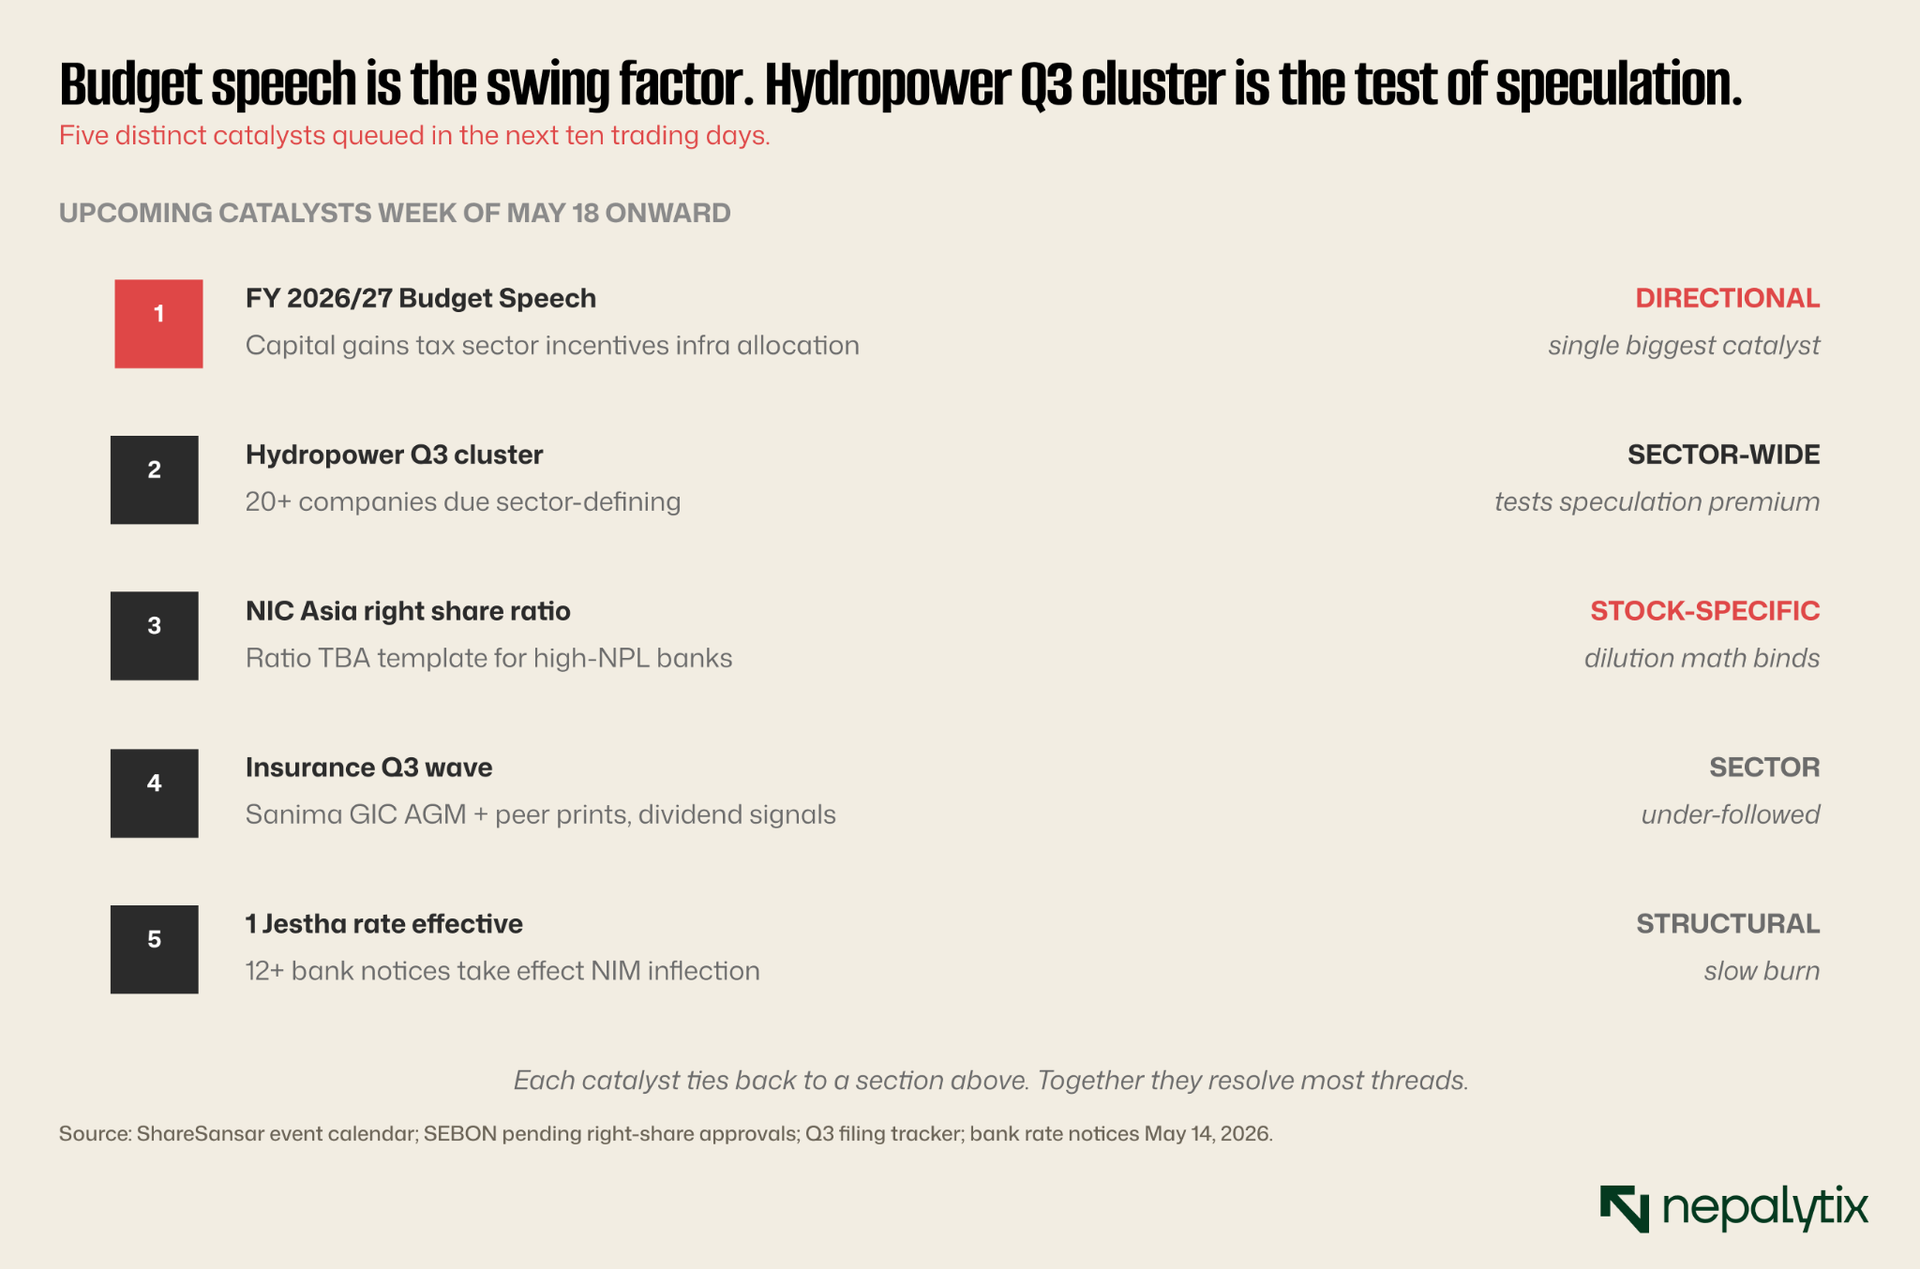
Reading those five catalysts in sequence makes the next two weeks easier to think about than the past one. The budget speech is the single largest swing factor: capital gains tax treatment, sector incentives and infrastructure allocation each touch a different part of the listed universe. The hydropower Q3 cluster is the cleanest test of whether the sector's speculative premium survives an actual fundamental anchor. The NIC Asia ratio resolves Section IV's open question about how much dilution Cluster 3 banks have to absorb. The insurance prints will fill in the most under-followed corner of the market. And the 1 Jestha rate change quietly resets every margin assumption in the banking sector. Most of these arrive in a tight window. If even three of the five land as expected, the picture coming out of next week will be materially clearer than the picture going in.