NEPSE SIP Returns: Why Your Exit Date Matters More Than Your Start Date
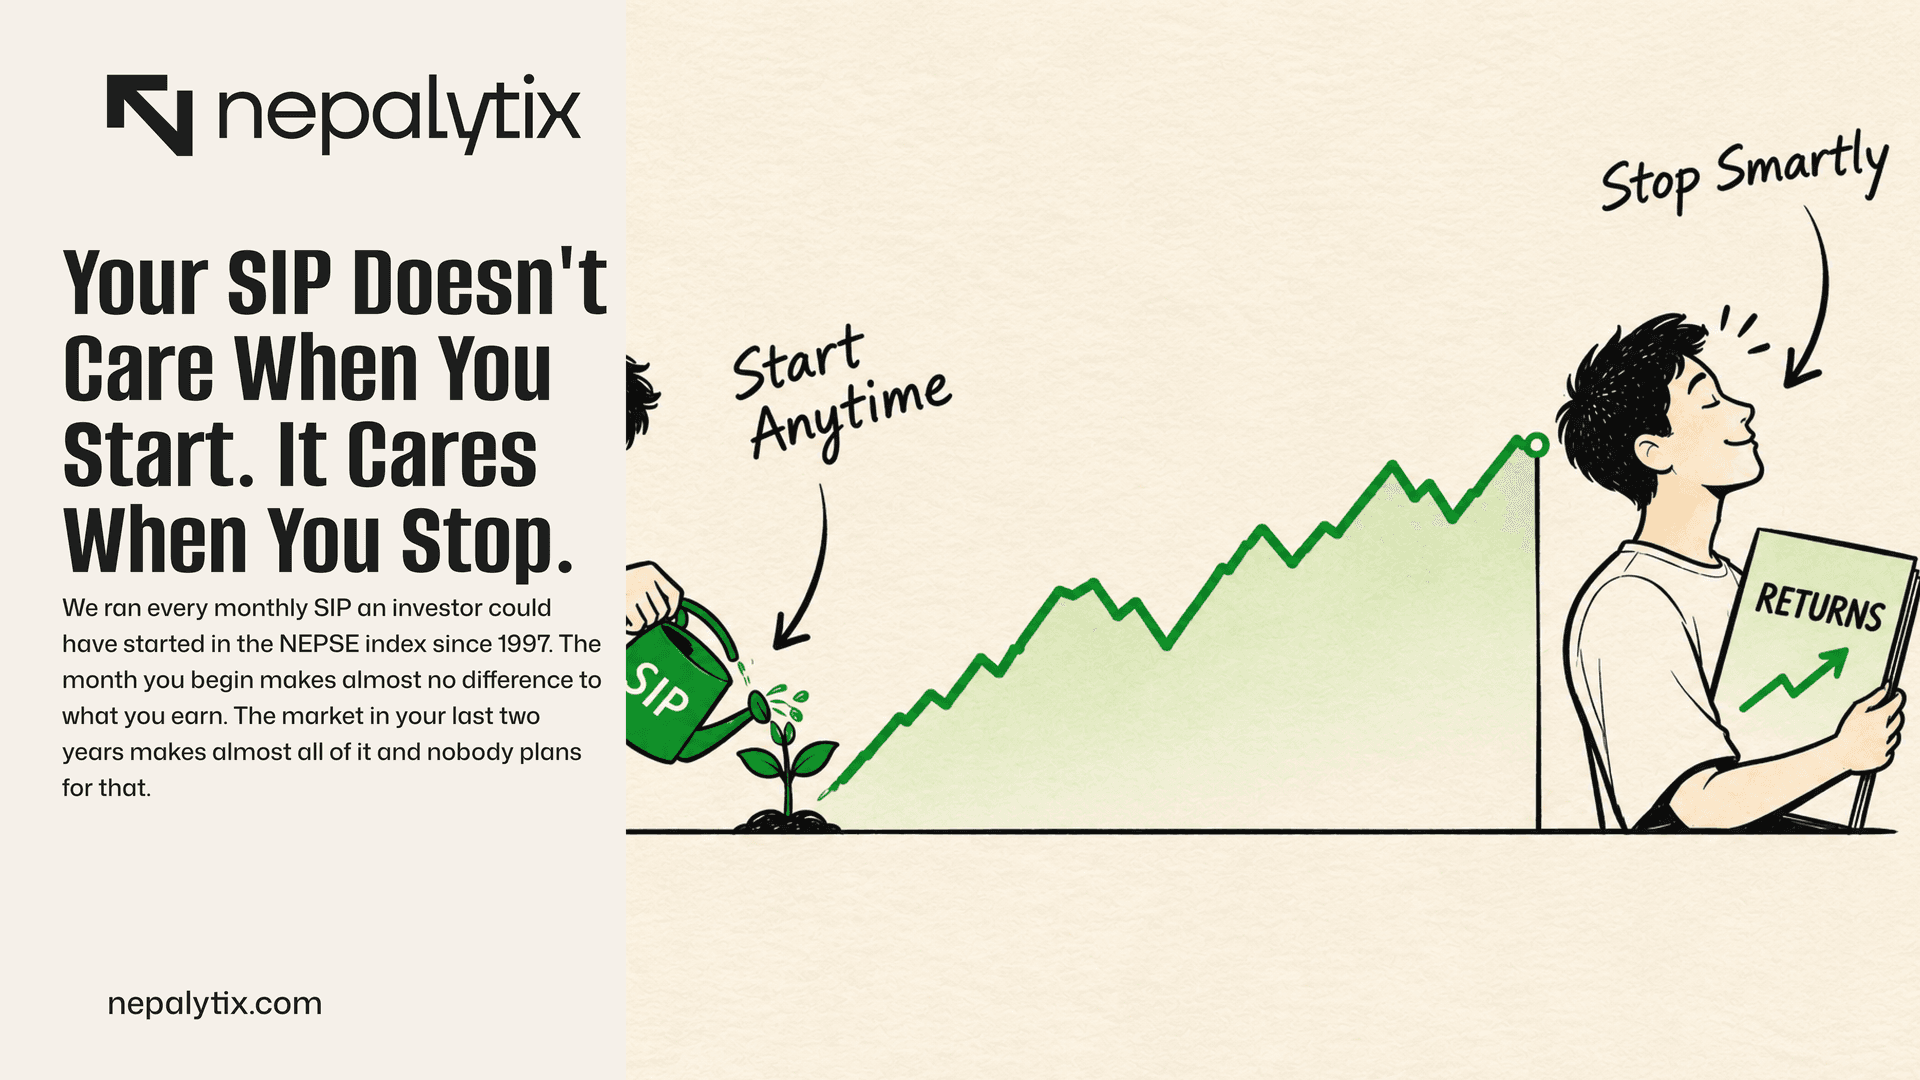
We ran every monthly SIP an investor could have started in the NEPSE index since 1997. The month you begin makes almost no difference to what you earn. The market in your last two years makes almost all of it and nobody plans for that.
Let's start with a number your SIP app would rather you didn't calculate. Say you've been putting Rs 5,000 a month into the market since December 2021. That's sixty instalments and Rs 300,000 out of your salary. An index-tracking SIP would be showing you roughly Rs 338,300 today. Up 12.8%. Not bad?
Well. Your money didn't go in on day one. It trickled in so the average rupee has been invested for about two and a half years, not five. Do the maths properly and you're earning 4.7% a year. Your bank will pay you close to that for doing nothing at all.
We wanted to know whether that's bad luck or just what SIPs do. So we ran all of them. Every monthly SIP into the NEPSE index that anyone could have started since July 1997, 341 start months, each one followed for up to ten years. The pitch you were sold has three parts: you don't need to time the market, averaging smooths your cost and time takes care of the rest. Parts one and two hold up. Part three needs a very large asterisk and the asterisk is where the money is.
The short version: a SIP really does make your start date irrelevant. Which is exactly why the date you stop ends up deciding nearly everything.
First, The Good News: Time Works (Eventually)
Here's the whole 29-year record in one picture. For each length of SIP, we've drawn the spread of what investors actually earned per year on the money they paid in. Red means they finished with less than they put in.
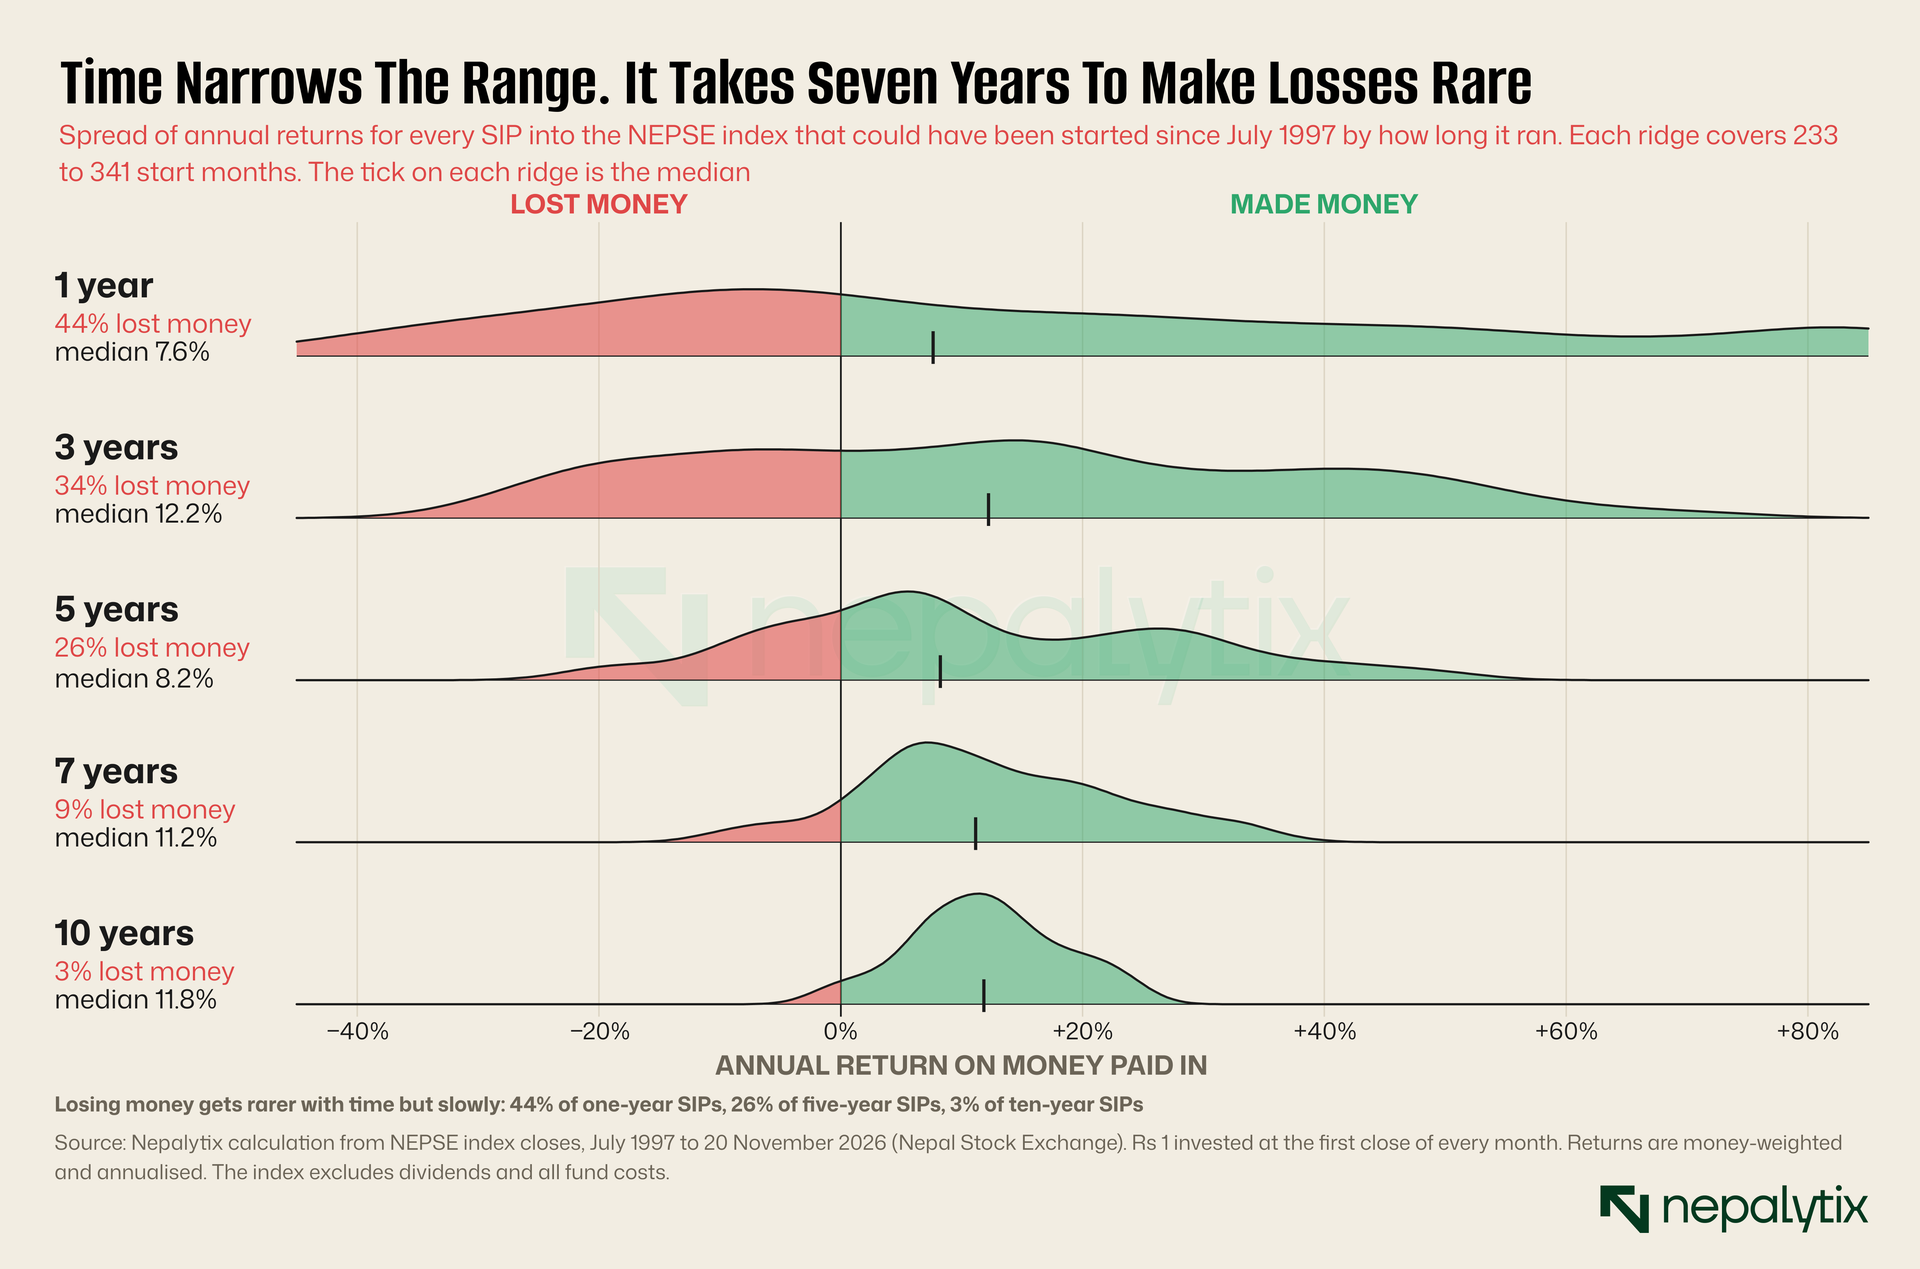
The ridges tighten and slide right as you go down which is the brochure's promise doing what it says. One-year SIPs lost money 44% of the time (so, a coin flip with paperwork). Three years: 34%. Five years: 26%. You have to get to seven years before losing becomes unusual at 9% and to ten before it's rare at 3%.
Hold that five-year number in your head. We'll come back to it because five years is what most people mean when they say they're in it for the long term.
Your Statement Is Flattering You
Quick detour into how the scoreboard works, because the app's version is misleading in a way that matters.
A SIP statement gives you two numbers: what you paid and what it's worth. The gap between them is a gain on money paid. It is not an annual return and you can't compare it with a deposit rate. Your first instalment has been working for years, your latest one for a few days. The honest figure is the money-weighted return, the single yearly rate that turns your actual payments into your actual balance. Excel calls it XIRR. It takes about four minutes with a statement and a spreadsheet, and it's the only number worth arguing about.
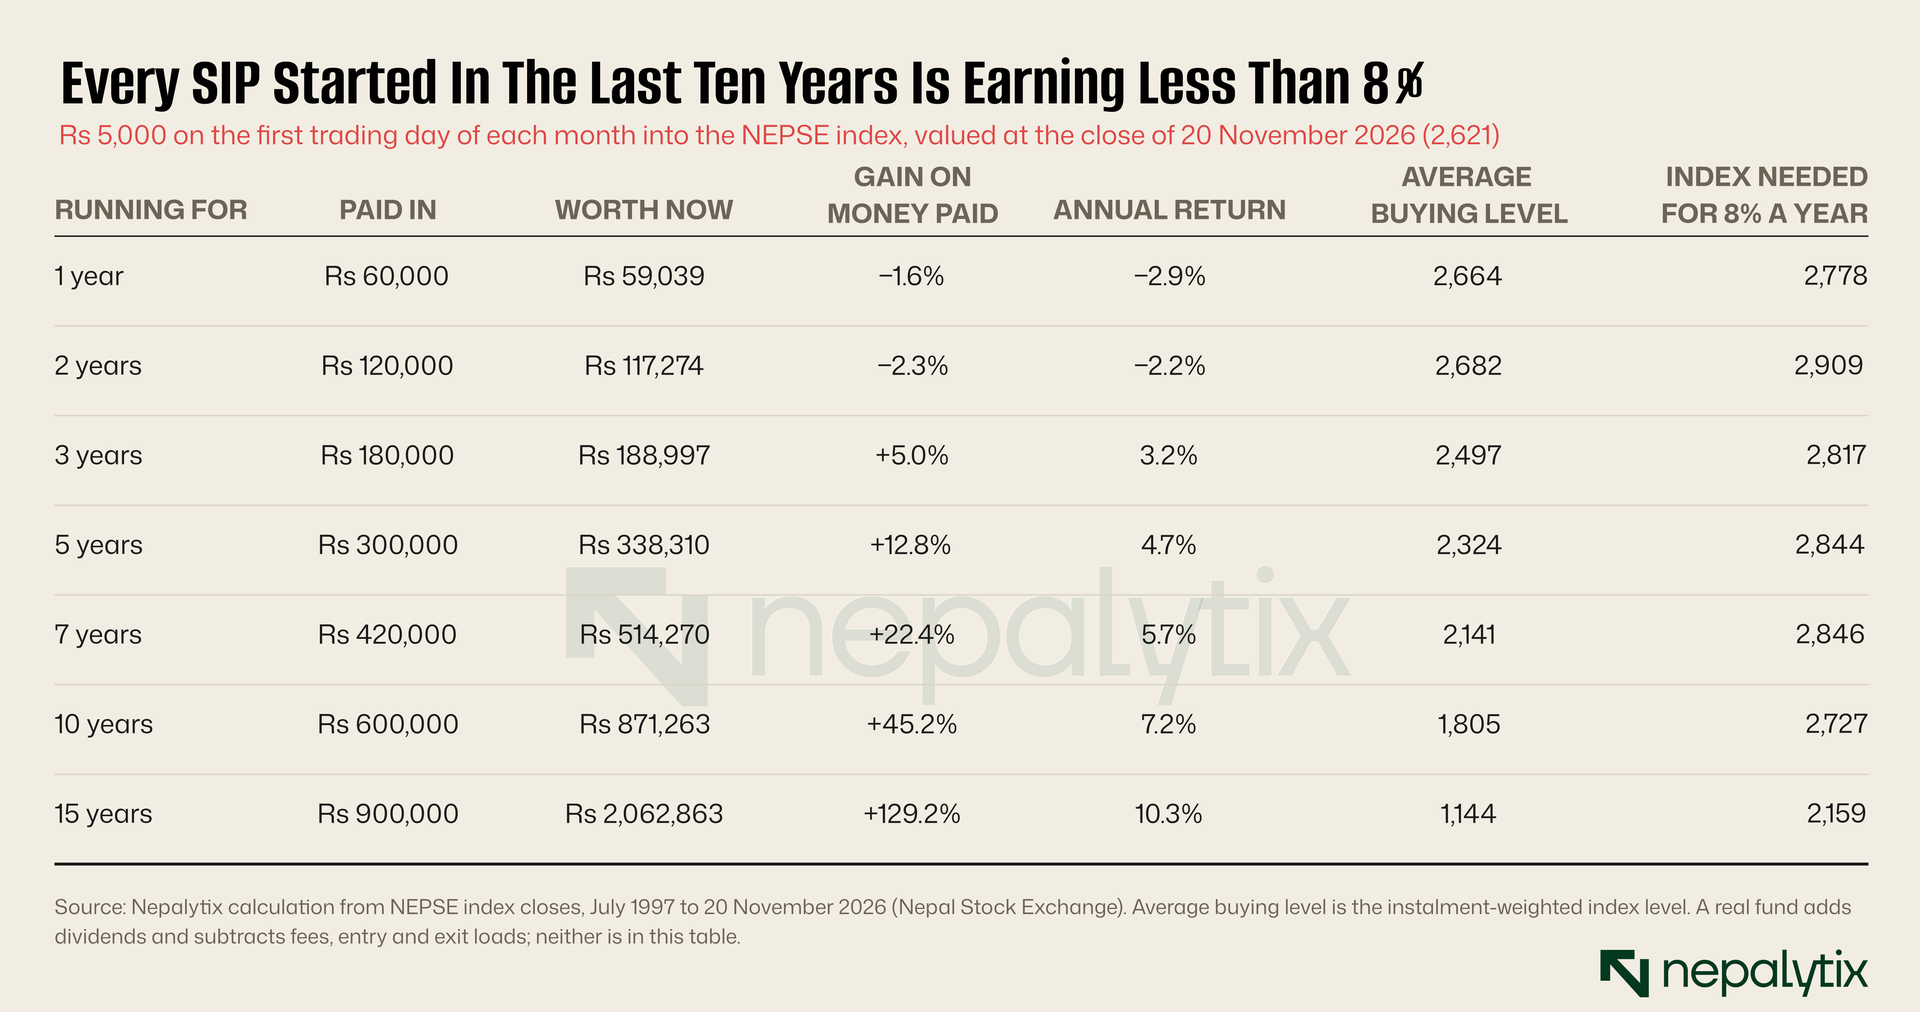
We did it for a Rs 5,000 SIP into the index, started at various points and valued at Friday's close of 2,621.
A few things jump out.
Every row from one year to ten is under 8%. We didn't cherry-pick the rows, either. We checked every start month in the last decade and the best of the lot, a SIP that's been running just under nine years is earning 7.7%. Anyone who started in the last two and a half years is below zero. About a third are earning less than 3.9% which is what the twenty commercial banks best fixed-deposit rates average out to this month.
Now look at the average buying level. This is the part of the SIP pitch that's completely true. You spend the same rupees every month so you automatically pick up more units when prices are low and fewer when they're high. Our five-year saver bought in at an average index level of 2,324. The index five years ago was 2,765 which is higher than it is today. Somebody who put the full Rs 300,000 in on that day is losing money. The SIP saver is up 12.8%. Averaging worked exactly as advertised.
And then there's the last column which is the one that should bother you. For that five-year SIP to be earning 8% a year, the index needs to be at 2,844. That's 8.5% above Friday's close. NEPSE has moved that much inside a single calendar month 43 times since 1997. So: five years of never missing an instalment and whether the result is "meh" or "pretty good" comes down to a few weeks of market mood at the end.
Your SIP is worth the units you've collected times one price. Five years of discipline decides the units. One day decides the price.
Five Years Is Not "Long Term"
Back to that five-year number. Here's the full scorecard.
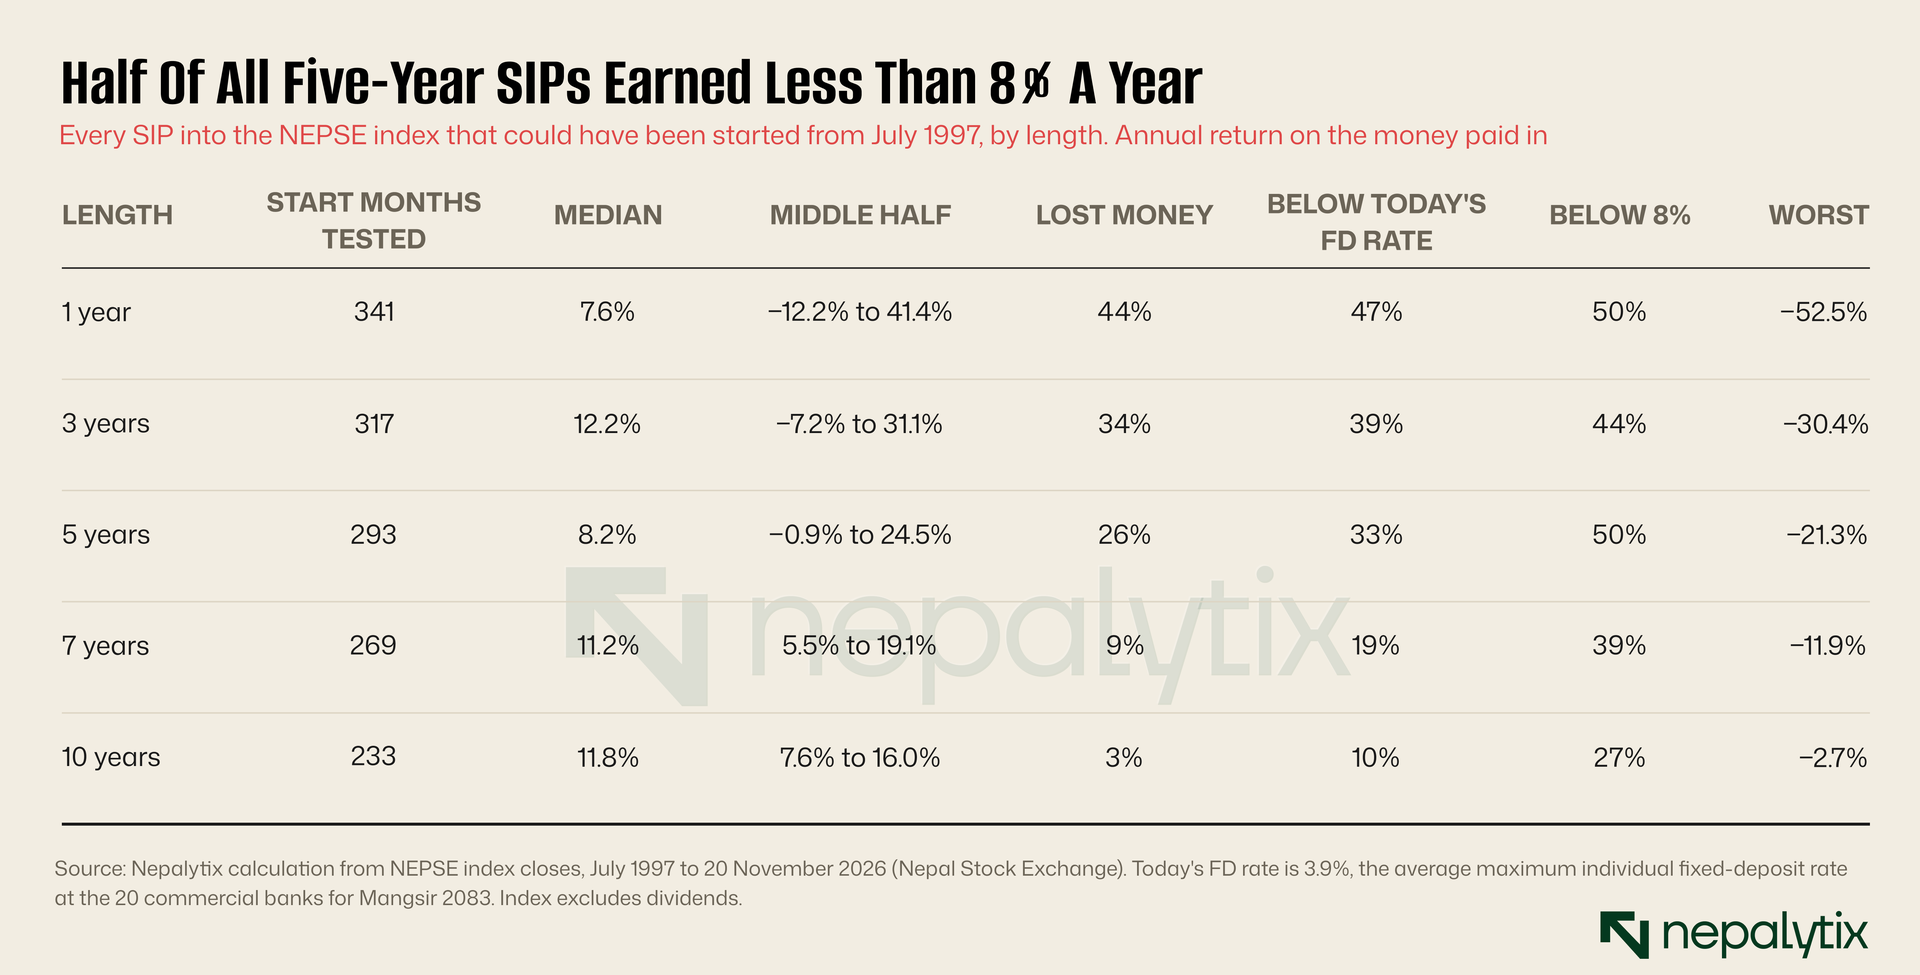
The median five-year SIP earned 8.2% a year, which sounds fine until you read the columns either side of it. Half of them earned less than 8%. A third earned less than today's deposit rate. The middle half landed somewhere between minus 0.9% and plus 24.5% a year. As forecasts go, that one's a shrug.
The extremes are worth a look too. The worst five-year SIP on record started in April 2007 and lost 21.3% a year. The best started in January 2003 and made 51.6% a year. Same product. Same habit. Same stock exchange.
Here's one we didn't expect. Take each of those start dates and instead of a SIP, drop a single lump sum in and leave it for five years. The lump sum lost money 19% of the time. The SIP lost money 26% of the time. Spreading the purchases out didn't make losing less likely in NEPSE's history. It made it a bit more likely.
The reason isn't mysterious. Markets drift up over long stretches which rewards money that got in early and a SIP gets most of its money in late. That's not a knock on SIPs. Most of us don't have a lump sum lying around and salary is how real savings get built. It's a knock on one idea: that averaging is protection. It protects you from a bad starting price. It does nothing at all about a bad finishing price. Guess which one shows up in the data.
Nobody Cares When You Started . . .
This next chart is the busiest one in the piece and it's worth a slow read. Each little square is one SIP. The row is the January it started. The column is the January somebody opened the app and counted the money. Green is a gain, red is a loss.
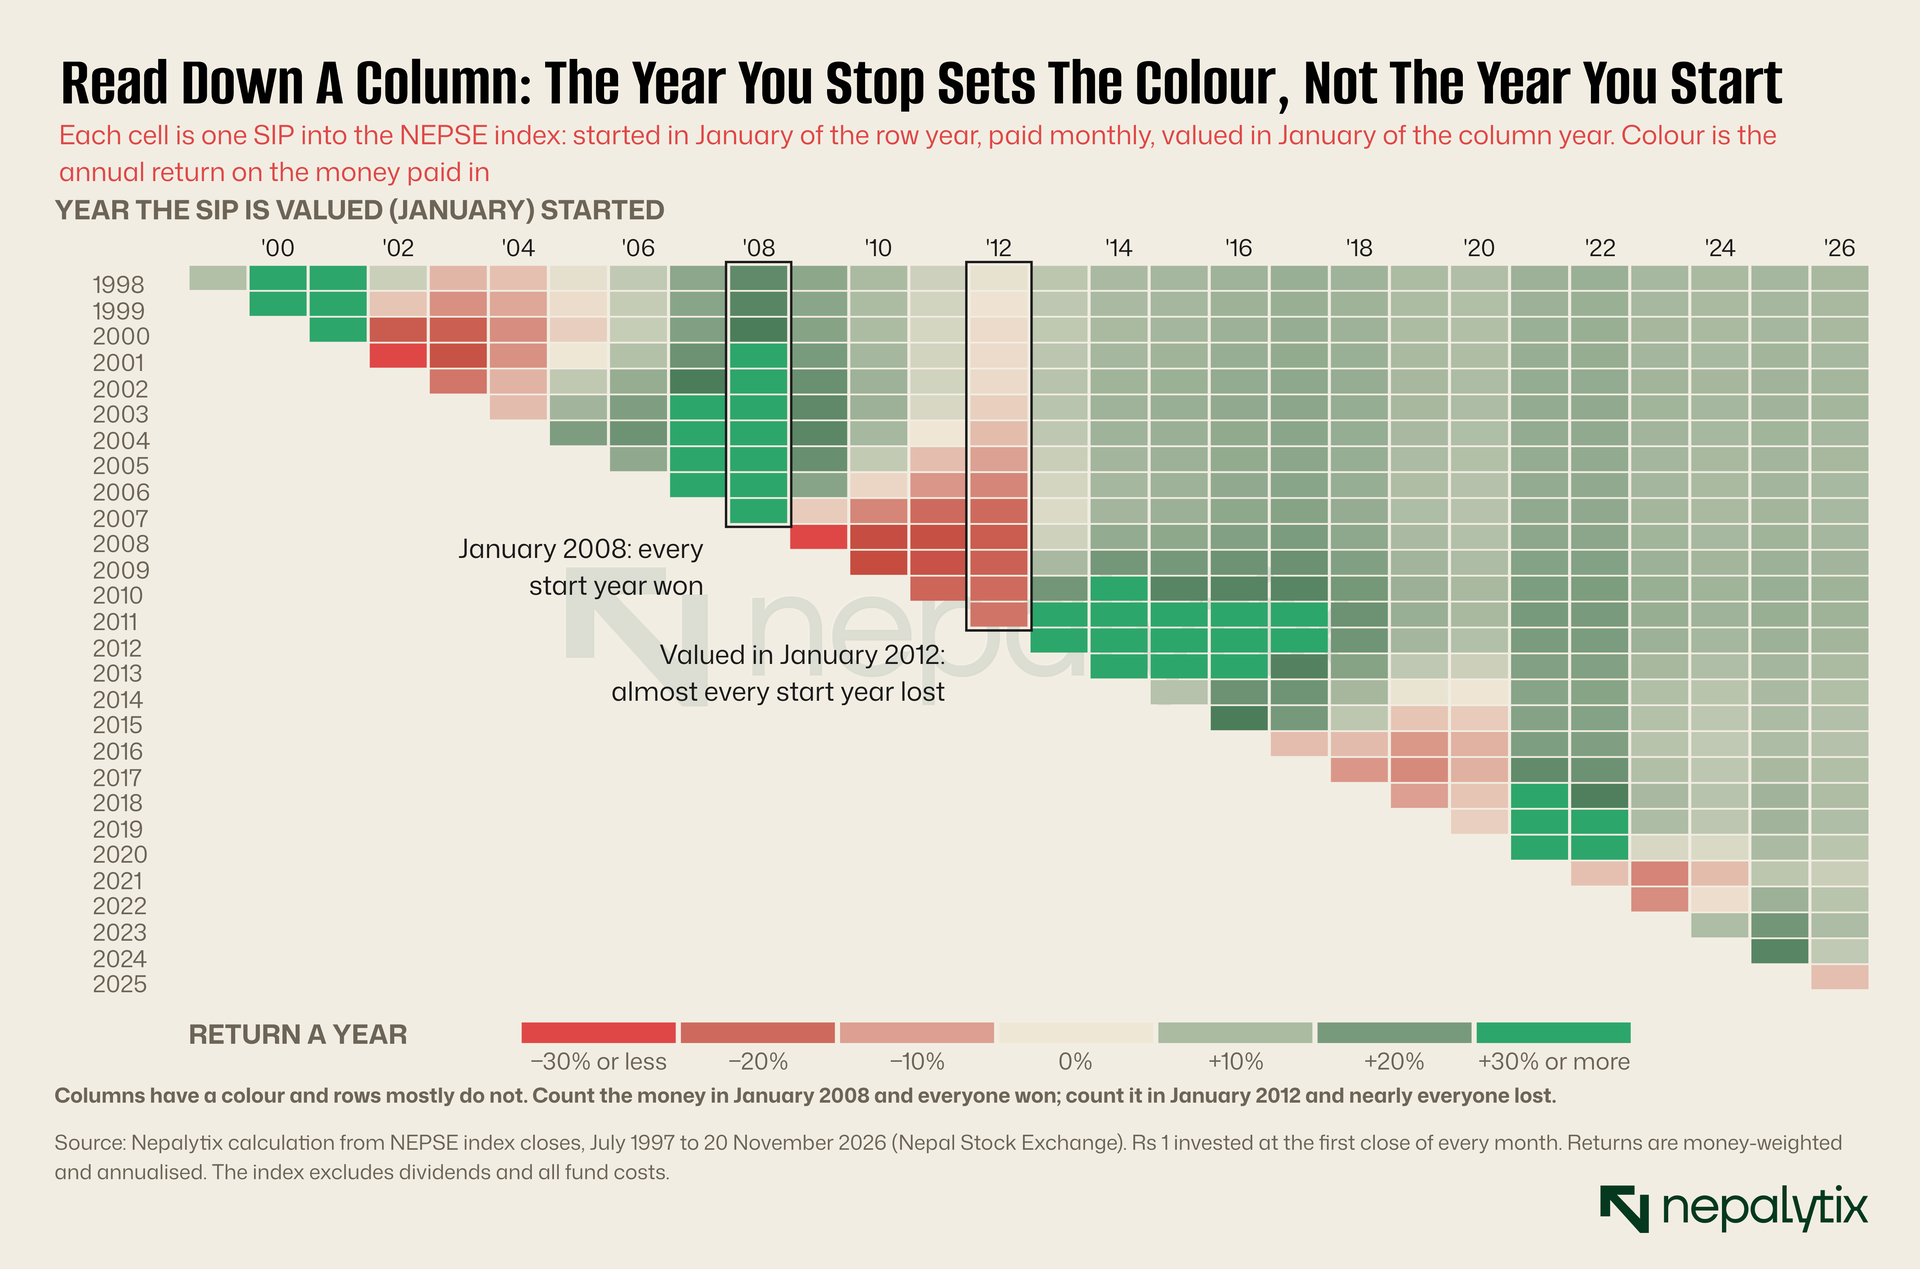
Run your eye down the 2008 column. Green, top to bottom. It didn't matter if you'd started in 1998 or 2005 or the year before. If you counted in January 2008, you'd won. Now try 2012. Pale or red, top to bottom. Ten years of instalments or two, you were looking at a loss or something that rounds to one.
Columns have a colour. Rows mostly don't. And a row is a person. Follow the saver who started in January 2007: deep red if they looked any time from 2009 to 2012, comfortably green from 2014 on. They didn't get smarter. The calendar moved.
We put numbers on it. Take all the SIPs that finish in the same month and slide the start date across a full year so they run anywhere from four and a half to five and a half years. The annual return typically moves by 3.9 percentage points. Now hold the start fixed and slide the finish across a year instead. It typically moves by 12.5 points and one time in ten by more than 22. Moving the exit by a year matters about three times as much as moving the entry by a year.
. . . But The Exit Is Everything
OK, so maybe you can tell how it's going from the halfway mark? You're three years in, you're up, surely that's a good sign?
We drew all 293 five-year SIPs as paths. Each line is one saver's running score, month by month: what the units were worth against the money paid in so far.
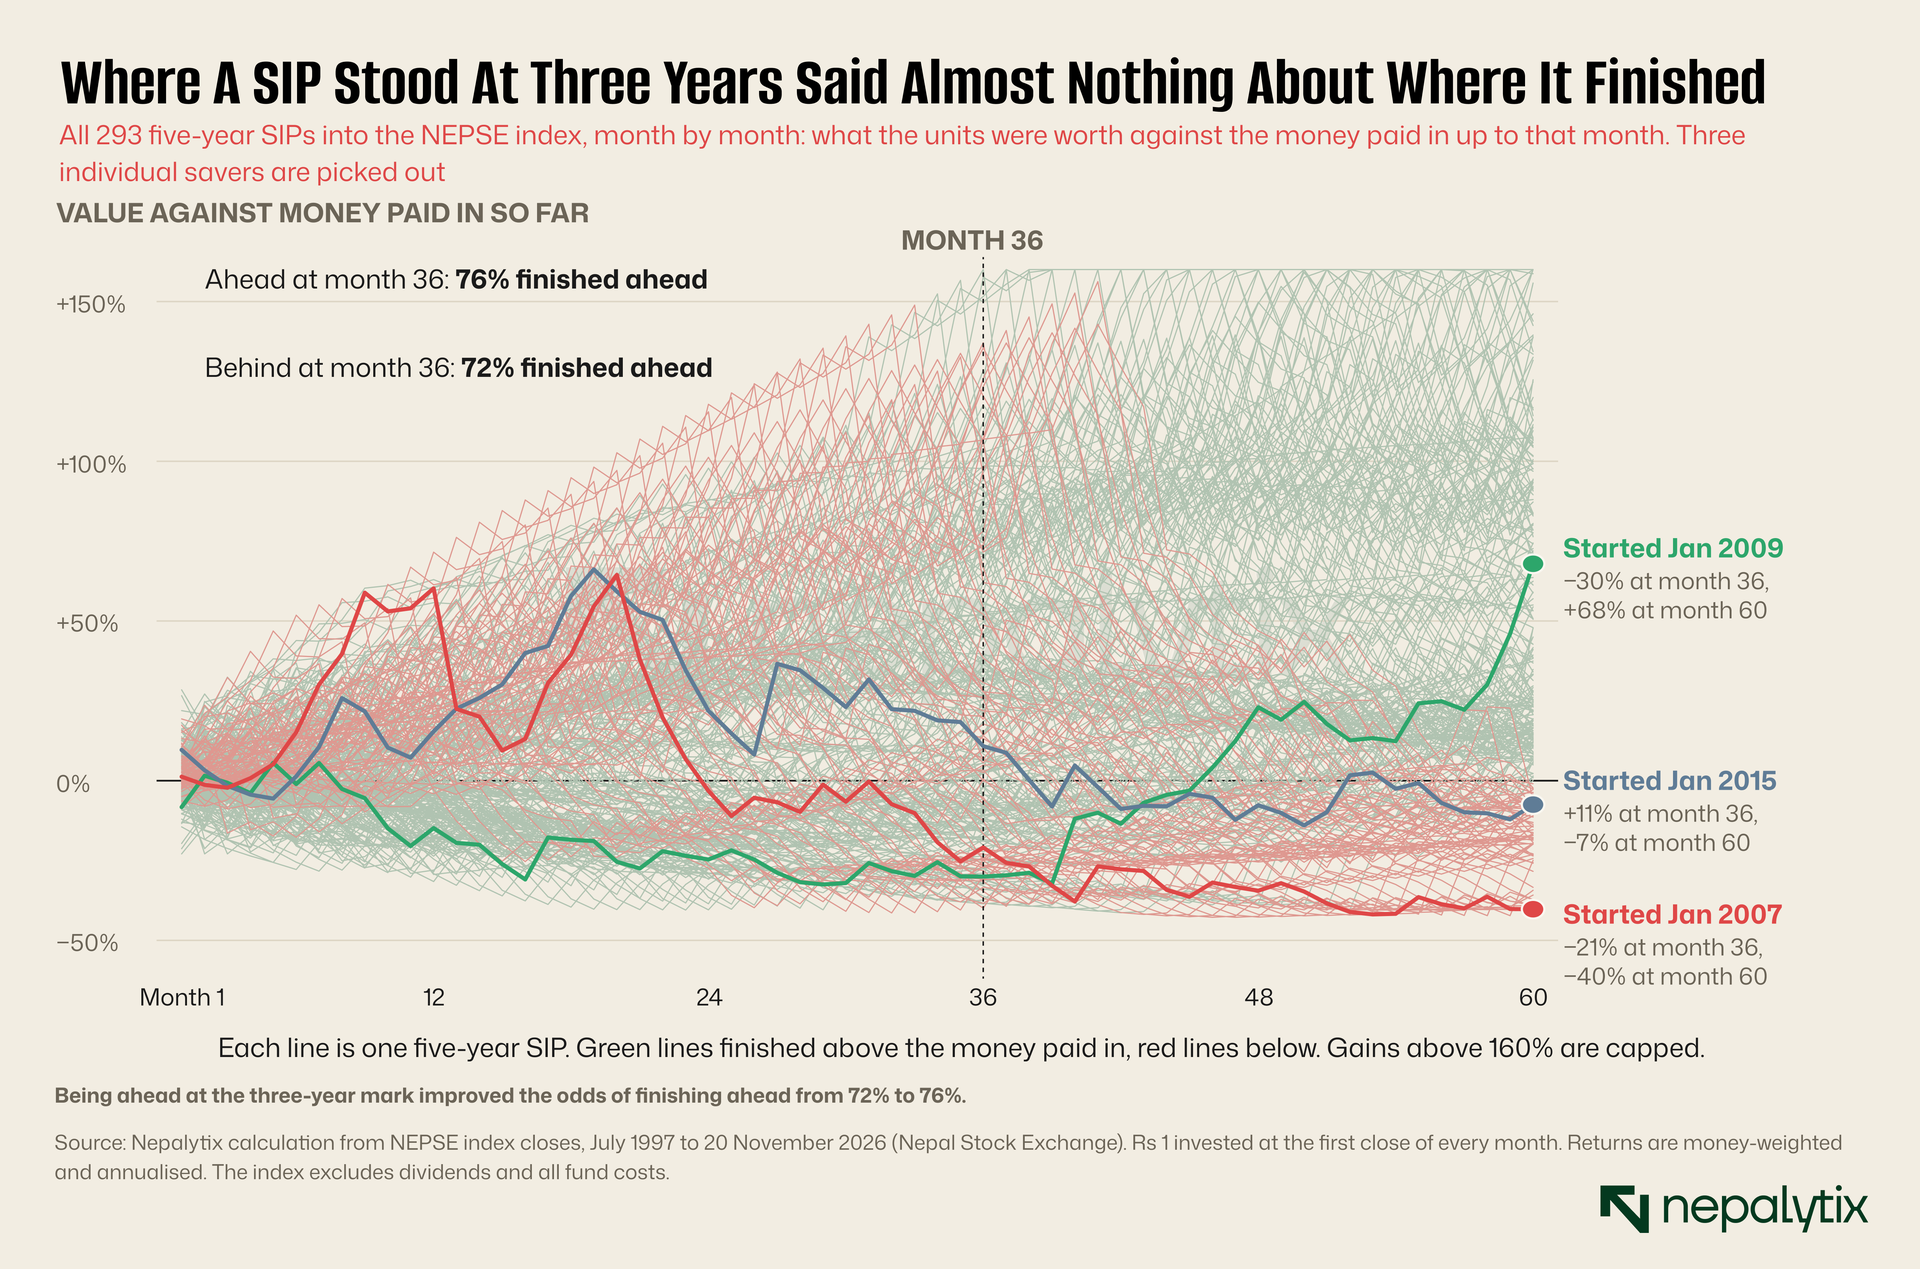
It's a plate of spaghetti and that's the finding. Of the SIPs that were ahead at month 36, 76% finished ahead. Of the ones that were behind at month 36, 72% finished ahead. Four points of difference. Your three-year statement is roughly as informative as your horoscope. In 42% of cases a SIP that was up at three years was down at five, or the other way round.
It gets stranger the earlier you look. How a SIP is doing after its first year is slightly negatively related to how it ends up. A great first year means prices ran up which means you spent the next four years buying expensive units.
The three highlighted savers make the point better than any correlation. Each paid in on the first trading day of every month for exactly five years. Nobody missed a payment.
The red line started in January 2007. A year in, this person was up 60% and presumably insufferable at family gatherings. By month 36 they were down 21%. They finished down 40%, which works out to losing 20% a year. Averaging lowered their cost the whole way through. It didn't help because nearly every unit had been bought above the finishing price.
The green line started in January 2009, into a falling market. Down 15% after a year. Down 30% after three at which point every sensible relative was advising them to stop. Two years later they were up 68%, or 20.8% a year. The index over those five years rose 8%. Total. It fell for three years and came back, so most of their instalments bought near the bottom and the count happened near the top.
The gold line is our favourite, because nothing dramatic happens. Started January 2015. The index went from 904 to 1,170 over the five years, up 29%. Look at a chart of the market and you'd call that a decent stretch. The SIP lost 3% a year. The market peaked in 2016 and spent three years sliding, so the instalments went in high and the count came low. A market can finish well above where it started and still leave a SIP saver with less than they paid in.
Why does it work this way? Arithmetic, mostly. In month one of a five-year SIP you have a single instalment at risk. A 30% crash costs you 30% of one instalment, about half a per cent of everything you'll eventually pay in. In the last month you have sixty instalments at risk and the same crash takes 30% of all of it. A SIP is a small bet that grows into a big one so the market's behaviour counts in proportion to how much you have on the table. We sorted the 293 SIPs by what the market did in their first three years and the correlation with the final return was 0.00. Sorted by the last two years, it was 0.86.
If you want it in one line: your gain is today's price divided by your average buying price, minus one. That ratio explains the result almost perfectly (correlation: 0.98). A SIP takes excellent care of the bottom of that fraction. It has no opinion whatsoever about the top.
What About Picking A Good Month?
People put real effort into this. Wait for a dip. Start after the budget. Begin in Shrawan with the new fiscal year. We checked.
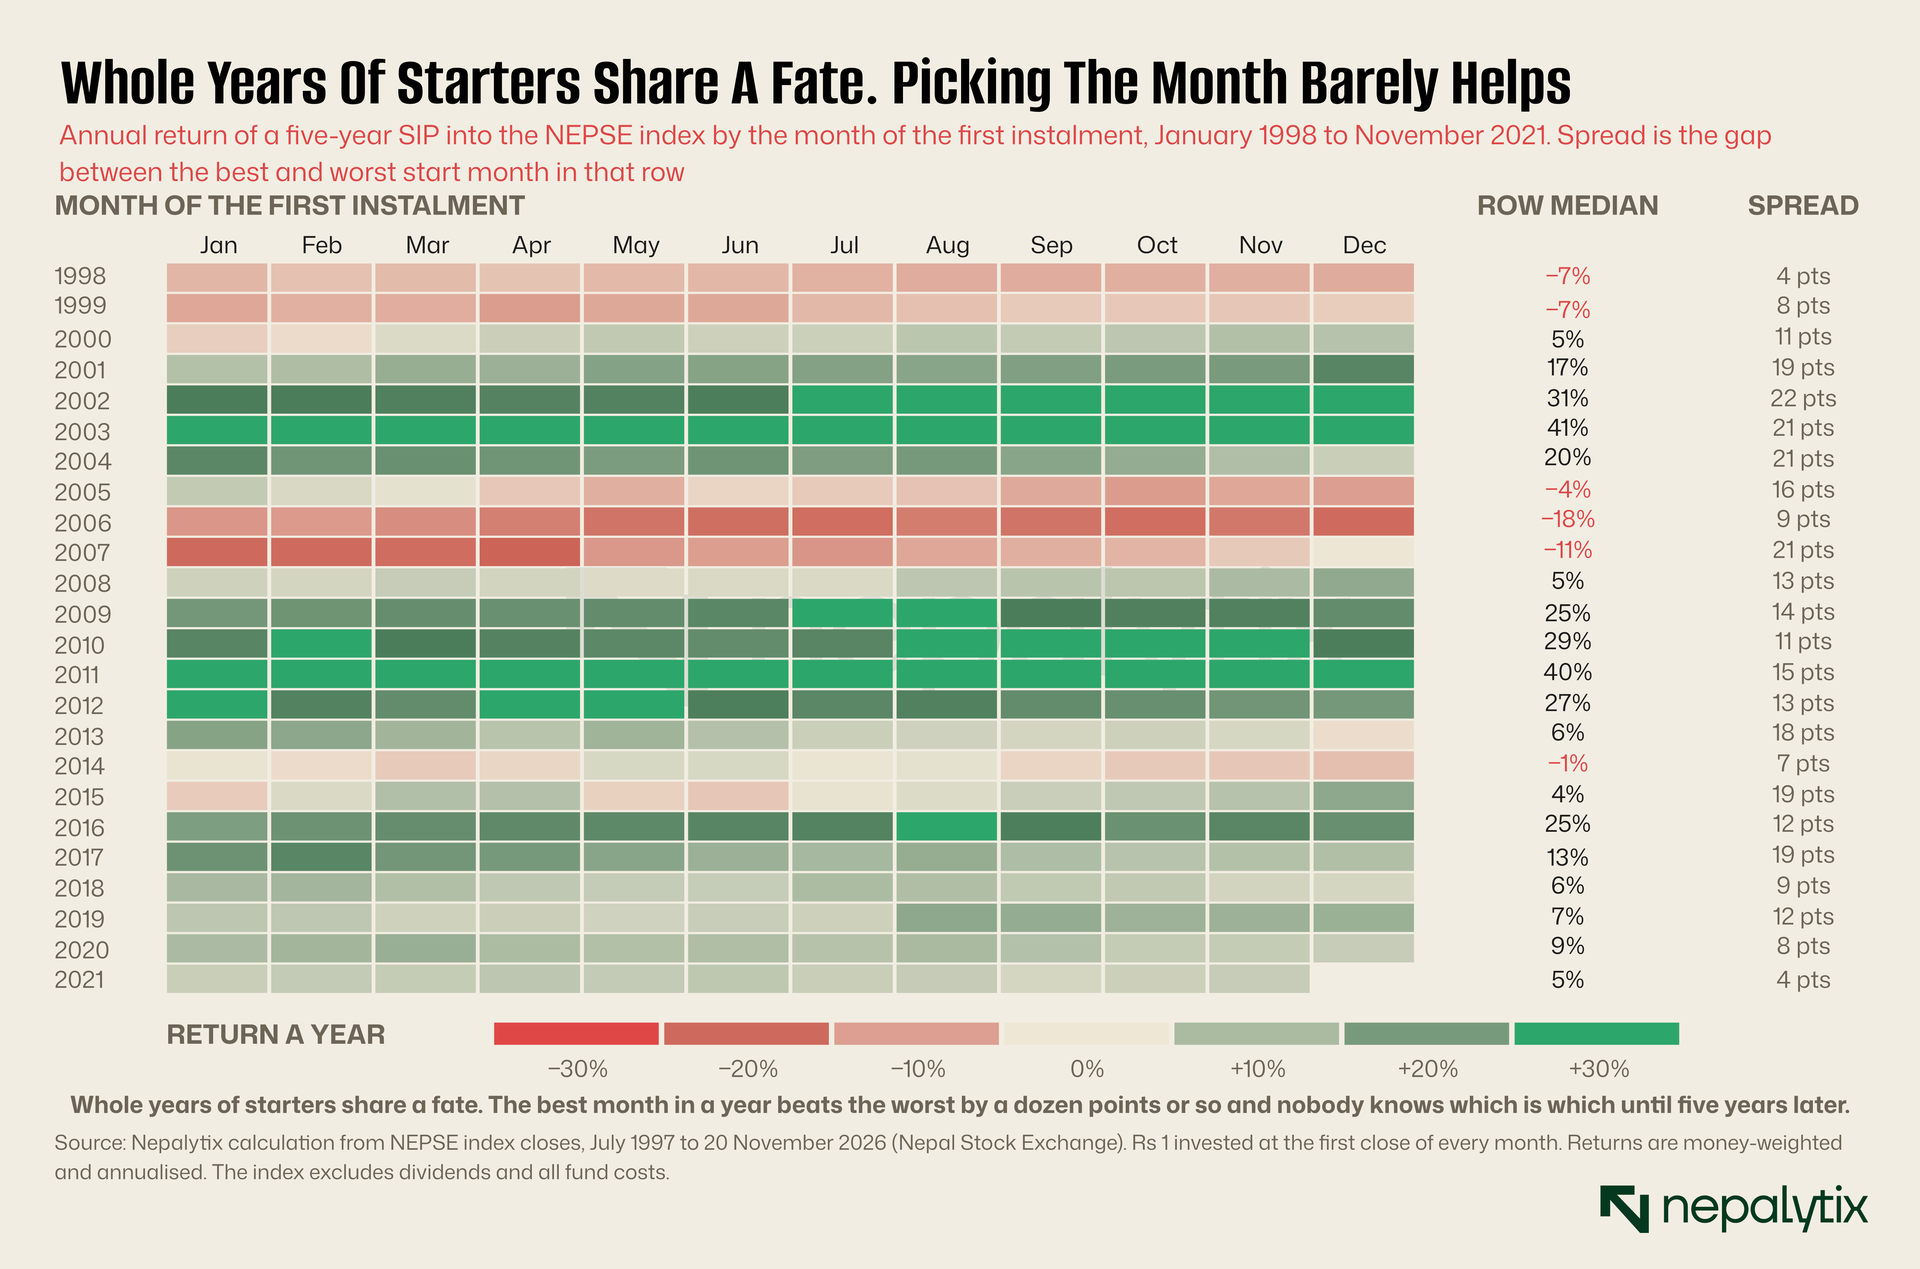
Each row is a year, each cell a start month, coloured by what a five-year SIP begun that month went on to earn. Read across. 2002 and 2003 are wall-to-wall green. 2006 is wall-to-wall red. Entire years of starters share a fate, because they all cash out in the same market five years later.
The spread column is the prize for picking the best month in a year over the worst. It runs from 4 to 22 points and usually sits in the low teens. That's real money, with two catches. You only find out which month was best five years later. And the gap between a good year and a bad year dwarfs it: 41% a year for the class of 2003, minus 18% for the class of 2006. Nobody in either class could have known which one they'd enrolled in.
So start when the salary allows and stop fretting about the month. The long SIPs back this up. A ten-year SIP earned a median of 11.8% a year with the middle half between 7.6% and 16%. A SIP started fifteen years ago and still going is earning 10.3% today. One started twenty years ago, a few months before the 2007 top (ouch) is earning 9.8%. Length doesn't delete the exit problem. A quarter of ten-year SIPs still earned under 8%. It shrinks it because a decade of instalments spans more than one market cycle and your average buying price ends up miles below almost any finishing price.
A Word On The Funds
Everything above uses the NEPSE index and you can't buy the index. That cuts both ways. The index ignores dividends which real funds collect so fund investors should have done somewhat better than our numbers. It also ignores management fees, entry and exit loads and the cash a fund leaves idle, all of which make them do worse. We don't know which effect wins for any particular scheme.
We tried to find out. Daily unit values are public for fourteen open-ended schemes, and seven of those go back at least two years. A SIP into each, valued this week on unit price alone, shows annual returns between minus 4.8% and plus 5.5%, with six of the seven trailing the index over the same months. We're not calling that a finding. A fund's unit value drops on the day it pays a dividend, and we couldn't get a complete record of the dividends. Without them the comparison isn't fair to the funds.
Which is sort of the point. A scheme publishes its unit value every single day. What it doesn't publish is the one number its SIP customers need: what a rupee a month has actually earned, after dividends and charges, for people who started one, three and five years ago. We keep running into this across Nepali finance. The headline figure is public and the figure you'd use to make a decision isn't. Until the schemes publish it, the spreadsheet is on you.
Underwater At Year Three? Welcome To The Club
This is where most SIPs go to die. Three years in, the balance is below what you've paid, the fund's marketing team has gone quiet and a fixed deposit starts to look like wisdom. If you started any time in the last two and a half years, this is you.
It's a big club. Of the 281 SIPs we could follow for a full six years, 100 were worth less than the money paid in after 36 instalments. The typical one was down 20% on its contributions. We tracked all 100 for three more years and because they come from four distinct market slumps, we've split them up that way.
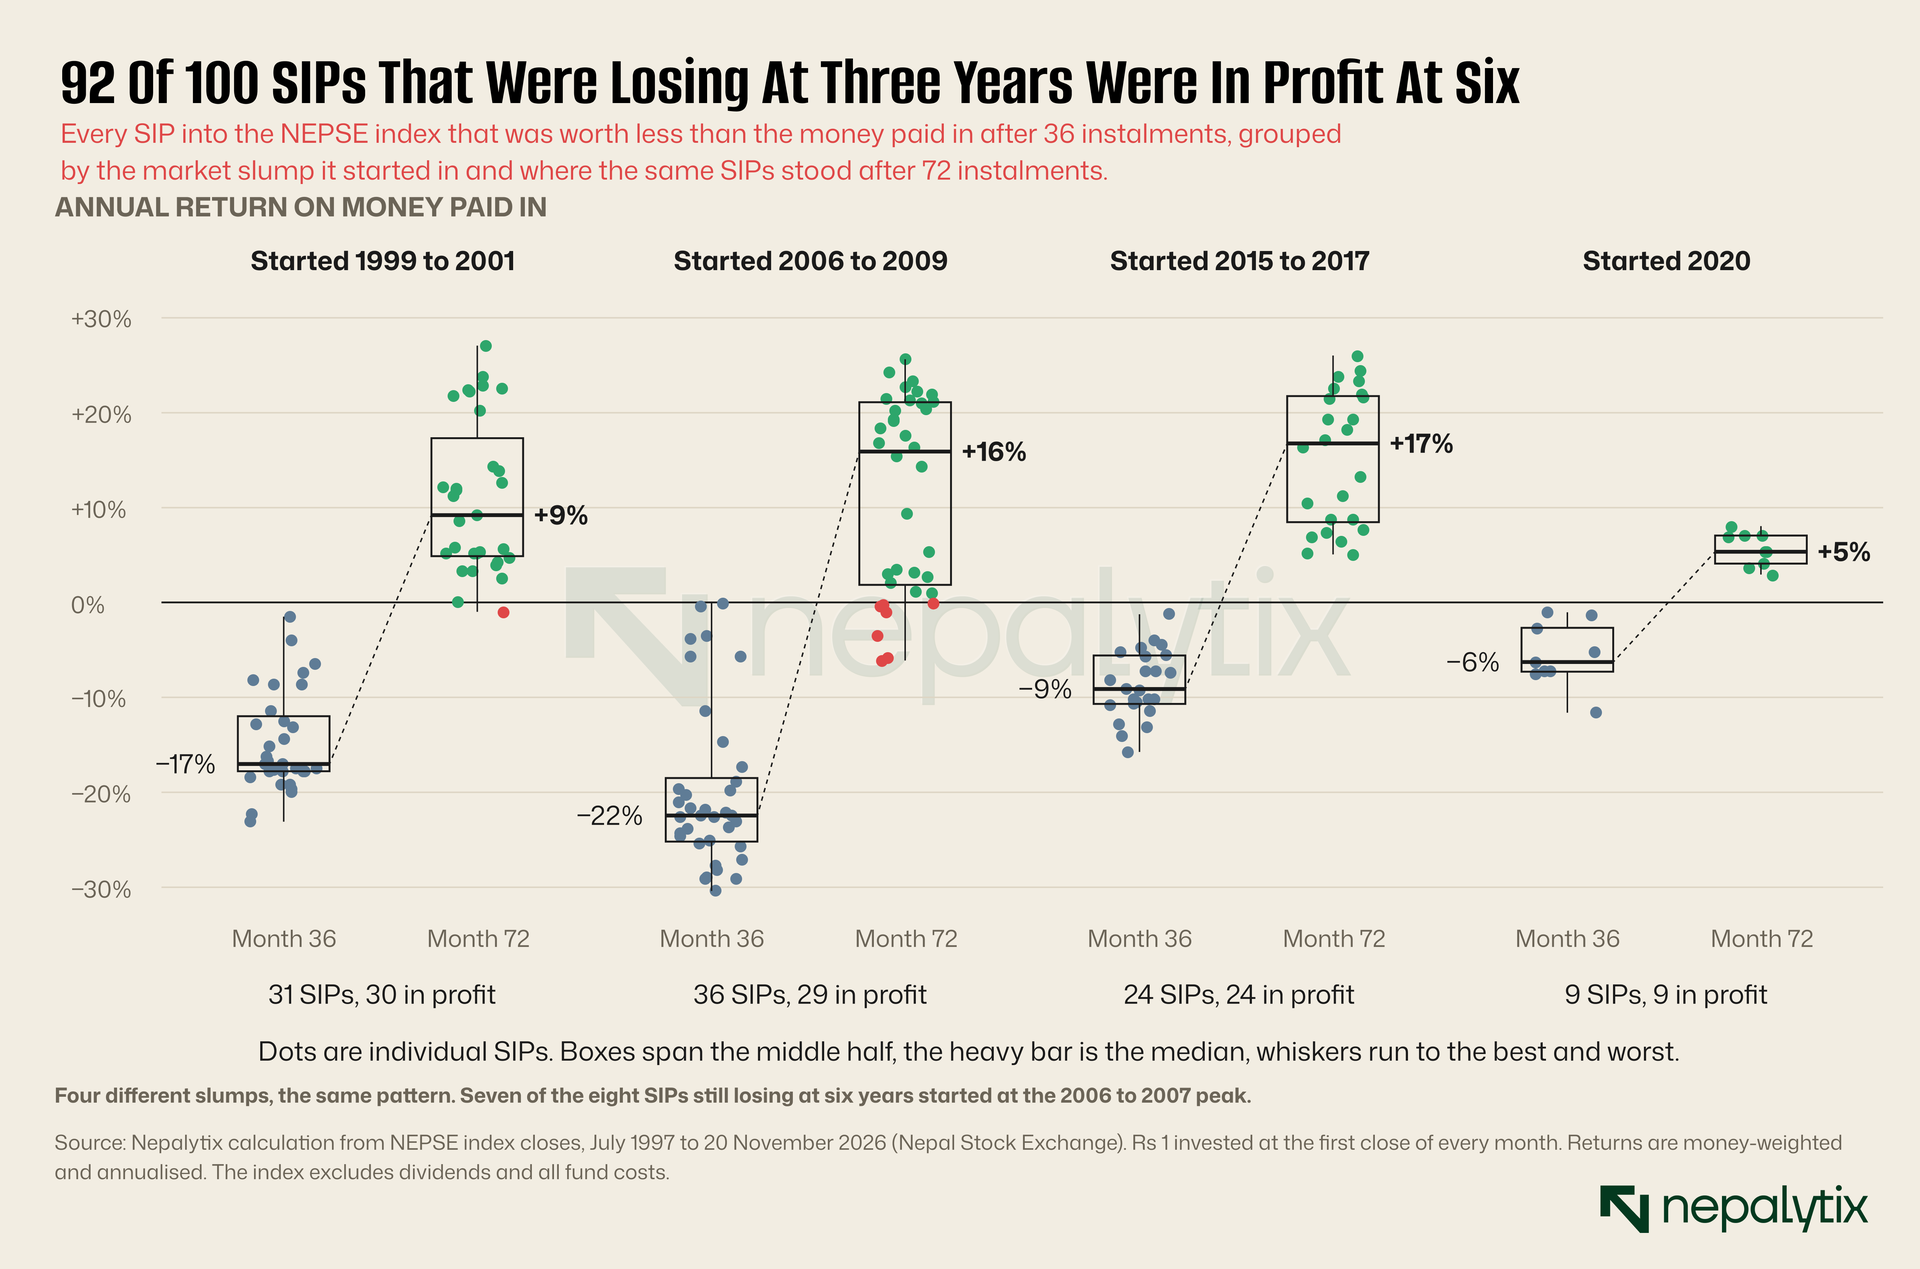
Ninety-two of the hundred were in profit at six years. The median return over the full six years was 10.9% a year and more than half beat 8%. It held up across every slump: 30 of 31 from the 1999 to 2001 group, all 24 from 2015 to 2017, all nine from 2020. The misses are almost all in one place. Seven of the eight SIPs still losing after six years started between late 2006 and mid-2007, at the top of the biggest boom the index had seen.
Now the fun part. The SIPs that were winning at three years went on to a median of 8.6% over six, and only 74% of them were in profit at the end. The strugglers beat the leaders. It's the same arithmetic as before, finally working for you. If you're underwater at three years, the market has been falling which means your next 36 instalments buy cheap with most of your money still to come.
We also tested the halfway option, the person who stops paying but doesn't sell. They keep the units from the first three years and add nothing. At six years, 76% were in profit with a median of 7.9%. Better than selling at a loss. Worse than carrying on, because they skipped the cheapest shopping of the entire run.
Two caveats and they're real ones. A hundred SIPs sounds like a lot of evidence but it's four market cycles, not a hundred independent experiments. And the eight failures weren't random. They were the people who started closest to a major peak and needed more than six years. Sticking with it has a strong record in this market. It doesn't come with a guarantee.
We Tested The Obvious Fix. It's Insurance, Not Magic.
If the exit is the problem, the fix seems obvious. You averaged in, so average out. Don't sell on one day. Spend the last two years moving the money to a deposit a slice at a time.
We were all set to tell you to do exactly that. Then we tested it which is a habit we recommend.
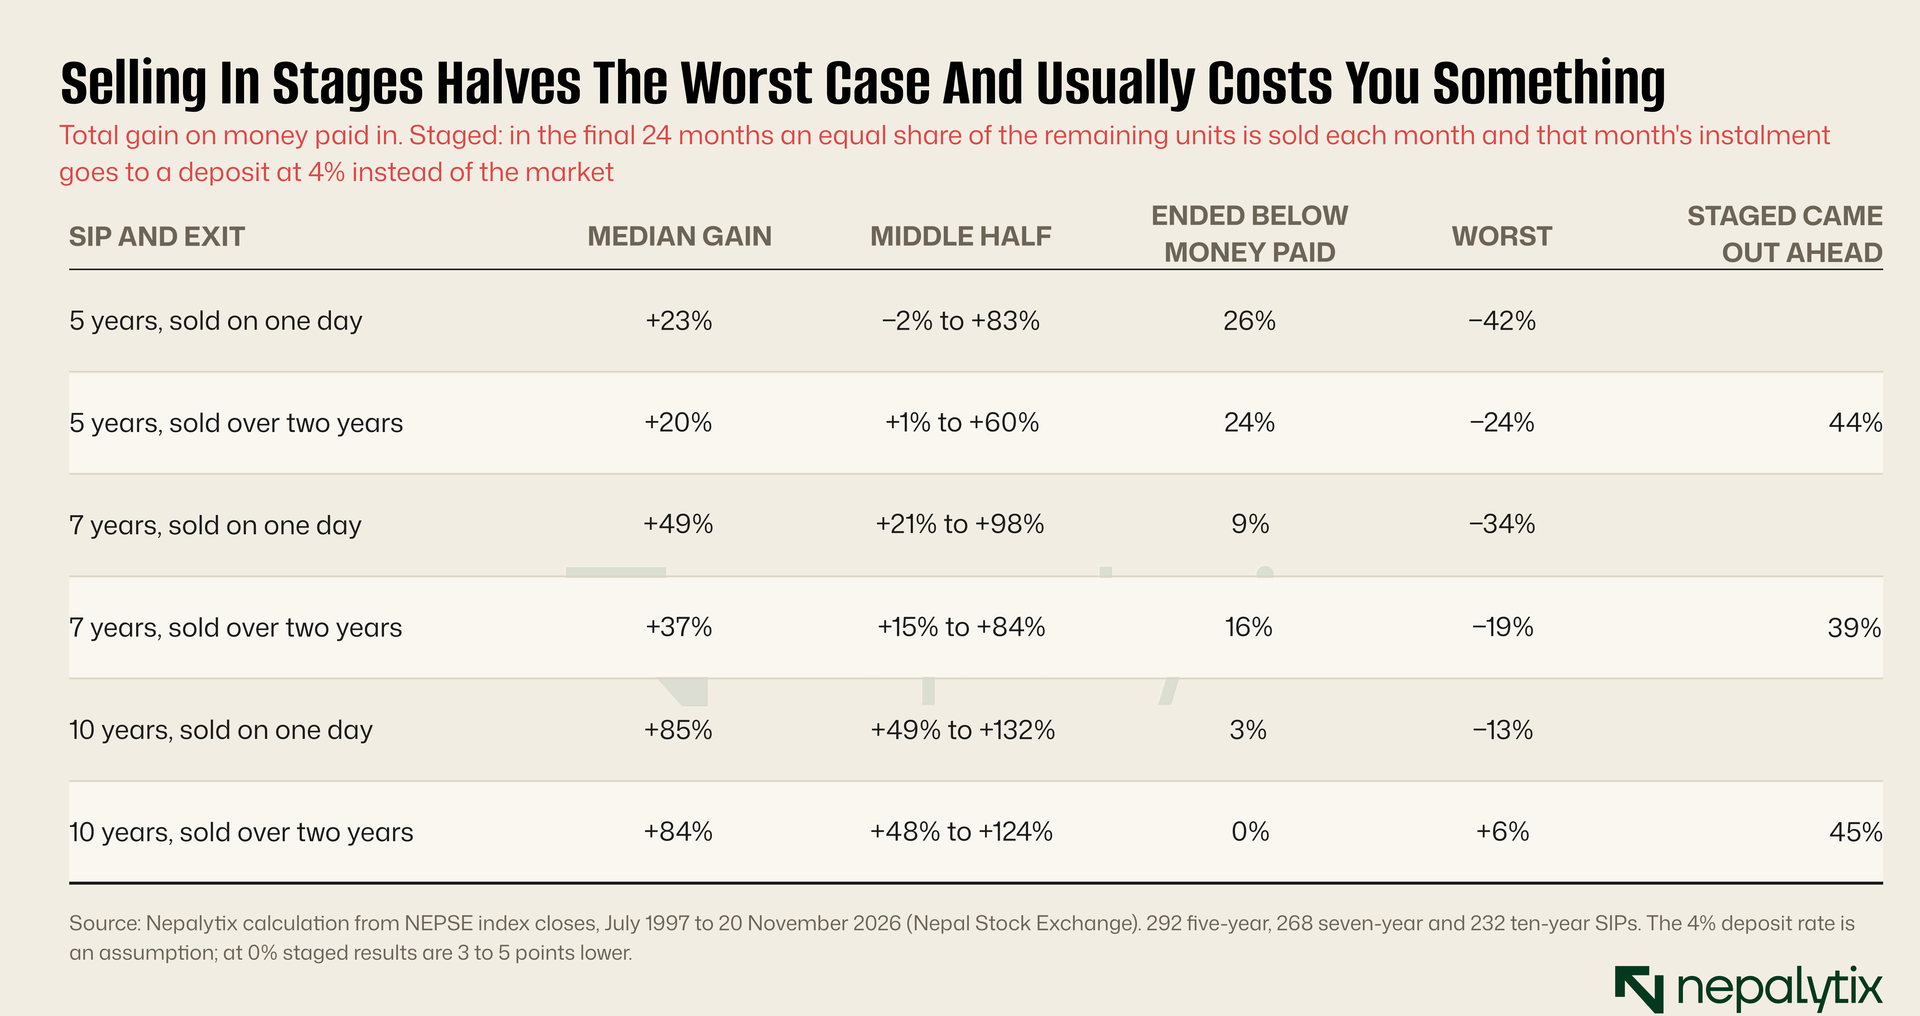
It's more complicated than the neat version. Staging the exit does what insurance does. It cut the worst five-year outcome from a 42% loss to a 24% loss, and the worst seven-year outcome from 34% to 19%. For ten-year SIPs it wiped out losses altogether: the worst staged result was a 6% gain. When the single-day exit lost money, staging beat it about four times in five.
And like insurance, it has a premium. In most years the market is higher at the end than it was over the two years before, so selling early leaves money behind. The staged exit came out ahead only 39% to 45% of the time. For seven-year SIPs the median gain dropped from 49% to 37%, and the share ending below the money paid in actually rose, from 9% to 16% because selling into a slump in years five and six locks in losses that a rebound in year seven would have erased.
So it's a trade and which side you want depends on the money's job. If it's a house deposit or school fees with a hard date, pay the premium. Halving the worst case is what you're buying and you should buy it. If the date is soft, there's a cheaper kind of insurance and it's being able to wait. Of the 75 five-year SIPs that finished below the money paid in, 41% were back in profit a year later if the saver kept going and 88% two years later. A deadline that can slip by two years did nearly as much as a staged exit and gave up none of the upside.
So What Do You Actually Do?
Get your real number. Ask your fund manager for the money-weighted annual return on your own SIP, dividends included, or work it out with XIRR. Until you have it you're comparing a bank's annual rate with an app's cumulative one.
Think in sevens. Five-year SIPs lost money one time in four. Seven-year SIPs, one in eleven. Ten-year SIPs, almost never. If the money has a job to do in three or four years, an equity SIP has been close to a coin toss against a deposit.
Forget the start date. It's worth a few points at best and you can't know it in advance. Spend the worry somewhere useful.
Decide now whether your deadline is hard or soft. This is the question the data cares about most and almost nobody asks it on day one. Hard date: stage the exit over the last two years and accept that it will probably cost you a little. Soft date: stay fully in, and give yourself two years of slack on the other side. What you can't do is have a hard date, stay fully in until the last day, and hope. That's the January 2012 plan.
Underwater and don't need the cash soon? Keep paying. Ninety-two in a hundred isn't a promise. It is a much better record than stopping, and a far better one than selling.
Keep the deposit rate as your bar. Shares are only worth the stomach ache if they beat what the bank pays for no stomach ache. Right now that bar is on the floor, around 3.9%. Three years ago a state-owned bank was paying over 9% on the same product. Check your number against it once a year and be honest about which side you're on.
None of this makes the SIP a bad idea. It's still the best savings habit most salaried people in Nepal can get: small ticket, no willpower required and over ten years it has nearly always worked. It was just oversold on one point. You were told it means you never have to think about timing. It means you never have to think about timing at the start. The end is still yours to manage.
Disclaimer
This report has been prepared by Nepalytix for informational and educational purposes only and does not constitute investment advice, an offer, or a solicitation to buy or sell any securities.
The information contained in this report is based on sources believed to be reliable; however, Nepalytix does not guarantee its accuracy, completeness, or timeliness. Opinions, estimates, and projections expressed herein are those of the authors as of the date of publication and are subject to change without notice.
Investing in securities involves risks, including the possible loss of principal. Past performance is not indicative of future results. Readers are advised to conduct their own independent research and consult with a qualified financial advisor before making any investment decisions.
Nepalytix and its contributors may hold positions in the securities discussed in this report at the time of publication or thereafter.
Neither Nepalytix nor any of its affiliates accept any liability for any loss arising from the use of this report or its contents.