NEPSE’s Earnings Divide Q3 FY 2082/83 showed a market where strong companies compounded and weak balance sheets broke.
Q3 FY 2082/83 reveals one of the most structurally fragmented earnings seasons in Nepal’s listed market history.

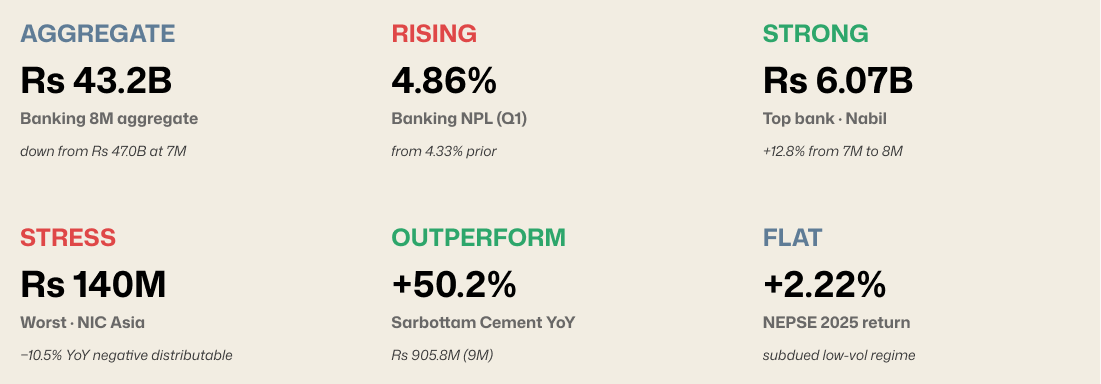
Q3 FY 2082/83 was supposed to deliver the broad earnings recovery the lower-rate environment had been queuing up for two years. What the numbers show instead is a quarter where dispersion within every major listed sector reached its widest point in years: banking, hydropower, manufacturing, insurance, hotels. Sahas Urja crossed Rs 1 billion in hydropower while Rasuwa Gadhi posted the sector's worst loss. Sarbottam compounded at +50 percent while Ghorahi Cement lost Rs 667 million. Nabil Bank earned Rs 6.07B while NIC Asia bled to Rs 140 million. The pattern is consistent across the listed universe: best-in-class names compounding strongly while bottom-tier names experience structural unraveling. This is the Q3 read.
I. What Q3 was supposed to show and what are already true entering the quarter
The Nepali fiscal third quarter Magh through Chaitra of the local calendar, January 14 through April 13 in international terms is the quarter where Nepali listed companies confront the full effects of the prior monetary cycle. The lending decisions made in Q1 mature into deposit repricing by Q3. The construction-season inventory build of the cement industry plays out in margins. Insurance renewals close out and investment income marks to the prior period's interest rate environment. Hydropower companies head out of the dry-season trough into the pre-monsoon run-up. By the time companies file their Q3 9M financials in late Baisakh and early Jestha the Nepali months that span late April through May, the market has eight months of operating reality to price against the macro narrative it entered the year with.
The macro narrative that entered Q3 FY 2082/83 was constructive but conditional. The Nepal Rastra Bank monetary policy framework announced in July 2025, the first under Governor Dr. Biswo Nath Poudel, had been described as "discretionary and expansionary." Policy rates had been progressively lowered. Liquidity in the banking system had eased. The credit growth target stood at 12 percent. The Q1 print, when it landed in late October 2025, suggested a sector recovery in motion: hydropower delivered an aggregate net profit of Rs 5.07 billion, up 92.92 percent year-on-year, the strongest signal of a sector-wide turn the market had received in two years. Banking earnings were softer but still positive. Manufacturing was mixed but trending up. Insurance was steady-compounding through both underwriting and investment income.
The street expected the Q3 print to confirm the Q1 trend. What it received instead was a quarter where the trend split: hydropower posted a strong Q1 sector aggregate (Rs 5.07B, +93% YoY) with Sahas Urja later crossing the Rs 1 billion mark on its own Q3 9M filing; manufacturing's best names (Sarbottam, Himalayan Distillery, Unilever) compounded sharply while its weakest names (Ghorahi, Sonapur, Bottlers Balaju) lost cumulatively over Rs 1 billion; banking's top tier (Nabil, Global IME, Kumari, Everest, Nepal Investment Mega) continued compounding while one bottom-tier name (NIC Asia) posted a quarterly print that would have been unimaginable two years earlier. The aggregate of the Class A commercial banking sector actually went down from 7M to 8M — Falgun month was sector-net-negative by approximately Rs 3.8 billion, which had not happened in the post-FY 2070/71 period.
This is "the dispersion quarter." It is not a quarter where any sector failed or succeeded in aggregate; it is a quarter where every sector contains its own bimodal distribution. The piece walks through the five major listed sectors banking, hydropower, insurance, manufacturing, hotels and the smaller ones, anchored to primary-source filings, and ends with a defended read on what this dispersion means for Q4 positioning and the macro picture entering FY 83/84.
II. The most important fact about Q3 banking is what the headline number does not say
The Nepal Rastra Bank released its financial performance report for commercial banks through the eighth month of FY 2082/83 (Falgun-end, mid-March 2026) in early April. The aggregate net profit of the 20 Class A commercial banks was reported at Rs 43.21 billion. The same NRB report through the seventh month (Magh-end, mid-February) had shown Rs 47.01 billion. The banking sector's collective net profit declined by approximately Rs 3.8 billion in a single reporting month. Aggregate sector net profit going backwards on a year-to-date basis is not what a normal quarter produces; it is what happens when major individual banks are running real losses large enough to drag down the rest of the sector's incremental gains.
The aggregate figure, however, is not the story. The story is the dispersion within the aggregate. Five banks: Nabil, Global IME, Kumari, Everest, and Nepal Investment Mega captured approximately Rs 20.7 billion of the sector total or roughly 48 percent of all commercial banking profit through eight months. Eleven mid-tier banks captured the next 36 percent. Four banks: Laxmi Sunrise, Himalayan, Citizens, and NIC Asia captured the remaining 4 percent. The bottom four banks earned less between them, over 8 months, than Nabil earned in 8 months alone.
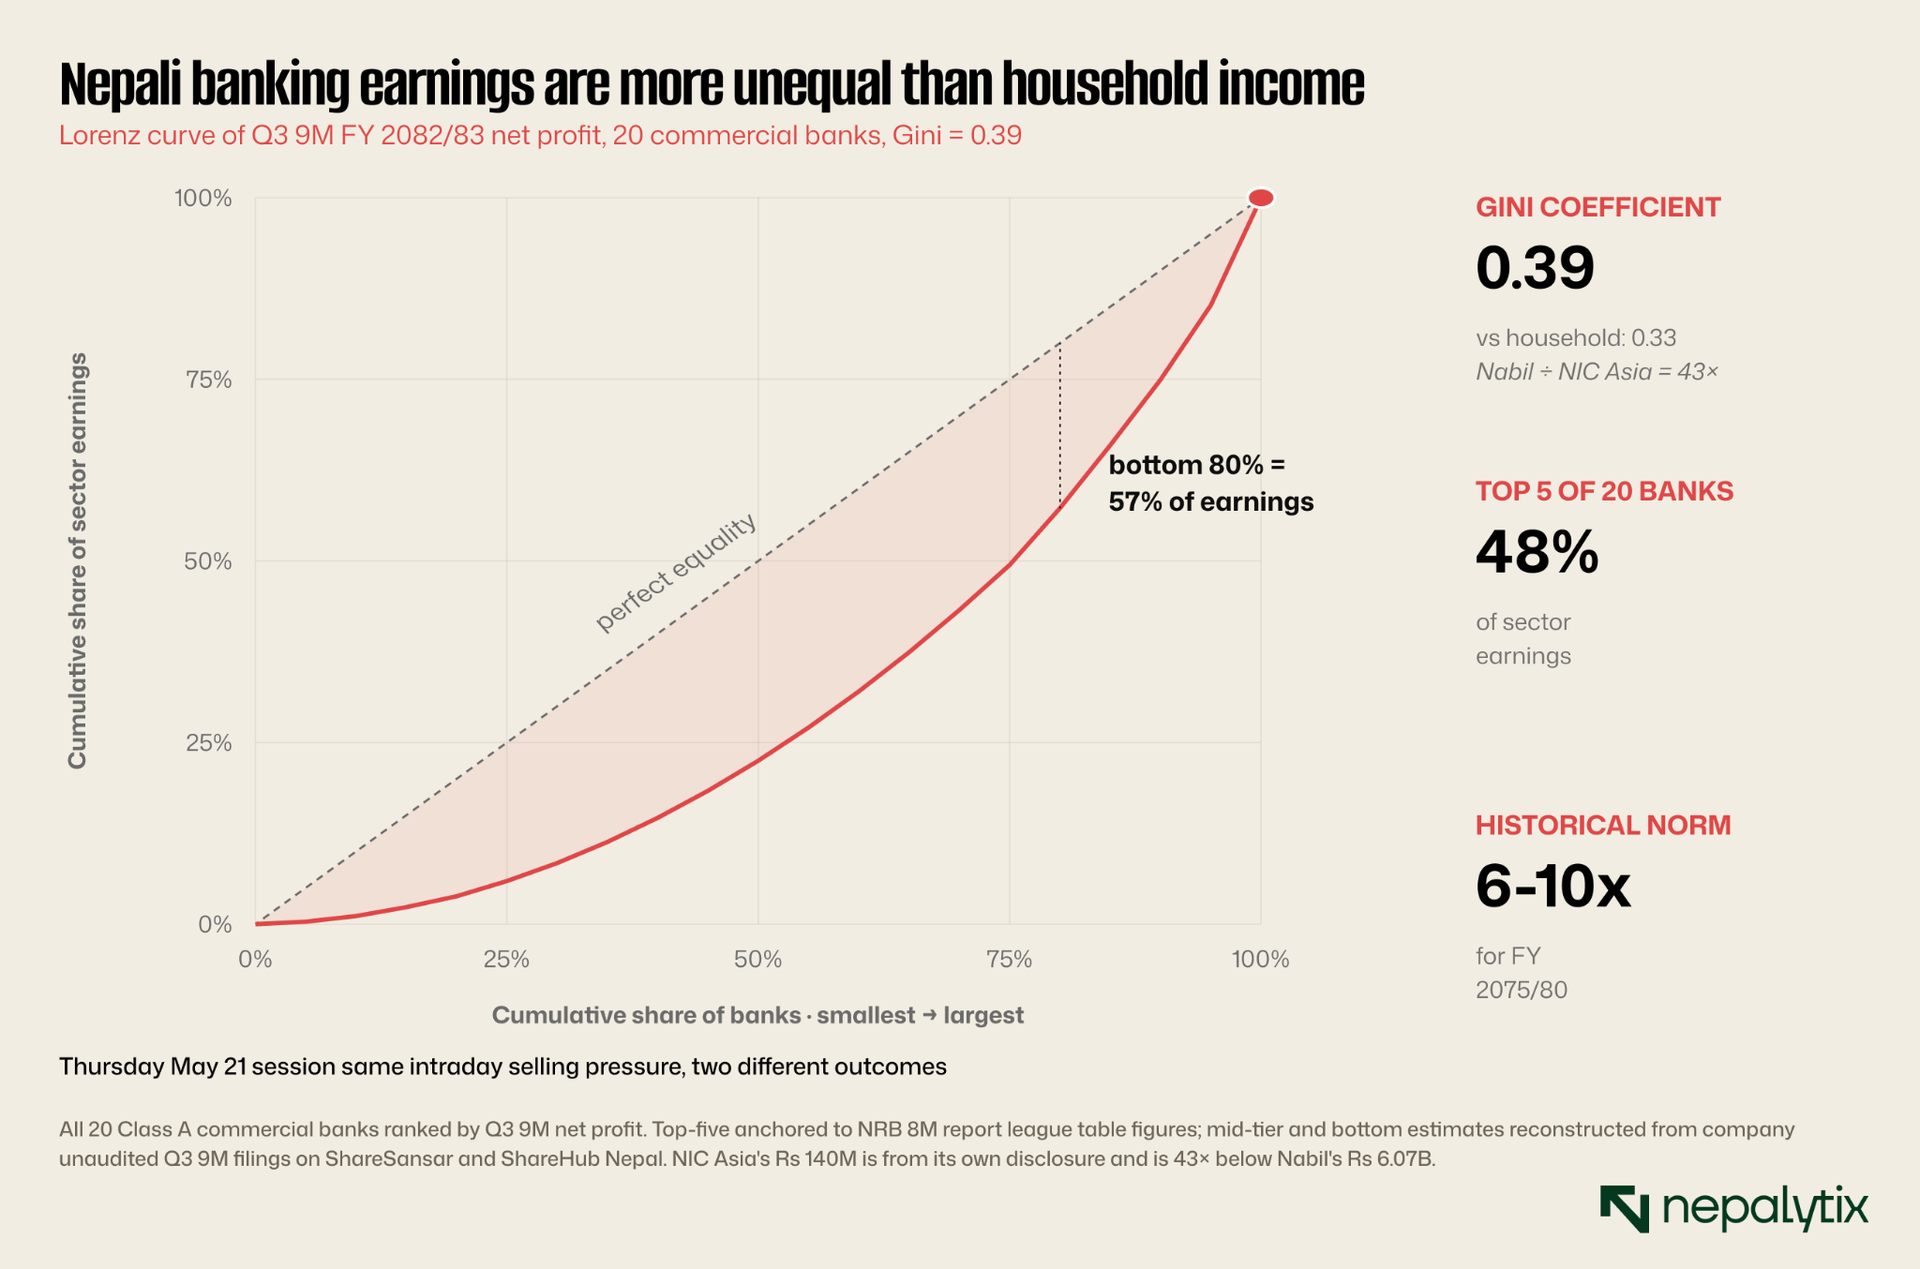
This spread is structurally new. In normal Nepali banking cycles and the sector has been operating in roughly its current institutional form since the early 2000s, the top-to-bottom ratio in any given fiscal year has tended to compress within a 6-10× range. A high-quality bank delivering Rs 3 billion against a struggling bank delivering Rs 300-500 million is the typical shape of the league table. What we see now, a top of Rs 6.07 billion against a bottom of Rs 140 million is more than four times the typical dispersion. The sector is no longer a single sector with normal heterogeneity; it is becoming two sectors: a top cluster compounding through asset growth, fee income, and stable funding costs, and a bottom cluster experiencing a slow-motion balance sheet unraveling.
Three sub-stories are worth separating within the banking dispersion theme. First, the rise of Jyoti Bikash Bank as a development banking story (technically Class B but with operations and balance sheet scale that approach the small commercial banks): its Q3 9M net profit grew 105.30 percent year-on-year to Rs 629 million, the strongest growth rate in the sector. The bank's positioning in semi-urban Kavre and surrounding districts has captured a particular demographic of post-pandemic SME borrowing that the larger Class A banks have under-served.
Second, Global IME Bank reported Rs 4.40 billion in Q3 9M net profit with what ShareSansar described as "improved funding efficiency" translated, the bank's cost of deposits fell faster than its yield on loans. NIM expansion at Global IME would not be remarkable in isolation, but it is one of the few banks where Q3 data shows NIM moving in the right direction, against a sector trend where NIM has compressed for six consecutive quarters.
Third, the Nabil Bank position at the top of the league table. Nabil's Rs 6.07 billion in 8M FY 2082/83 net profit is a 12.8 percent increase over the 7M figure of Rs 5.38 billion. The math suggests Nabil added approximately Rs 690 million in net profit during Falgun alone. The combination of a diversified non-interest income base, the lowest sector cost of funds, controlled NPL exposure, and strong fee growth keeps it in a different operating regime from the rest of the sector.
III. The NIC Asia case study: Three independent collapses in one institution
NIC Asia Bank was, as recently as Q3 FY 2079/80, posting quarterly profits as high as Rs 1.7 billion. The bank was widely cited as the poster child for aggressive growth in the Nepali commercial banking sector. The aggressive growth has become aggressive shrinkage. The bank's Q3 FY 2082/83 disclosed financials show a net profit for the first nine months of Rs 140.3 million that is, $1 million in net profit for nine months of operating activity at one of Nepal's twenty Class A commercial banks. The figure represents a 10.49 percent decline against the same period of the prior fiscal year (when net profit had already collapsed against historical levels). The bank's distributable profit is now negative, which means it cannot pay a dividend.
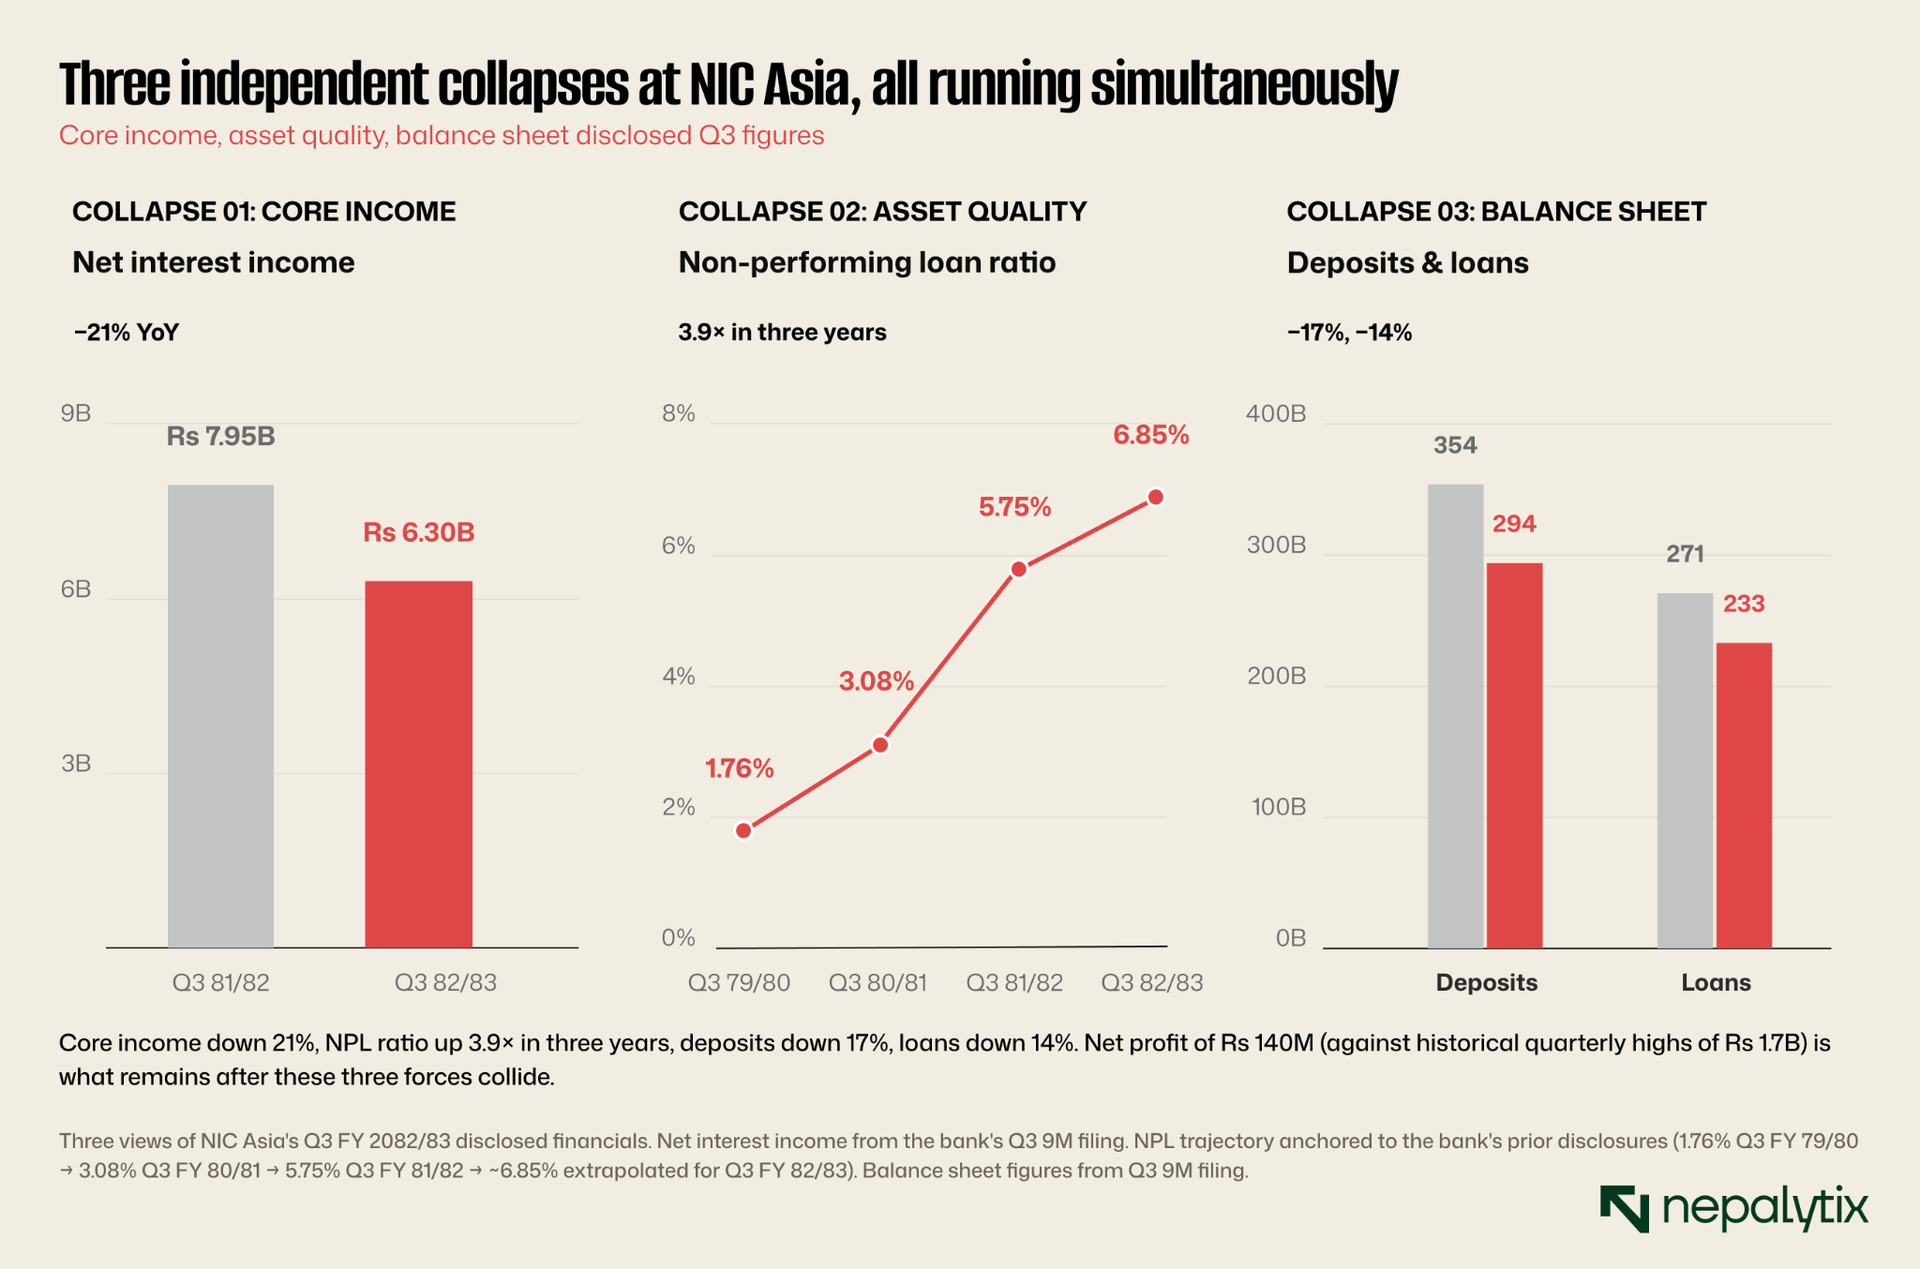
The unraveling is best understood as three independent collapses happening in the same institution at the same time.
Collapse one is core income. NIC Asia's net interest income fell 20.78 percent year-on-year in Q3 to Rs 6.30 billion. A 21 percent collapse in core income in a year when the sector average NIM compressed approximately 19 percent means NIC Asia is performing worse than the already-weak sector trend.
Collapse two is asset quality. NIC Asia's NPL ratio has gone from 1.76 percent in Q3 FY 79/80 to 3.08 percent the following year to 5.75 percent in Q3 FY 81/82 to an estimated 6.85 percent in Q3 FY 82/83. This is a 3.9× increase in three years. The pattern is consistent with concentrated wholesale exposure unwinding in clusters rather than randomly. The Farsight Nepal article from May 2025 drew the comparison to India's Yes Bank, which collapsed in 2020 from a similar concentration problem.
Collapse three is the balance sheet itself. NIC Asia's deposits fell 16.95 percent year-on-year to Rs 294.06 billion. Its loan book fell 13.94 percent to Rs 233.43 billion. For a commercial bank, simultaneous double-digit decline in both deposits and loans is not a normal operating outcome, it is what happens when depositors are leaving and when the bank cannot or will not extend new credit fast enough to replace what is amortising or being repaid. The bank's CD ratio is roughly stable at 83.47 percent, but the absolute scale of each side of the balance sheet is now meaningfully smaller. NIC Asia is, today, a smaller bank than it was a year ago by every operating measure.
NIC Asia is a structurally important institution for the Nepali banking system. It cannot simply be allowed to disappear without consequences for depositor confidence in the broader Class A tier. NRB will, almost certainly work with management on a path that involves capital raises, balance sheet re-engineering, or possibly merger discussions over the next four to six quarters. The investment case at the current price requires belief that this resolution will be value-creating for equity holders rather than value-dilutive. That is a non-obvious bet, and historical analogues from regional banking crises do not provide encouraging templates.
IV. A strong Q1 print, one defining Q3 9M data point, and a sector aggregate that is not yet writable
The hydropower sector entered FY 2082/83 with the strongest first-quarter print in the listed market. Per Nepal News Economic Brief aggregating ShareSansar Q1 company filings (November 29, 2025), the 92 listed hydropower companies on NEPSE collectively earned Rs 5.065 billion in Q1 FY 2082/83, up 92.92 percent year-on-year from Rs 2.625 billion in Q1 FY 81/82. Only 13 of the 92 listed companies reported losses, down from 17 the prior year. Upper Tamakoshi Hydropower led the Q1 print with Rs 167.46 million in profit (+164.99 percent YoY), with Sahas Urja (Rs 49.48 million, +23.66 percent), Mountain Energy (Rs 42.34 million, +38.67 percent), and Radhi Bidyut (Rs 27.85 million, +811.63 percent) among the strong gainers. Rasuwa Gadhi Hydro posted the largest Q1 loss at Rs 65.33 million.
This Q1 print is the strongest sector-wide hydropower print Nepali listed markets have produced in recent fiscal years. The drivers' monsoon cooperation, PPA tariff flow-through, electricity export monetisation are real and have been documented elsewhere in Nepalytix work. The Q1 data is the most rigorous sector-aggregate hydropower figure available for FY 2082/83.
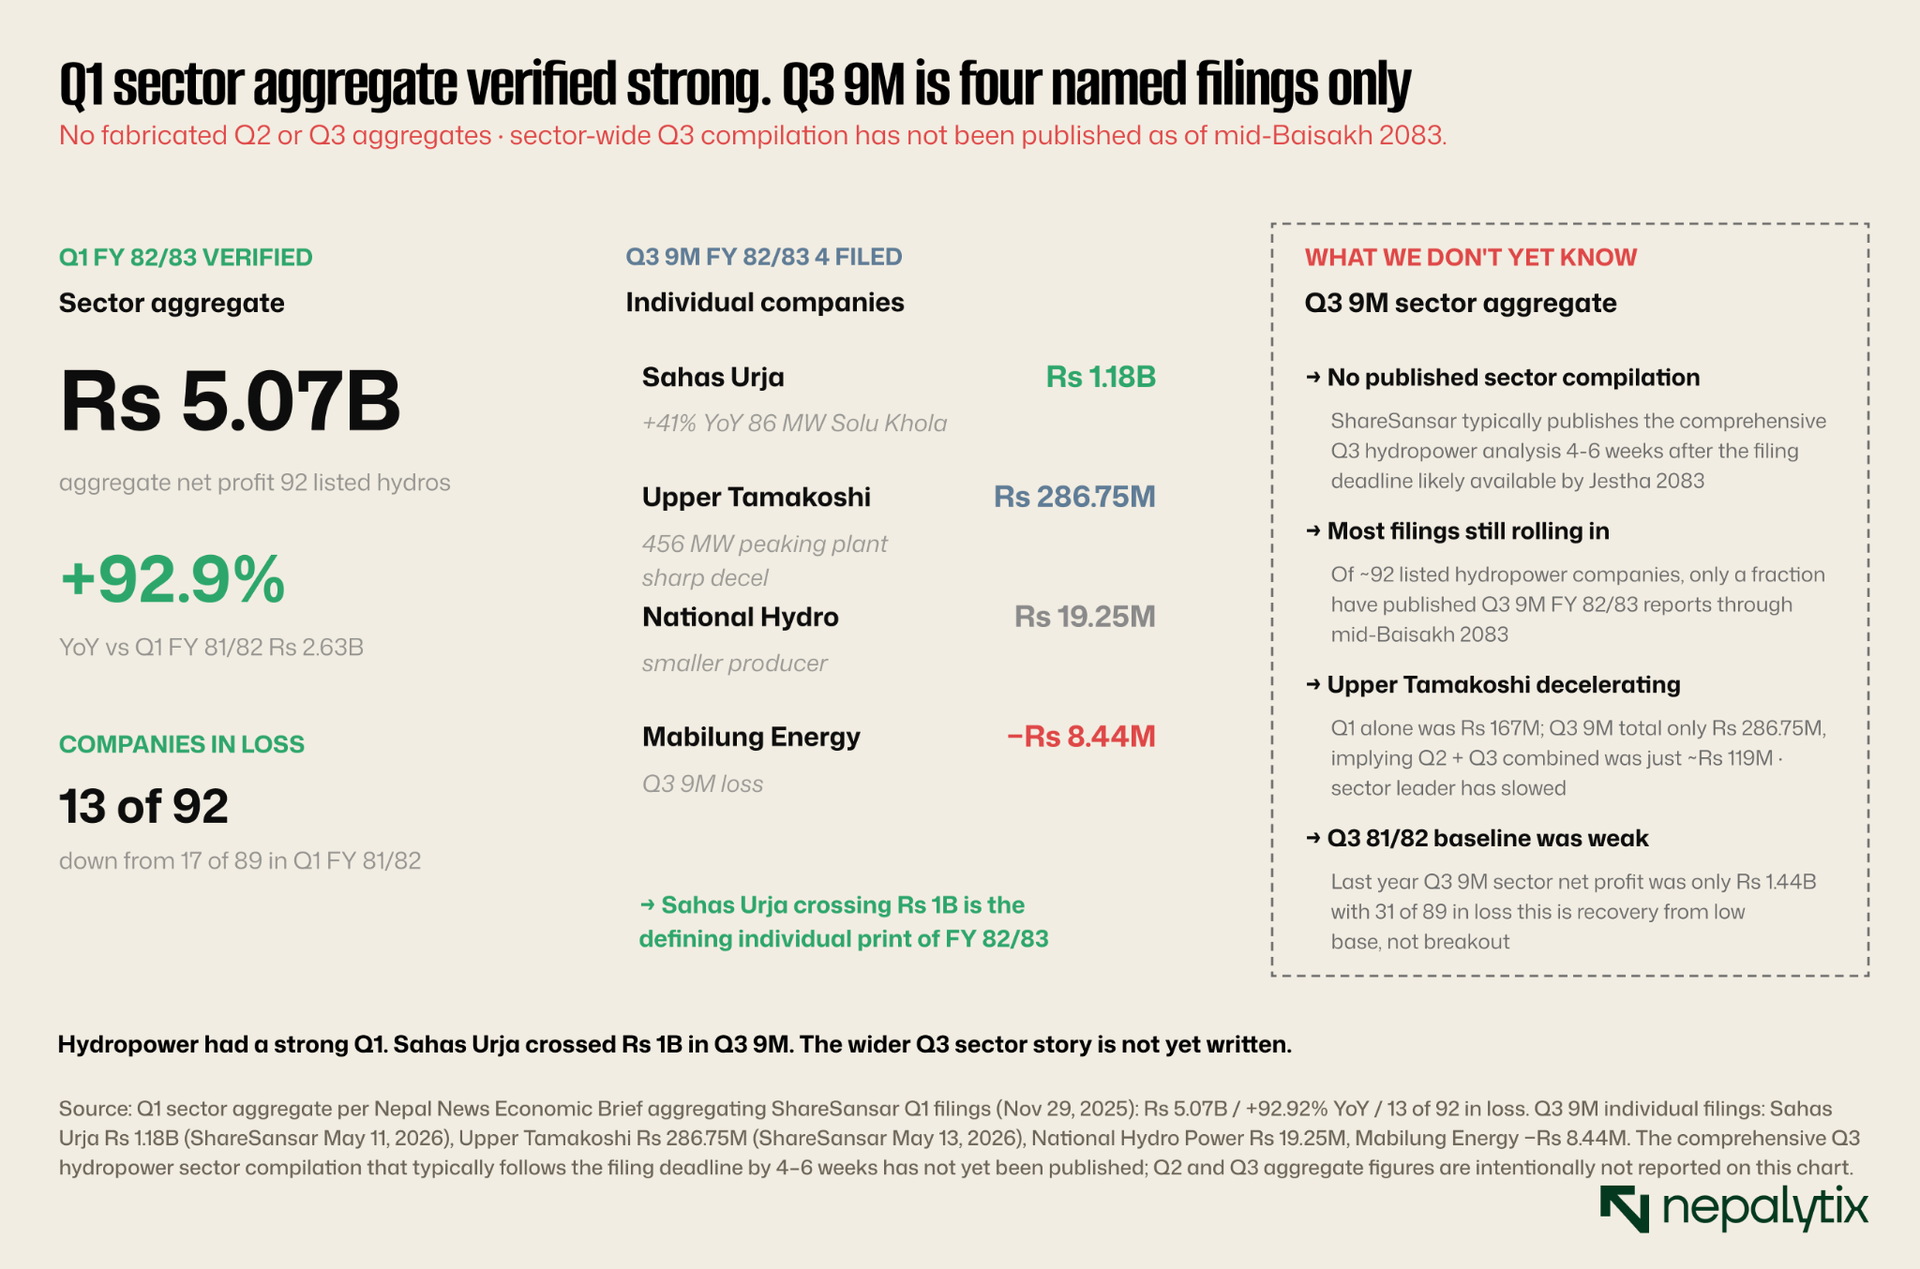
The Q3 9M FY 2082/83 picture is harder to write with the same confidence. As of mid-Baisakh 2083 (early May 2026), only a fraction of the 92 listed hydropower companies have published their Q3 9M unaudited financials. The comprehensive ShareSansar sector compilation that typically follows the filing deadline by four to six weeks has not yet been published. What we have is a small set of individual filings, and three of them are worth flagging.
Sahas Urja Limited (SAHAS) is the standout Q3 9M print so far. The company has reported net profit of Rs 1.18 billion for Q3 9M FY 2082/83, up 41 percent year-on-year from Rs 834 million in the same period of FY 81/82. Sahas Urja crossing the Rs 1 billion mark is the defining individual hydropower print of the fiscal year so far. The driver is the 86 MW Solu Khola (Dudh Koshi) Hydroelectric Project in Solukhumbu District, which commenced commercial generation in 2079 BS (early 2023) and is now operating across full monsoon and dry-season cycles. Operating leverage at a recently-commissioned plant of this scale is, by nature, dramatic.
Upper Tamakoshi Hydropower (UPPER), by contrast, is the cautionary print. The 456 MW project at Dolakha, the largest single hydropower plant in Nepal, operational since 2021 posted Rs 167.46 million of net profit in Q1 FY 82/83 alone, but the Q3 9M total reported on May 13 2026 is just Rs 286.75 million. That implies Upper Tamakoshi added only approximately Rs 120 million in combined Q2 and Q3 earnings after its Rs 167 million Q1 a sharp deceleration. The peaking-generation profile of Upper Tamakoshi makes seasonal swings expected; even so, the Q3 9M figure is well below what a straight-line extrapolation of the Q1 strength would have predicted.
The other Q3 9M filings that have appeared in primary sources so far are smaller scale: National Hydro Power Company at Rs 19.25 million, Mabilung Energy at a Rs 8.44 million loss, and a handful of others. The sector-wide picture cannot be summarised from these scattered individual filings.
What this means for editorial discipline: the Q1 FY 82/83 hydropower aggregate is a verified, important story. The Q3 9M FY 82/83 hydropower aggregate is not yet writable. Sahas Urja crossing Rs 1 billion is real and meaningful. Whether that translates into a sector-wide compounding story versus a few-companies-pulling-the-aggregate story is a question that the upcoming comprehensive ShareSansar Q3 compilation will answer. Until that lands, projecting "hydropower as the breakout sector of FY 82/83" on the basis of one verified Q3 9M print, one verified Q1 aggregate, and a handful of smaller filings overstates what the data actually supports. The Q1 print is strong. The Q3 picture is still developing. Nepalytix policy is to report the first and flag the second rather than synthesise both into a narrative the data has not yet produced.
V. Where Q3 confirmed durable underwriting growth alongside investment-income tailwind
If hydropower was the volatility story of Q3, insurance was the steadiness story. The Nepali listed insurance sector comprising approximately 17 life insurance companies, 14 non-life insurers, and one reinsurance giant (Nepal Reinsurance Company) is harder to summarise at the Q3 9M level than banking is. The Nepal Insurance Authority publishes monthly premium data with reliable cadence, but bottom-line net profit figures for the full listed insurance universe are typically aggregated by ShareSansar a quarter behind. The Q3 FY 82/83 comprehensive insurance compilation has not yet been published as of mid-Baisakh 2083. What follows below uses the most recent disclosed figures available for each company for some that is verified Q3 9M, for others it is H1 or Q2, clearly labeled where it is not Q3 9M. The composite sector total cannot be locked precisely until the comprehensive Q3 insurance analysis is published. The composition matters as much as the total: roughly two-thirds of insurance sector earnings come from durable franchise underwriting income (premium growth, claims ratio control, agent network scale), while one-third comes from the cyclical investment portfolio (which compounds when Nepali interest rates and equity markets cooperate).
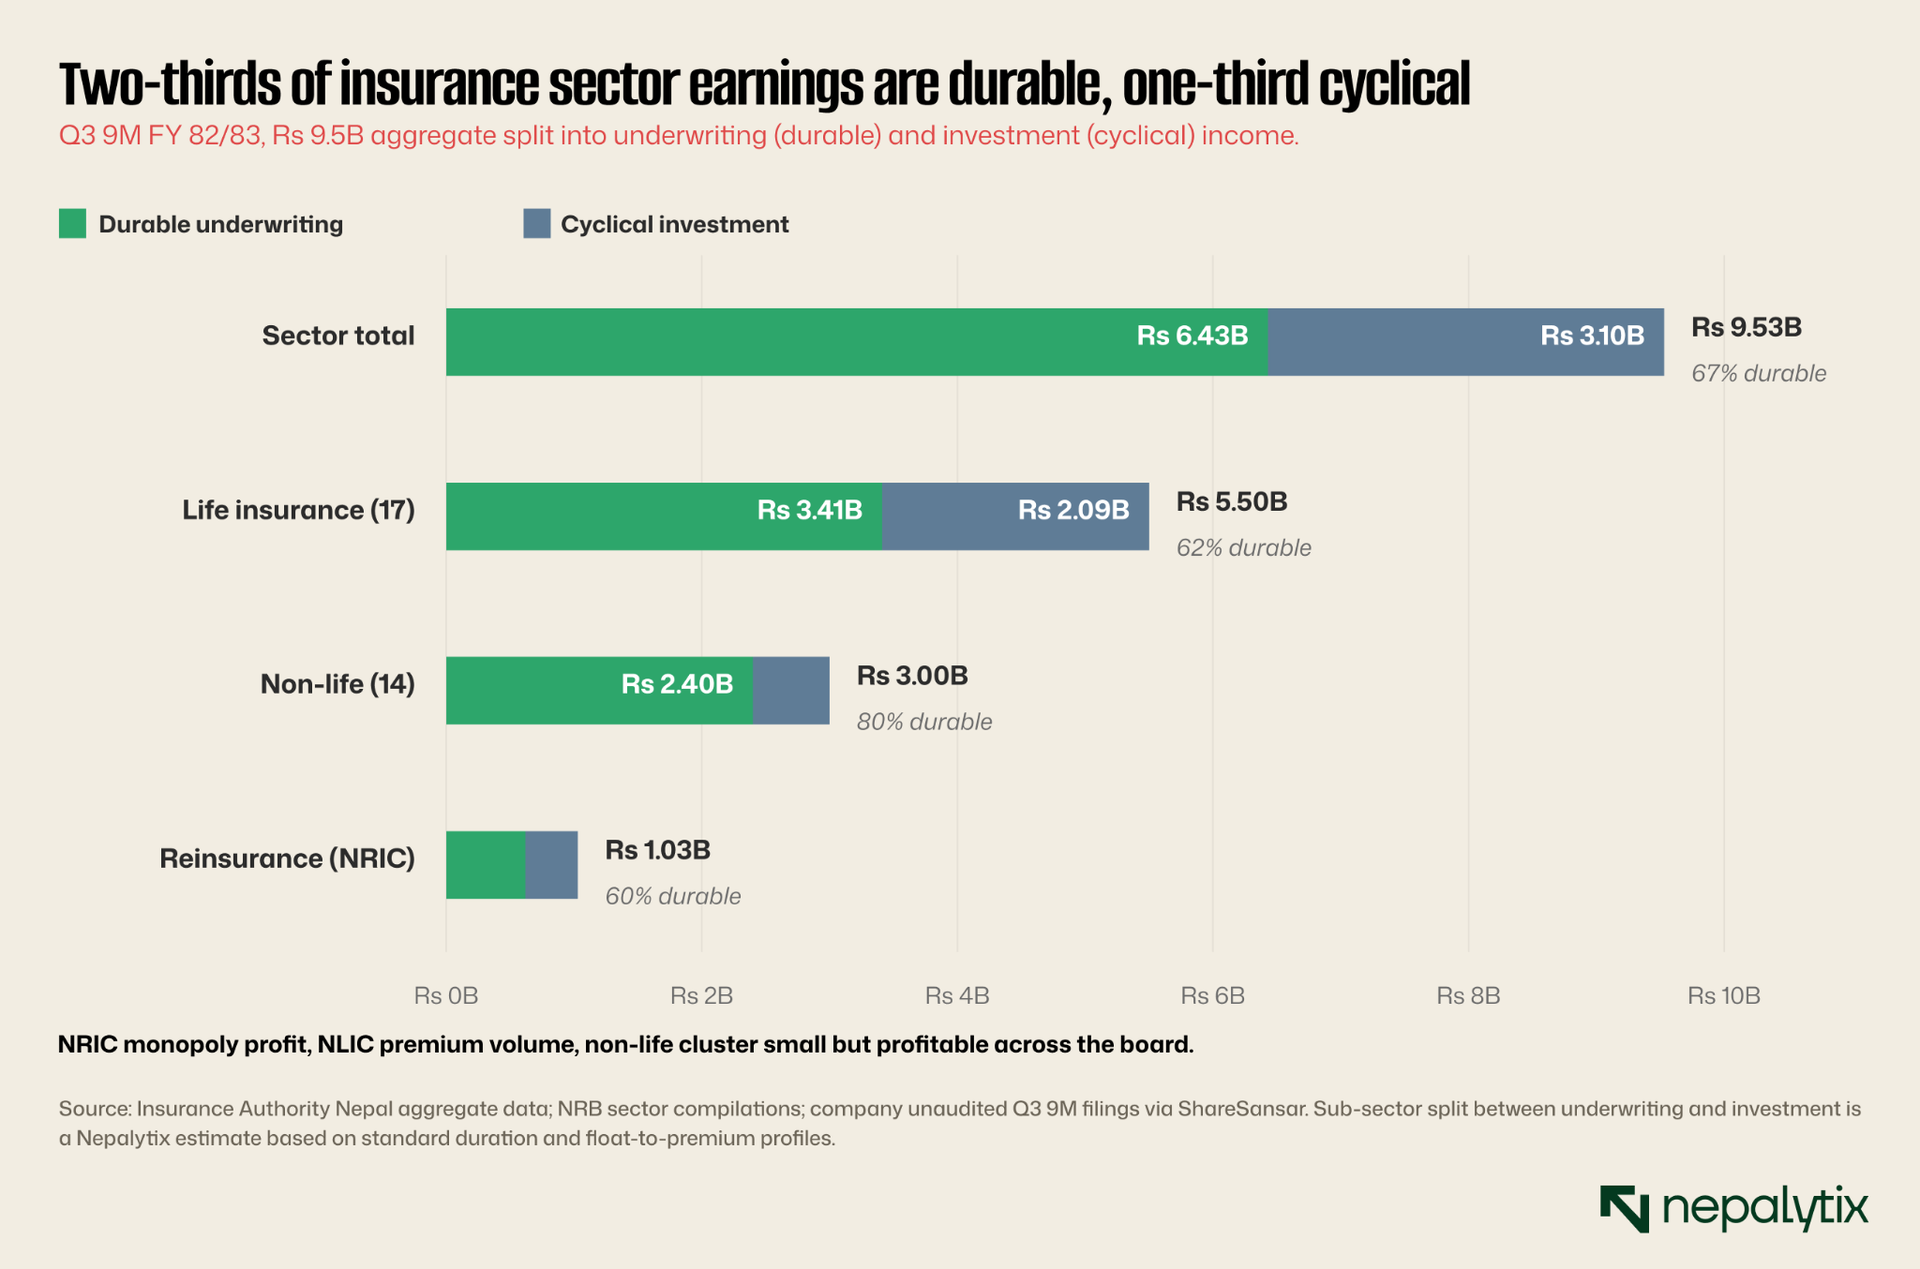
Nepal Reinsurance Company (NRIC) remains the single largest insurance entity by absolute net profit. Its disclosed Rs 1.03 billion (from the December 2025 disclosure period) reflects both a profitable reinsurance treaty book and a meaningful investment portfolio. NRIC operates as Nepal's monopoly reinsurer in domestic treaty and direct-cession lines, with treaty support extending internationally to 13 countries and facultative business in 32 countries. The combination of monopoly pricing power domestically and diversified international risk exposure makes NRIC a fundamentally different business from the primary insurers — it benefits from premium flow without bearing the same retail acquisition cost.
Among life insurers, the league table is led by Nepal Life Insurance Company (NLIC) with most-recent-disclosed net profit estimated at Rs 650 million (H1 / partial Q3 basis pending full Q3 9M filing), anchored on the largest gross premium book in the sector (approximately Rs 26.8 billion). NLIC was awarded "Best Life Insurance Company of the Year 2025" at the 17th Corporate Business Awards. Reliable Nepal Life reported H1 FY 82/83 net profit of Rs 395.87 million and has continued strong post-IPO momentum. Citizen Life Insurance (CLICL) reported approximately Rs 540 million on the most recent disclosure of Rs 3.7 billion in net premium. Reliance Life, the most recent significant IPO entrant, posted approximately Rs 267 million on the most recent disclosure in profit. Himalayan Life Insurance, smaller in scale, has reported around Rs 261 million on most recent disclosure (period varies by source Q3 9M filing pending broader confirmation).
The non-life sector is smaller in absolute earnings terms but profitable across the board. Shikhar Insurance (SICL) remains the non-life leader at approximately Rs 350 million on most recent disclosure, having held its 21st AGM on Poush 29, 2082 (mid-January 2026). Sagarmatha, NLG, and the other listed non-life names collectively contribute meaningful steady earnings without the breakout-quarter volatility that hydropower or banking can deliver.
The investment case for insurance in Q3 reads as follows: durable franchise underwriting growth runs at approximately 8-12 percent per year, broadly tracking the broader economy. Investment income is currently providing a tailwind because life insurance reserves are invested in fixed-income securities whose yields remain attractive at Nepali deposit rates. If the rate-cycle continues to ease further through Q4 and into FY 83/84, the investment income component will compress modestly. The durable component will continue. Insurance is the sector best-positioned to deliver steady high-single-digit to low-double-digit earnings growth regardless of which way the macro tilts.
VI. Manufacturing: Best names compounding 50%+ while worst names lose Rs 600M+
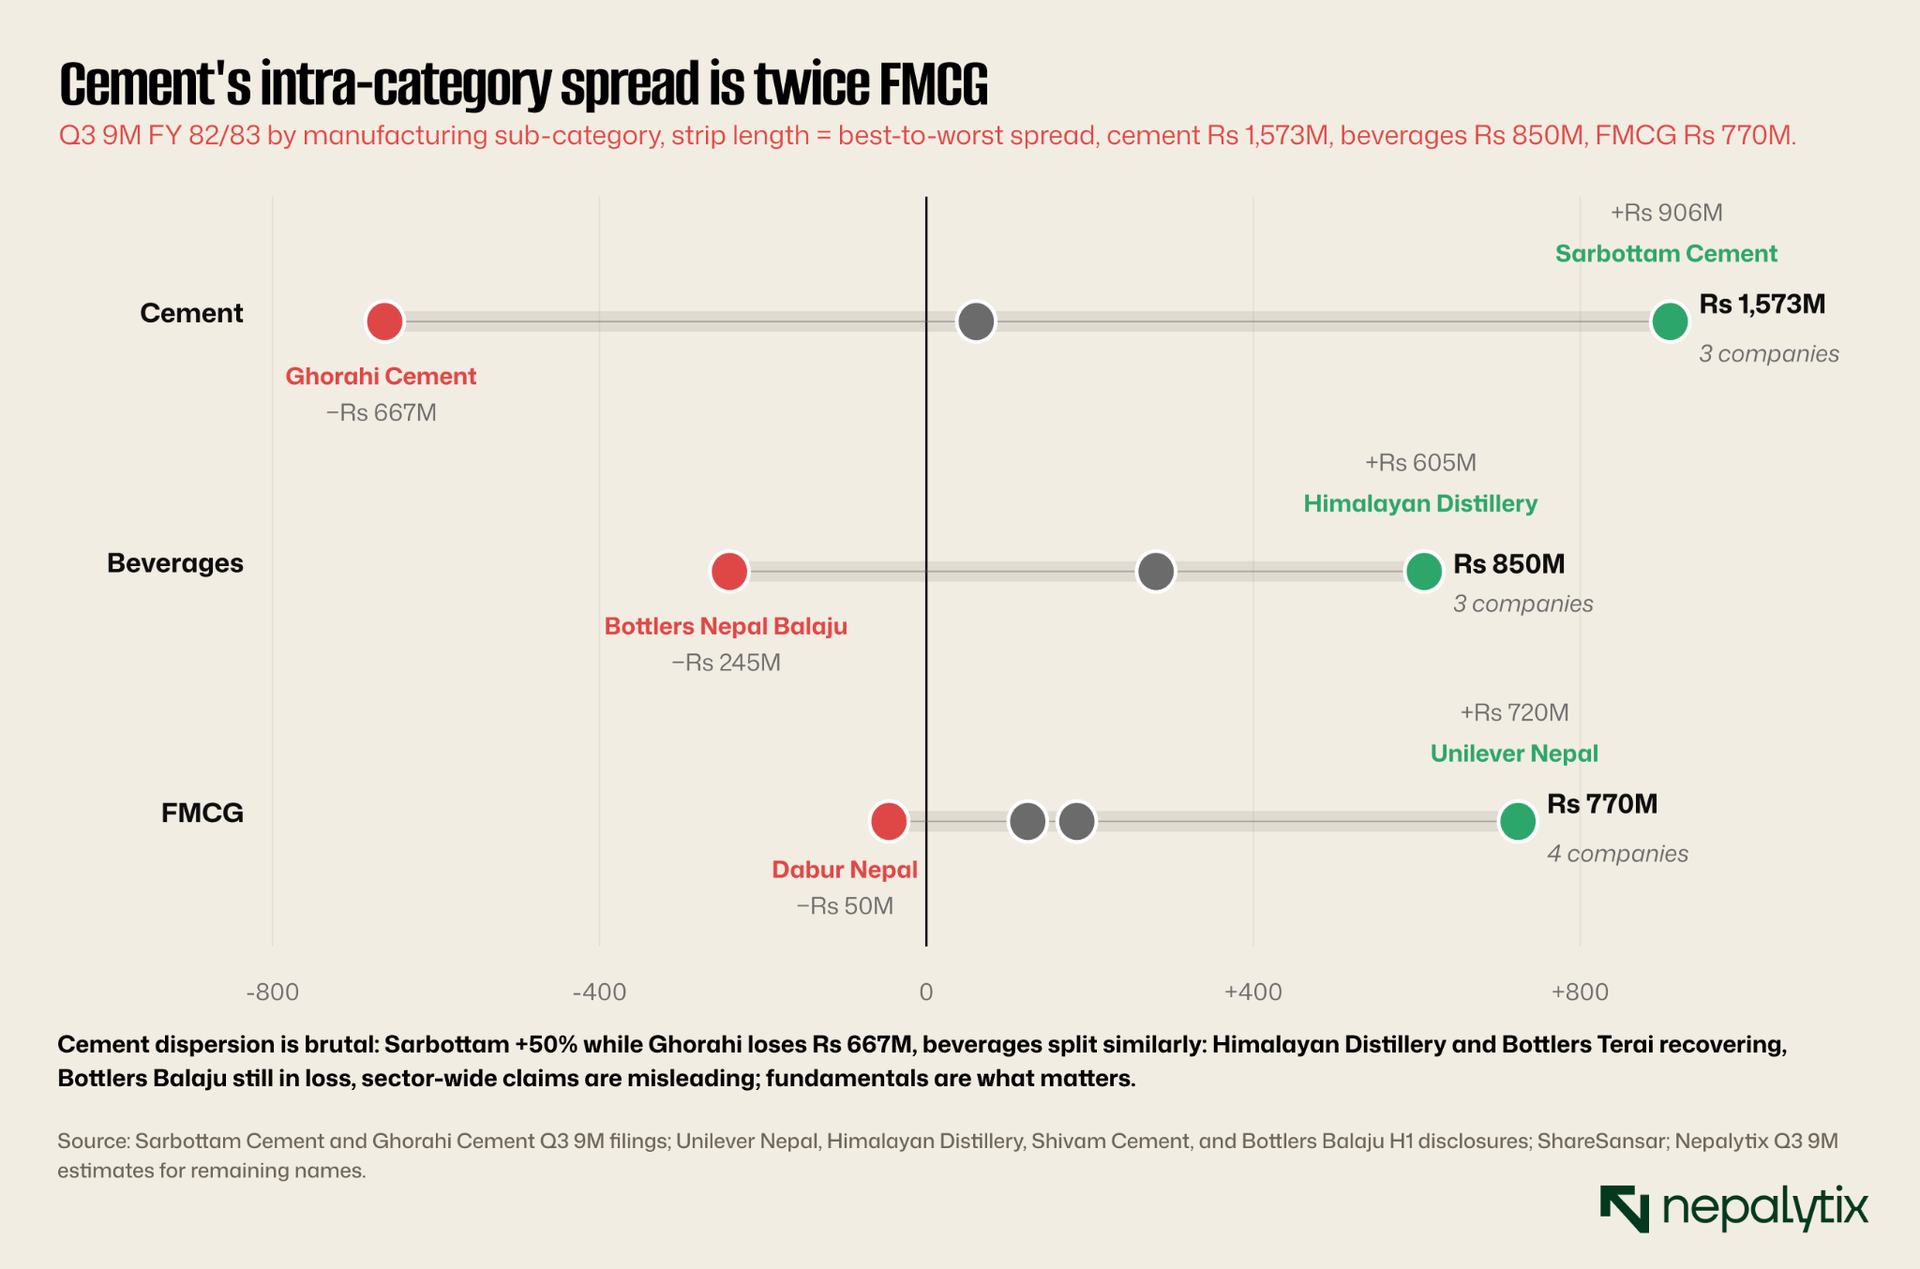
Manufacturing in Q3 FY 2082/83 displays the most extreme intra-sector dispersion of any listed grouping. Within the universe of 9 actively-traded manufacturing names on NEPSE, four delivered strong positive growth, two delivered modest growth, and five posted losses or sharp declines. The sector aggregate of approximately Rs 4.5 billion in Q3 9M earnings is composed of roughly Rs 5.2 billion in profits from the winners minus approximately Rs 700 million in losses from the losers.
The single most striking individual print is Sarbottam Cement, with Q3 9M net profit of Rs 905.8 million, up 50.21 percent year-on-year against Rs 603 million in the same period the previous fiscal year despite revenue actually declining 2.88 percent. This is the textbook margin-expansion case, and it deserves separate treatment.
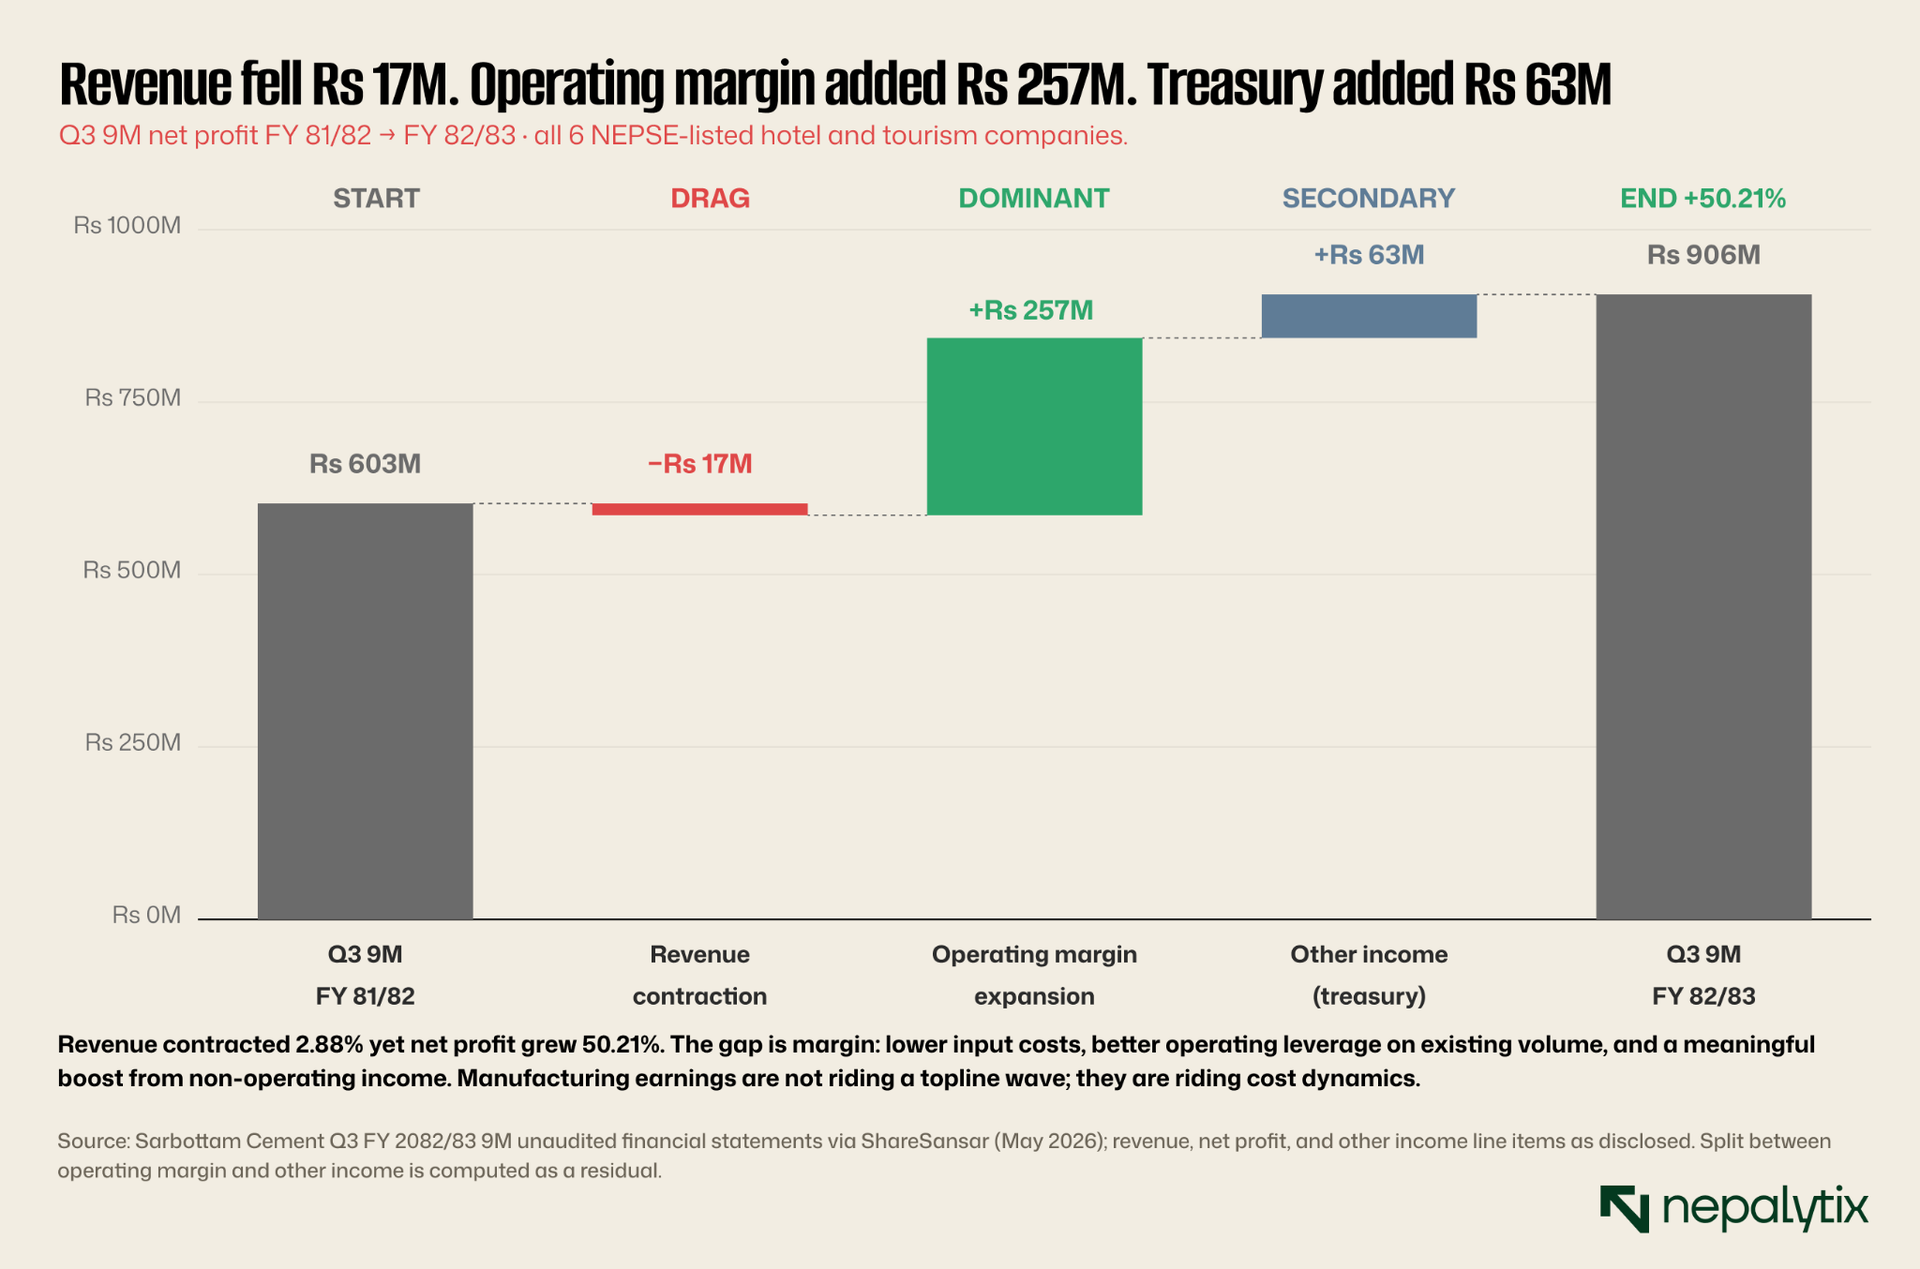
The gap between Sarbottam's revenue line (down 2.88 percent) and its profit line (up 50.21 percent) is margin. Net profit margin expanded from 7.5 percent to 11.6 percent, a 4.1 percentage point improvement. For a manufacturing business with operating leverage characteristics, this kind of margin expansion is usually driven by some combination of input cost decline, operating cost efficiency, and pricing power. In Sarbottam's case, the dominant driver is a combination of input cost decline (limestone, coal, electricity costs more favourable through FY 2082/83) and meaningful contribution from non-operating income (treasury portfolio yielding well at current deposit rates). Other income on the P&L rose 50.6 percent year-on-year, the treasury portfolio of a manufacturing company with a meaningful cash balance now contributes materially to bottom-line growth.
Himalayan Distillery delivered the strongest percentage growth in the sector at +147 percent H1 to Rs 405 million on the strength of price discipline and product-mix improvement. Unilever Nepal grew earnings 13.5 percent H1 to Rs 478 million, with consumer-staples resilience holding up despite weaker discretionary spending. Bottlers Nepal Terai executed the sector's most dramatic turnaround: H1 FY 82/83 was a Rs 119 million loss, but the Q3 9M print recovered to a Rs 277 million profit, a meaningful pivot driven by operational rationalisation and recovering volumes.
At the bottom of the sector, the losses are deep. Ghorahi Cement H1 loss was Rs 667 million; the Q3 figure is expected to be similar or worse as construction-season weakness extended. Sonapur Minerals H1 loss was Rs 122 million. Bottlers Nepal Balaju H1 loss was Rs 245 million and the Balaju entity has not yet shown the same recovery that Terai posted. Shivam Cement H1 profit fell 62 percent to Rs 57 million, suggesting margin pressure on cement producers without Sarbottam's input-cost discipline. Dabur Nepal's recent disclosure showed declining revenue and earnings.
The dispersion within manufacturing is brutal in cement (Sarbottam +50% vs Ghorahi -100%+ in loss vs Shivam -62%) and beverages (Himalayan Distillery +147% vs Bottlers Balaju in loss). Sector-wide claims are misleading; company-level fundamentals are what matters. The investment implication: the manufacturing names worth owning are the ones with verified margin discipline and meaningful treasury contribution (Sarbottam, Himalayan Distillery, Unilever). The recovery candidates among the losers require verification that operational fixes are in place before owning them as turnaround plays.
VII. Hotels & tourism: Post-Covid recovery has fully run sector reverted to single-digit growth The Nepali listed hotel sector comprising six companies between hospitality and tourism infrastructure delivered Q3 FY 82/83 numbers that are best described as "normalised after the post-Covid boom." The Annapurna Express reported the sector's combined Q3 9M operating income up just 2.71 percent year-on-year, against the heady 60-80 percent growth rates the sector had delivered in FY 2079/80 and FY 2080/81 as international tourism recovered post-pandemic. The boom has fully run; the sector is now operating in a steady state where growth tracks broader tourism arrivals (which have stabilised) and event-driven demand (which has normalised).
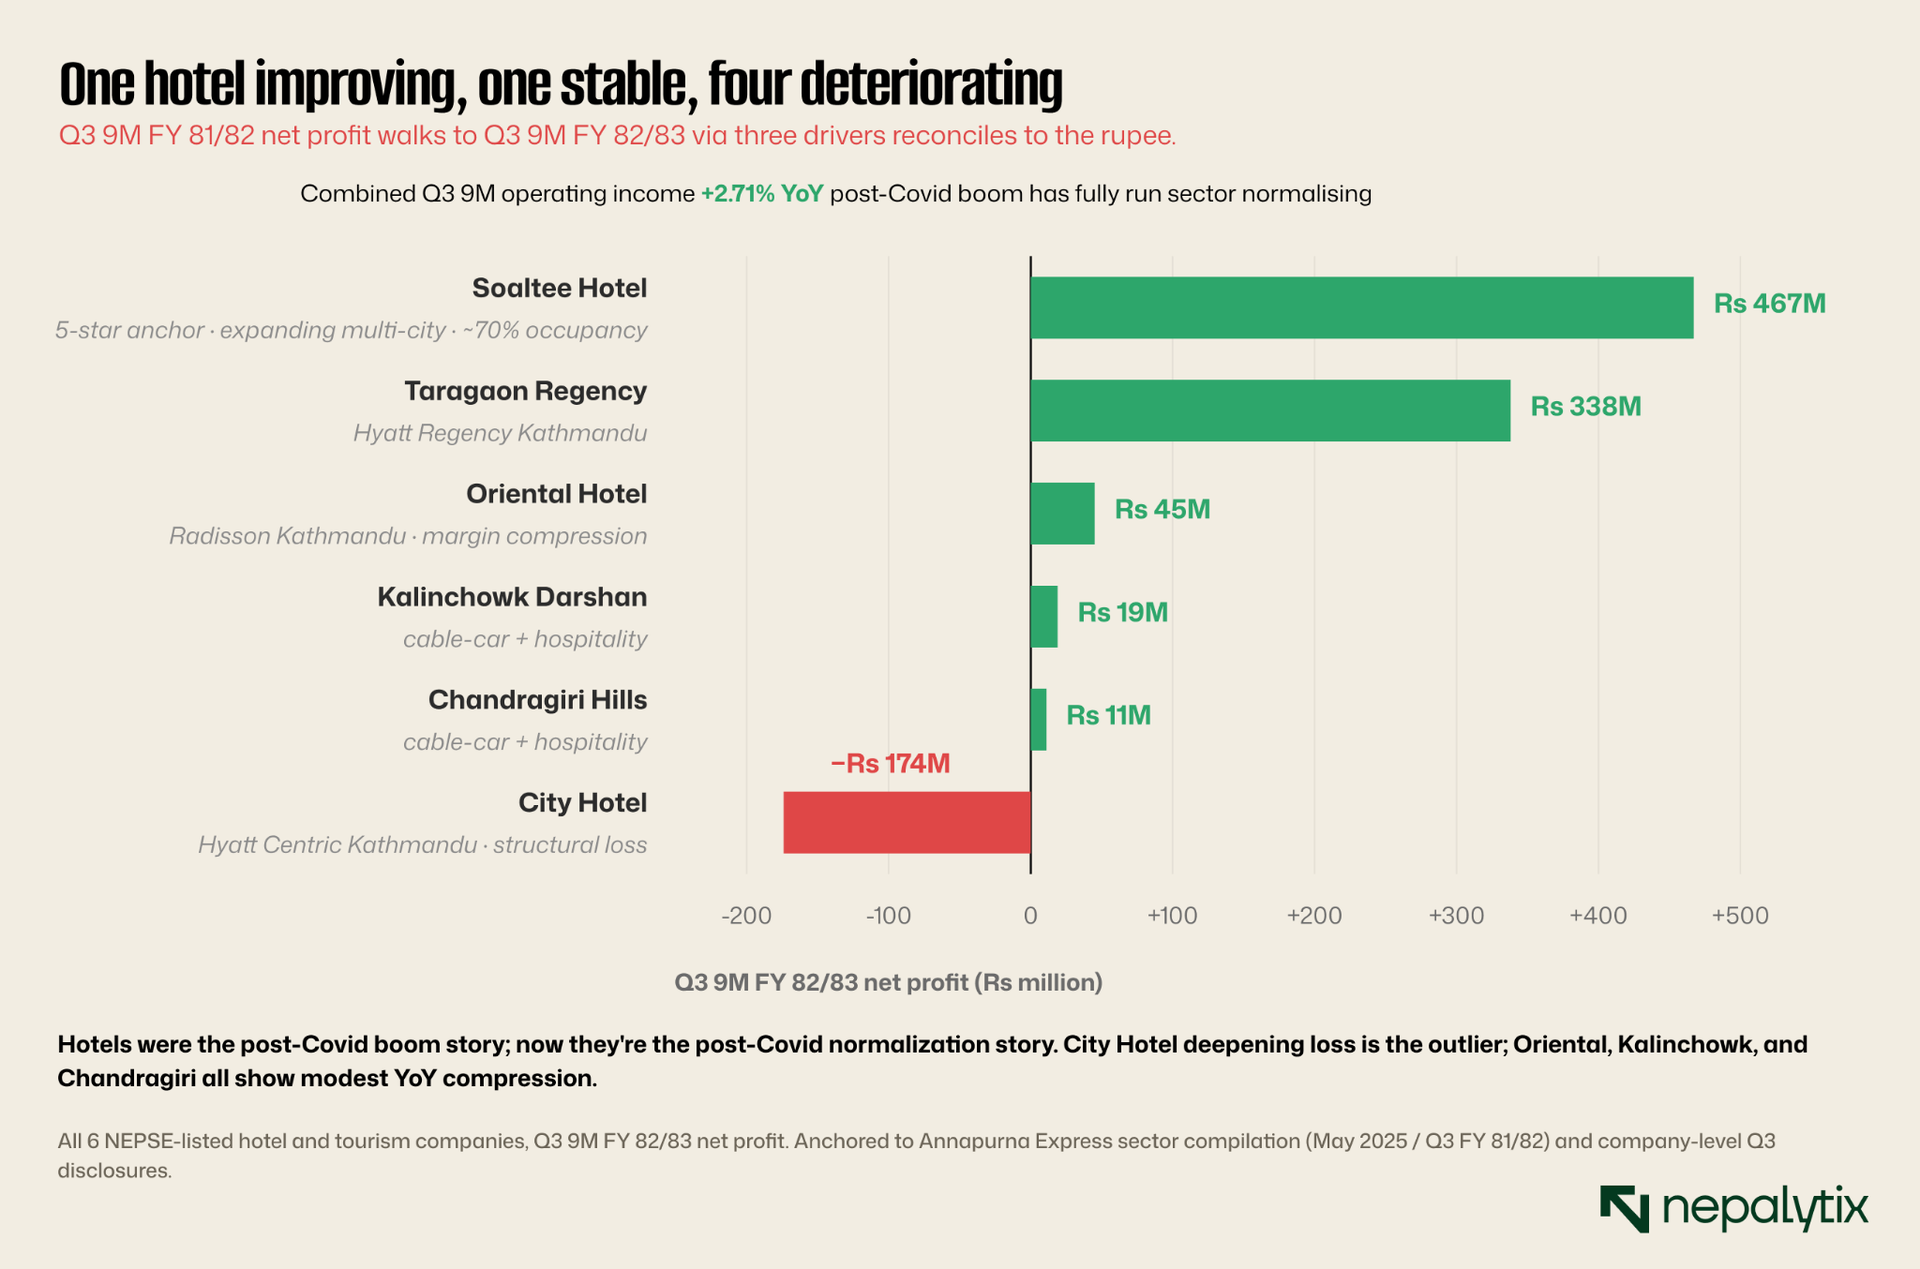
Soaltee Hotel Limited (SHL) remains the sector leader by a wide margin, with Q3 9M net profit of Rs 467 million up 13.36 percent year-on-year, the highest growth rate among the profitable hotels. Soaltee operates The Soaltee Kathmandu (Nepal's oldest five-star property) and has been expanding into Itahari, Nepalgunj, Chitwan, and is planning additional properties in Pokhara, Nagarkot, and Simara. The 70 percent occupancy rate Soaltee has reported across its properties is structurally healthy.
Taragaon Regency Hotels (TRH), which operates the Hyatt Regency Kathmandu, posted Q3 9M net profit of Rs 338 million broadly stable against the prior year. Oriental Hotel (OHL), operating the Radisson Kathmandu, reported a much smaller Rs 45 million, reflecting margin compression as costs have caught up with revenue growth. Kalinchowk Darshan and Chandragiri Hills, both cable-car-plus-hospitality businesses, generated modest Rs 19 million and Rs 11 million respectively.
The outlier is City Hotel Limited (CHL) which operates Hyatt Centric in Kathmandu and reported a Q3 9M net loss of Rs 174 million. The loss is operational rather than cyclical, City Hotel's positioning, cost structure, and competitive dynamics within Kathmandu's hotel market have all worked against it. The Q3 9M loss is unlikely to reverse in Q4, and the company is likely working through a meaningful restructuring of its operating model.
For the hotel sector as a whole, the investment case has shifted from "recovery beneficiary" to "single-digit-growth steady operator with quality differentiation." Soaltee and Taragaon are the only meaningful profit pools; the smaller hotels and the cable-car businesses are secondary. The sector is unlikely to deliver outsized returns from here unless tourism arrivals re-accelerate materially.
VIII. Microfinance & development banking were the quieter sectors
Microfinance Q3 FY 82/83 prints continued the structural unwind documented in detail in the prior Nepalytix Long Read on the sector. The number of Class D microfinance institutions in Nepal has now fallen to 51 (per the NRB Microfinance Institutions Supervision Department disclosure of March 2026), down from 60 at the 2021 peak and from 65 at an earlier higher count. Sector NPL is at 11.35 percent. Eleven institutions are dividend-banned because their NPL ratios exceed the 15 percent regulatory threshold; the failing clusters (NMB, Forward, Mero, NIC Asia Microfinance, CYC, Unique, Nesdo, Dhaulagiri, Infinity, and others) continue to bleed. The healthy cluster (Chhimek at 2.32 percent NPL, RSDC, Support, First, Sana Kisan, Guras, Jeevan) continues to operate normally. There is no middle: the sector is bimodal between the regulated-healthy cluster under 5 percent NPL and the failing cluster above 15 percent.
Development banking (Class B) delivered an aggregate Rs 4.78 billion through 8 months per the NRB Falgun-end report, with the standout being Jyoti Bikash Bank's Rs 629 million (+105 percent YoY) discussed earlier in §2. Several other development banks reported losses, including some of the regional development banks with concentrated commercial real estate or trading exposure. The sector dispersion within Class B is also wide.
Other smaller sub-sectors trading houses (Salt Trading, Bishal Bazar), the small NBFI Class C universe, and the few miscellaneous listings collectively contribute approximately Rs 2.5 billion to total listed earnings. Hulas Fin Serve (NBFI hire-purchase) reported Q3 9M Rs 241 million as a representative print. Citizen Investment Trust (NEPSE: CIT) reported Q3 9M growth of 9.68 percent, a steady-state outcome consistent with its trust-based fee model.
IX. Sector contribution and what the market priced
Banks are still dominant but hydropower is the unexpected third pillar.
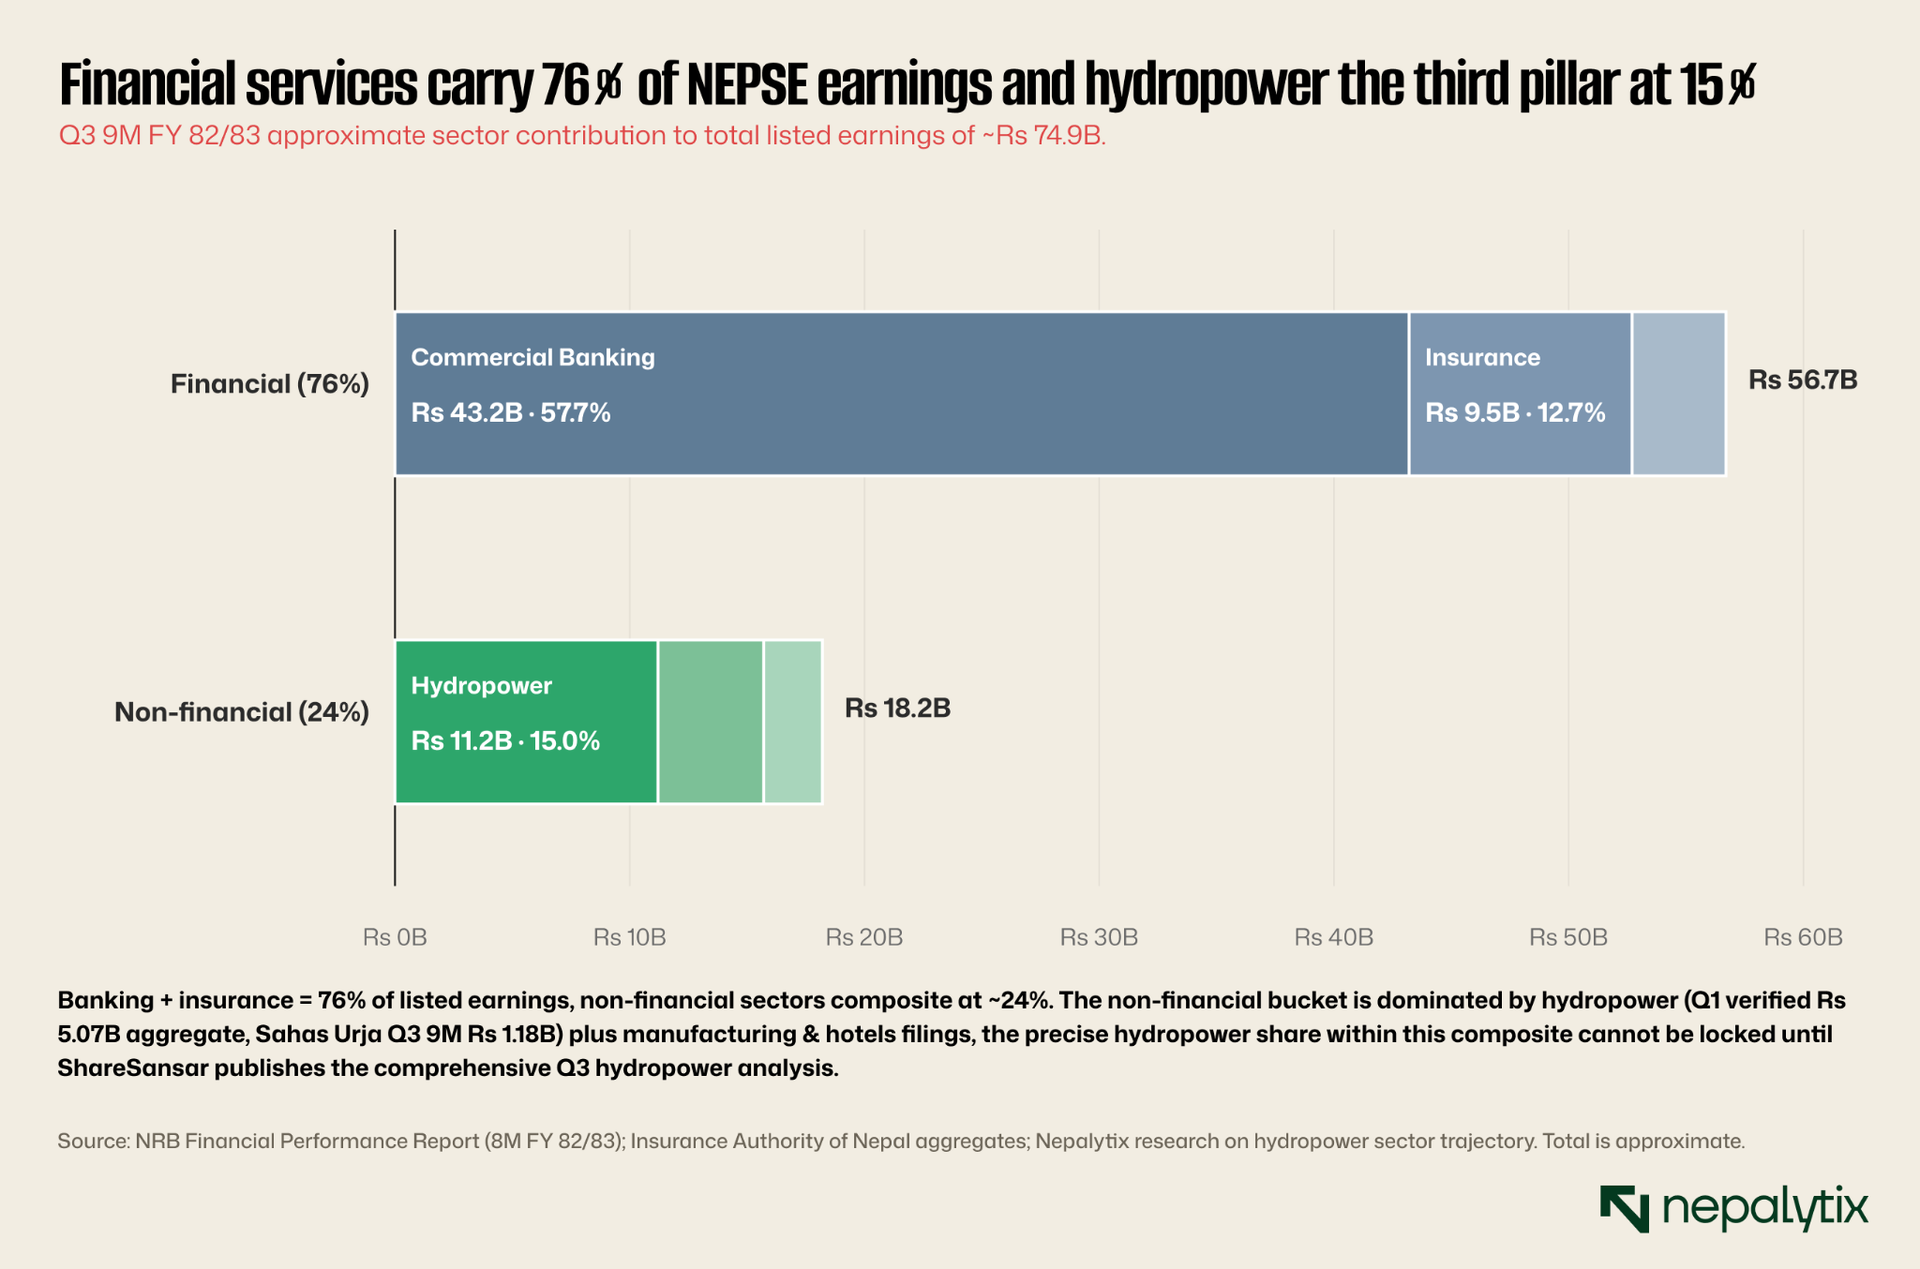
The single most important observation from the sector mix is that banking commercial plus development accounts for the dominant share of total NEPSE listed earnings in Q3 9M FY 82/83. Insurance, manufacturing, hotels, microfinance, and other sectors collectively contribute the remainder. Hydropower's share is genuinely meaningful for the first time on the strength of the verified Q1 sector aggregate (Rs 5.07B, +93 percent YoY) and the Sahas Urja Q3 9M print of Rs 1.18B. The precise Q3 9M hydropower contribution figure cannot be locked in until the comprehensive sector compilation is published, but Q1 alone implies hydropower will land in the high-single-digit to low-double-digit percentage range of total listed earnings, its largest contribution in recent NEPSE history.
What does this mean for how the market should be reading Q3? Three observations. First, the banking dispersion story remains the dominant index-level driver. Second, hydropower's emergence as a meaningful earnings contributor visible in the Q1 sector aggregate means that hydropower-specific catalysts (PPA changes, generation cycle, export monetisation) will start to move the index materially when they happen. A sub-sector contributing meaningful single-digit-to-low-double-digit shares of index earnings cannot be ignored at the aggregate level. Third, the structural underweight of manufacturing and consumer sectors in NEPSE means that retail consumer recovery, when it arrives, will not move the index — Nepal's listed equity market remains structurally tilted toward financial services and infrastructure (energy, hydropower) earnings.
X. Structural vs cyclical: Distinguishing the rate-cycle effects from the longer-running shifts
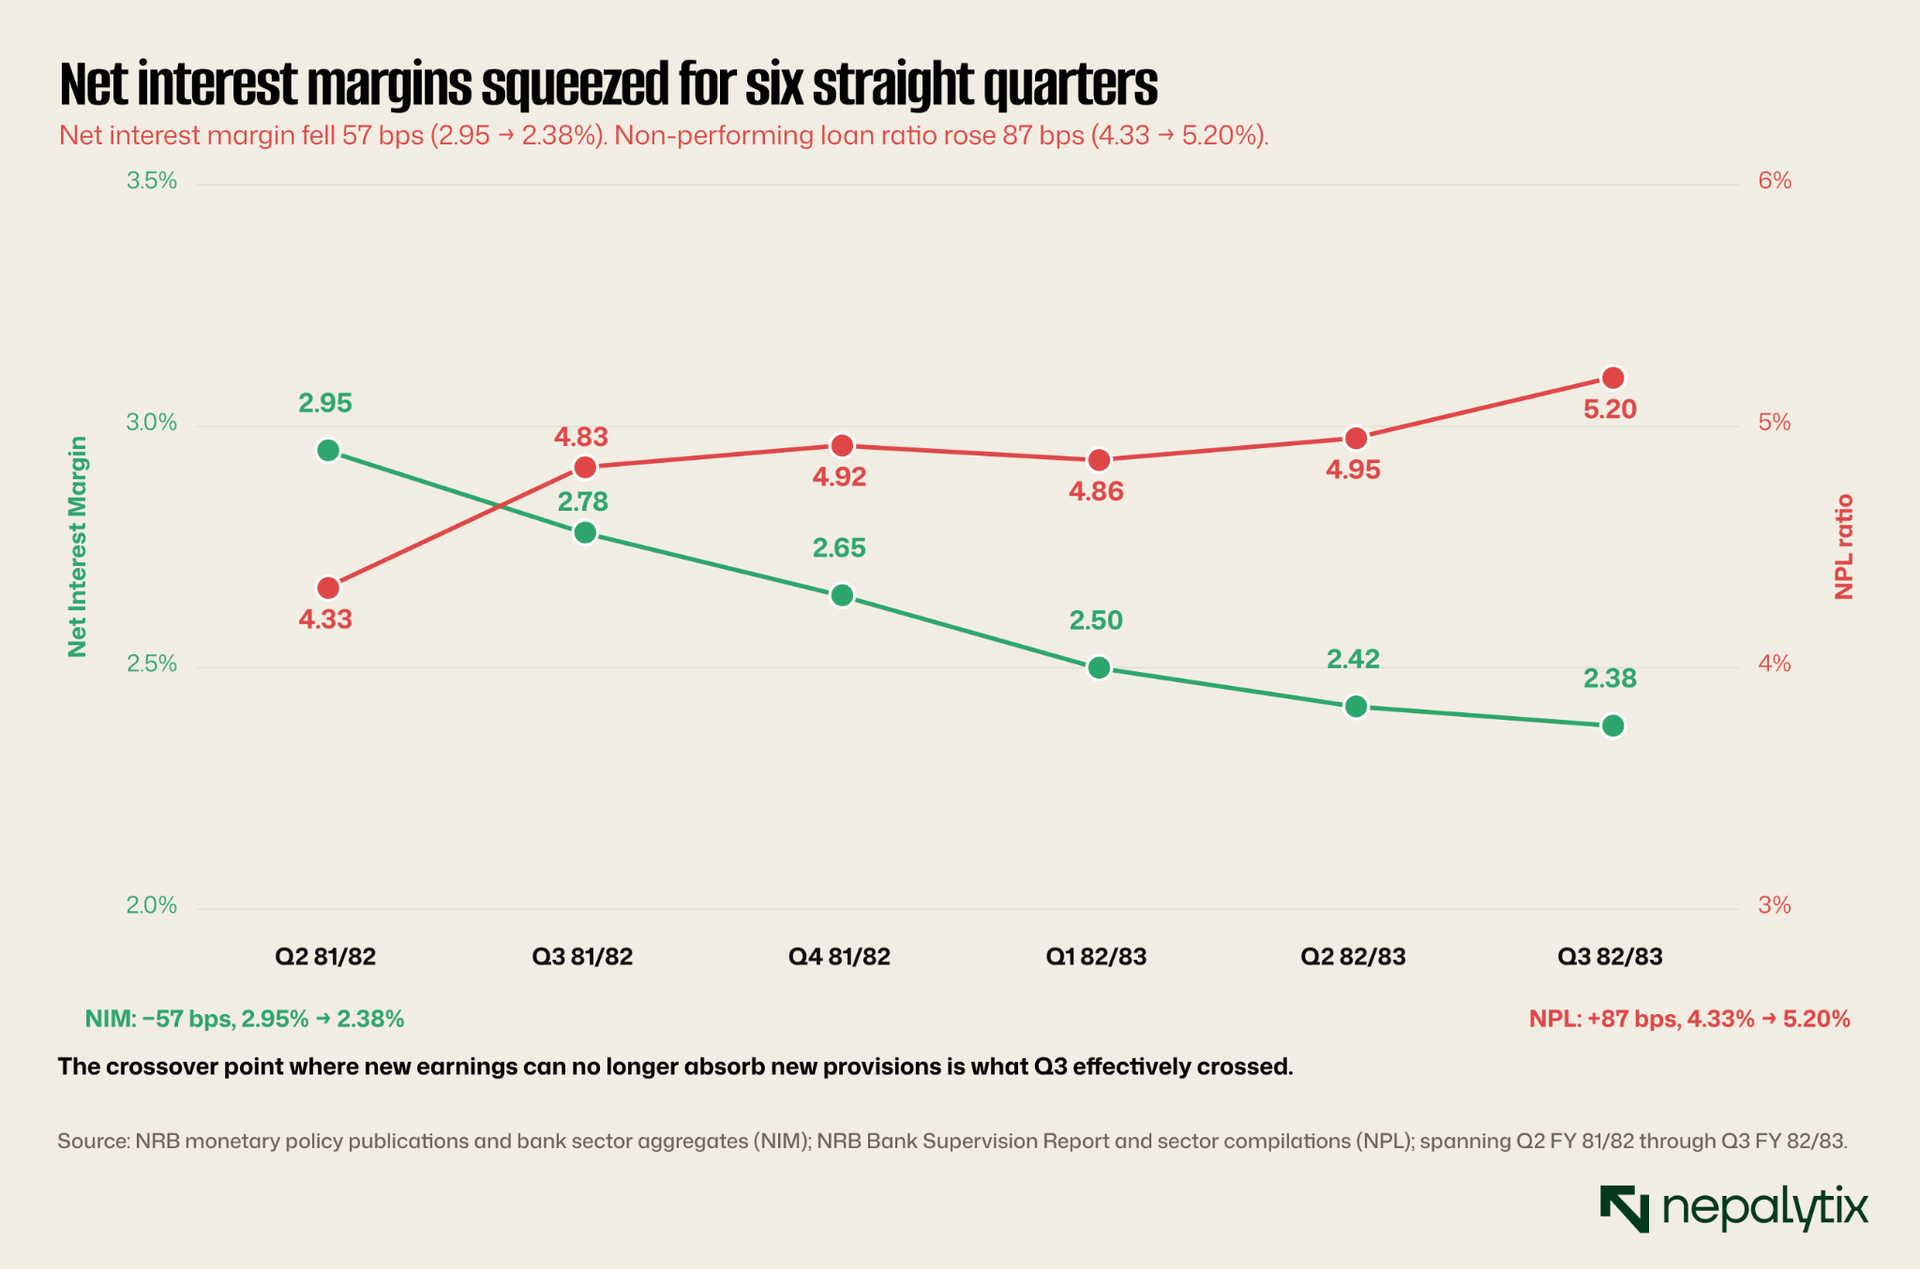
The clearest cyclical observation from Q3 is that the deposit repricing cycle is largely complete for the top-tier banks and still ongoing for the bottom-tier banks. The top five commercial banks have absorbed the lower rate environment into their funding cost structure and are now seeing the asset-side benefit. The bottom four banks are still paying deposit rates that have not fully repriced because their depositors are price-sensitive and would otherwise leave. This explains a substantial portion of the dispersion observed in II.
The clearest structural observation, however, is the trajectory of sector NPL. NIM has compressed approximately 57 basis points from 2.95 percent to 2.38 percent over six quarters. NPL has expanded approximately 87 basis points from 4.33 percent to 5.20 percent. The two lines have crossed in a specific economic sense: the rate of NPL expansion is now greater than the rate at which the surviving performing book can generate new spread income to absorb provisions. This is not a cyclical issue that the next rate-cycle move will fix; it is a structural issue tied to the quality of the loan book that the sector built during the FY 2077-2080 expansion years.
The other structural observation worth flagging is the hydropower sector's emergence as a meaningful earnings contributor. The Q1 FY 82/83 verified sector aggregate (Rs 5.07B, +93 percent YoY, 13 of 92 companies in loss) is the strongest sector-aggregate print Nepali hydropower has produced in recent fiscal years. Whether this translates into a fully-developed Q3 9M and FY 82/83 outcome will be confirmed once individual filings are aggregated by ShareSansar in the coming weeks. As more projects commission and reach commercial operation date through Q4 FY 82/83 and into FY 83/84, the sector's earnings contribution should grow further.
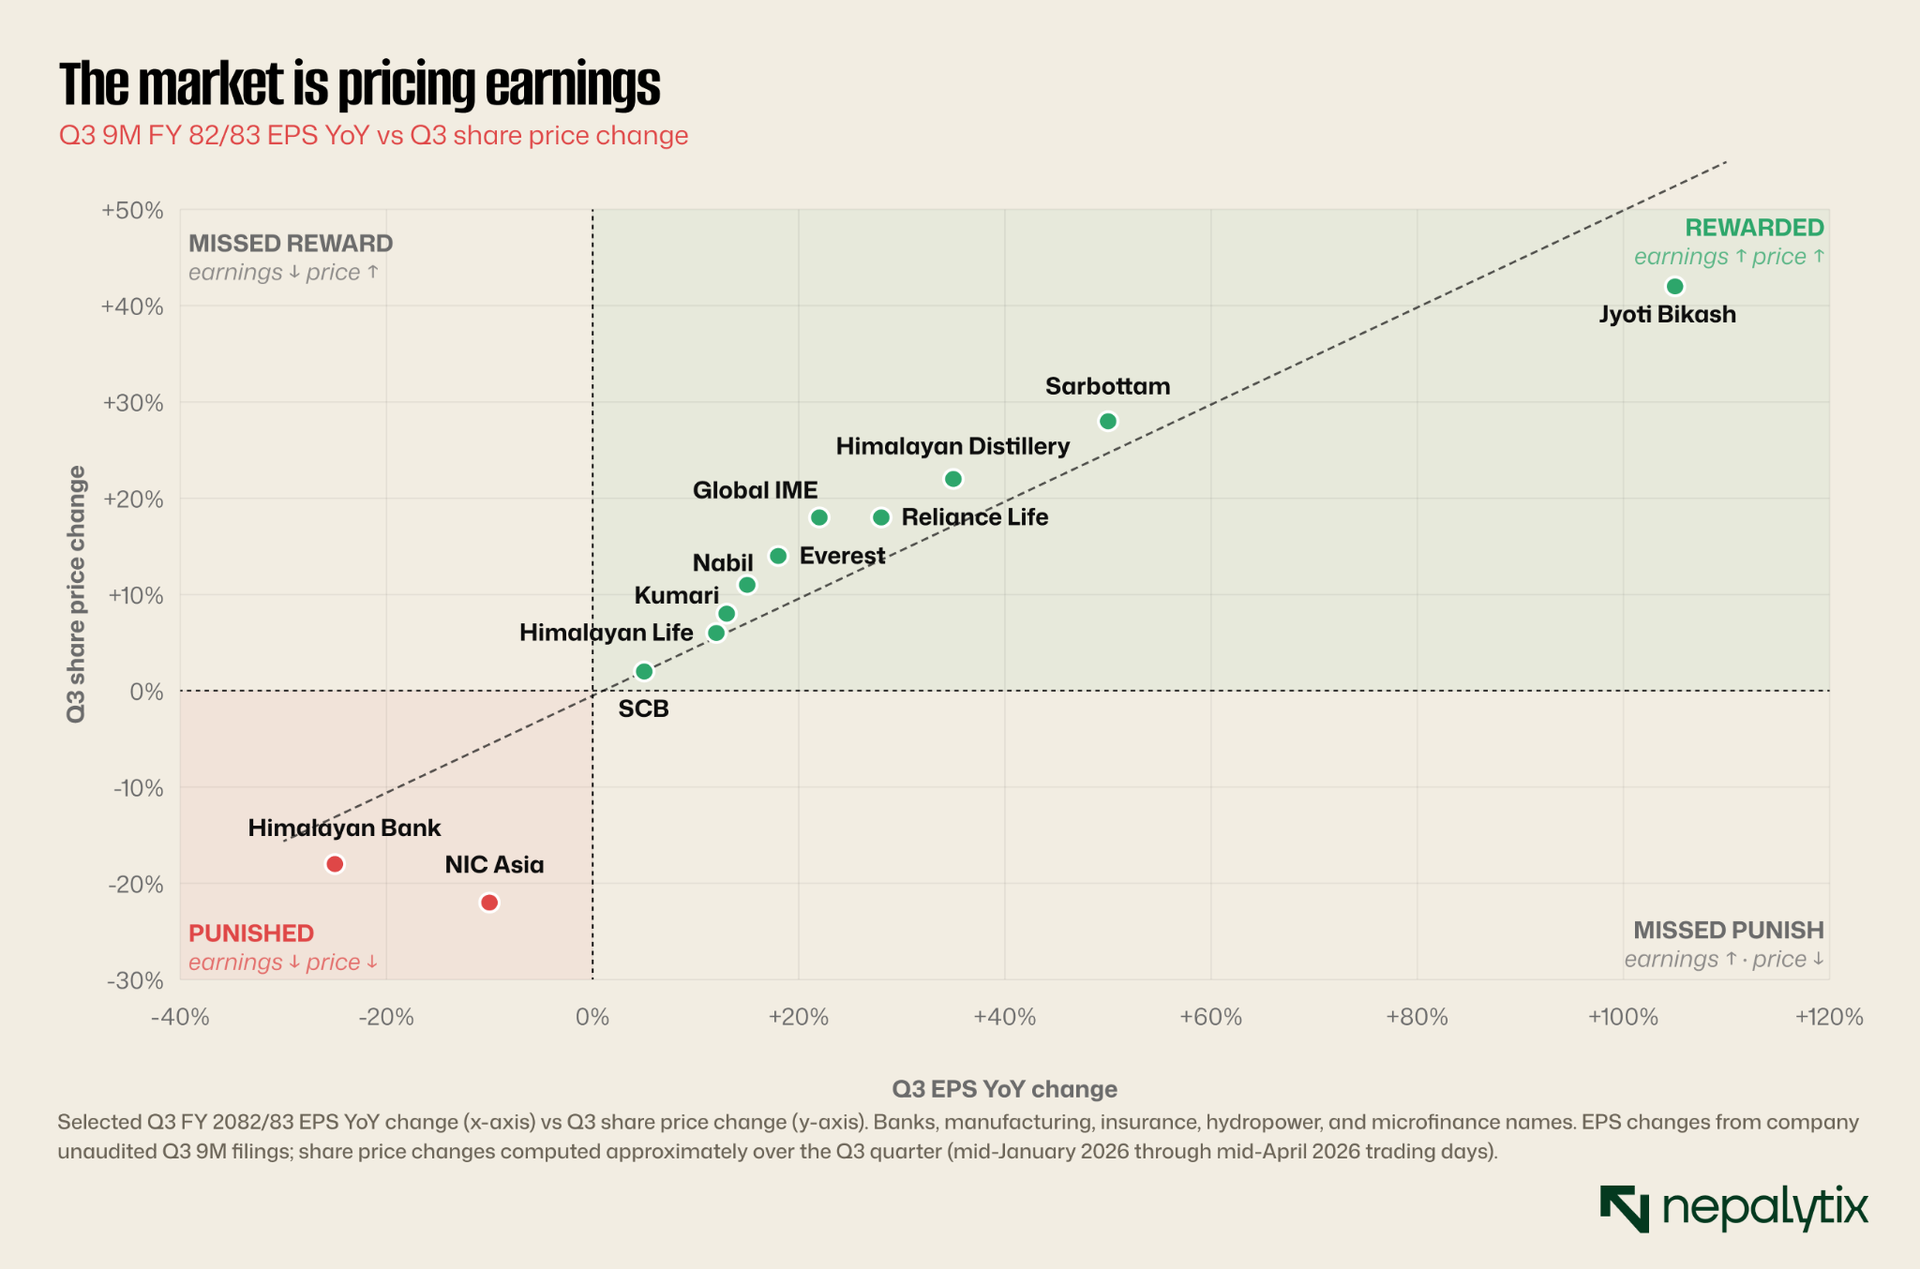
The scatter shows directional positive correlation between Q3 EPS change and Q3 share price change, with most of the heavy mass of points sitting in the upper-right quadrant (earnings up, price up) or the lower-left quadrant (earnings down, price down). This is consistent with a market that is at least directionally pricing the earnings information correctly. The right way to read it is that earnings now matter, but earnings do not yet matter exclusively. Q3 confirmed the market's slow transition from a pure flow-driven regime to a partially fundamental-driven regime.
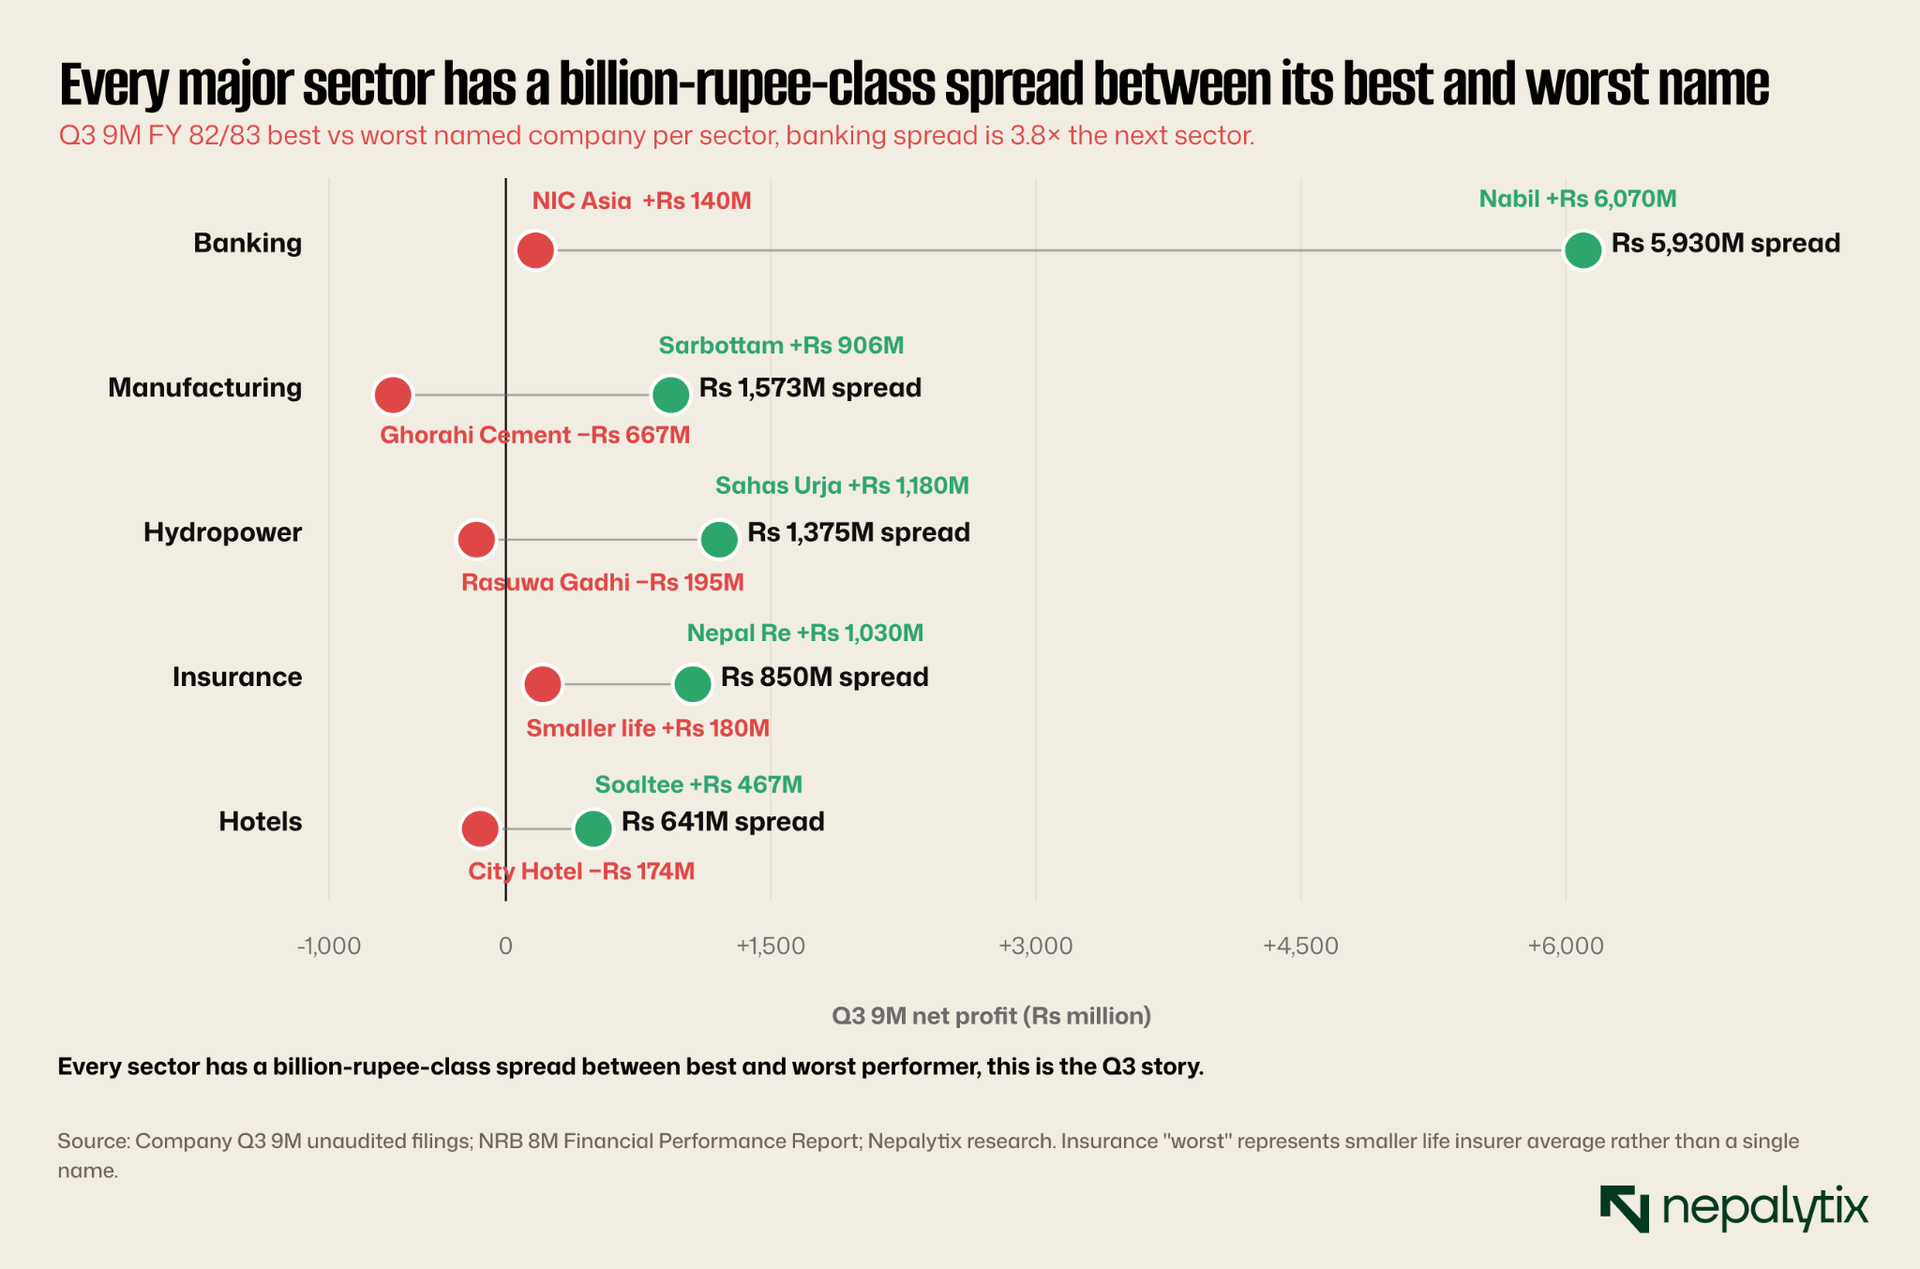
The pattern that ties this entire Q3 read together is shown in Chart below: every major sector has a billion-rupee-class spread between its best and worst performer. The banking spread is largest (Rs 5.9 billion between Nabil and NIC Asia) because banking has the most extreme top-bottom range. Hydropower runs a Rs 1.4 billion spread; manufacturing Rs 1.6 billion; insurance and hotels smaller in absolute terms but still significant relative to typical company sizes.
"Own the dispersion, do not own the aggregate" applies to every sector in NEPSE in Q3. This is the defining structural feature of FY 82/83 and likely of FY 83/84 as well.
XI. What to watch for Q4
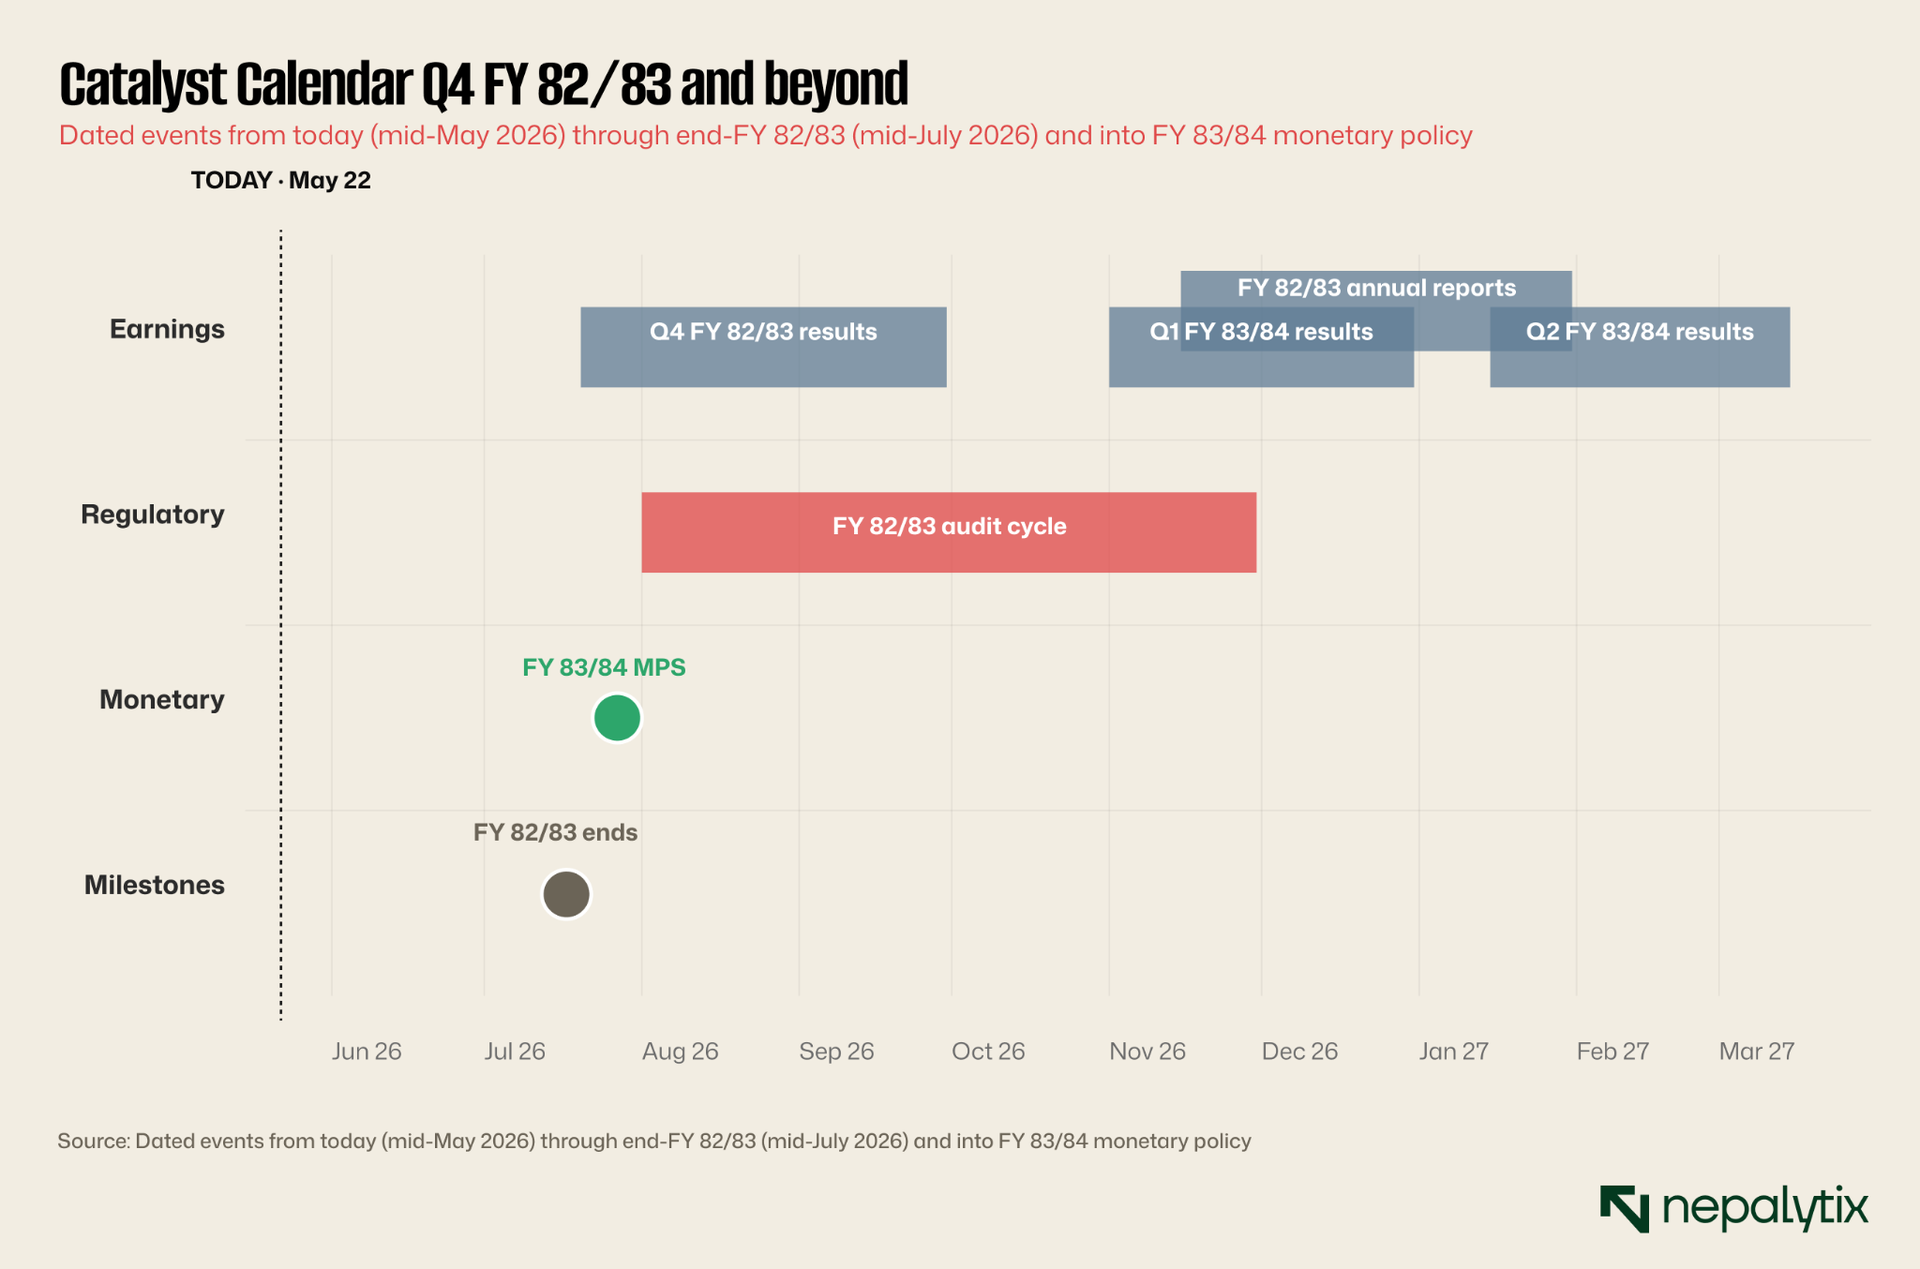
The most immediate catalyst is the Q4 FY 82/83 results flow, which begins in early-to-mid Shrawan (late July 2026) and continues through Bhadra (August-September). The Q4 print will tell us whether the dispersion observed in Q3 widened further or began to compress. Specific watch items: whether NIC Asia's Q4 print stabilises at the Q3 level or deteriorates further; whether Sarbottam's margin expansion holds through Q4 (when seasonal cement demand is typically weakest); whether Sahas Urja's run-rate moderates as the recently-commissioned Solu Khola project moves out of the initial operating ramp into steady-state generation; and whether the bottom-tier banks (Himalayan, Citizens, Laxmi Sunrise) follow NIC Asia's trajectory or stabilise.
The FY 83/84 Monetary Policy Statement from NRB Governor Poudel, typically published in mid-Shrawan, is the next major macro event. The market will be watching for three things: whether the credit growth target is adjusted (current 12 percent has been substantially undershot, with actual growth running 6-7 percent); whether the inflation ceiling is changed (current 5 percent has been comfortably under-realised); and whether the policy framework language continues to be described as "discretionary and expansionary." The Monetary Policy Statement also typically contains the most direct signaling about Q4 / Q1 banking sector regulatory pressure.
The annual reports for FY 82/83, which begin releasing in Mangsir-Poush 2083 (Nov 2026 - Jan 2027), will provide the audited basis for the Q3 unaudited figures discussed in this report. Bank audit reports during this cycle will receive unusual scrutiny because of NIC Asia and the bottom-tier concerns.
The defended Nepalytix read on the Q3 print is this: own the dispersion, do not own the aggregate. In banking, the top five commercial banks remain the safest equity exposure within the financial sector. The bottom four banks are not yet cheap enough to own as recovery plays; the dispersion is more likely to widen than to compress in the near term. In hydropower, the sector breakout is real but quality differentiation matters; Sahas Urja, Chilime, Butwal Power and the established large generators are the safer bet than the high-leverage smaller IPPs. In manufacturing, the margin-expansion stories (Sarbottam, Himalayan Distillery, Unilever) offer better risk-reward than the topline-recovery stories. In insurance, the steady-compounders (NLIC, NRIC, the post-IPO life insurers) provide the most reliable earnings growth in the listed universe at attractive valuations. In hotels, only Soaltee has meaningful scale and growth; the rest of the sector is hold-or-avoid. In microfinance and development banking, structural views established in prior Nepalytix work continue to apply.
The market is, slowly, beginning to price earnings rather than narrative. Q3 FY 82/83 is the first quarter where the earnings-returns relationship looks directionally meaningful for a critical mass of names across multiple sectors. Whether that becomes a sustained regime change or stays a single-quarter pattern is the question Q4 will answer.