Pure Energy Limited: Solar Infrastructure, Leverage, and the 2028 Supply Overhang
Pure Energy Limited (PURE) has quickly become one of the most debated renewable energy stocks on NEPSE. Backed by the Golyan Group and REnergo Developers, the company operates a 20 MW solar plant in Banke while holding optional exposure to a 100 MW solar pipeline.

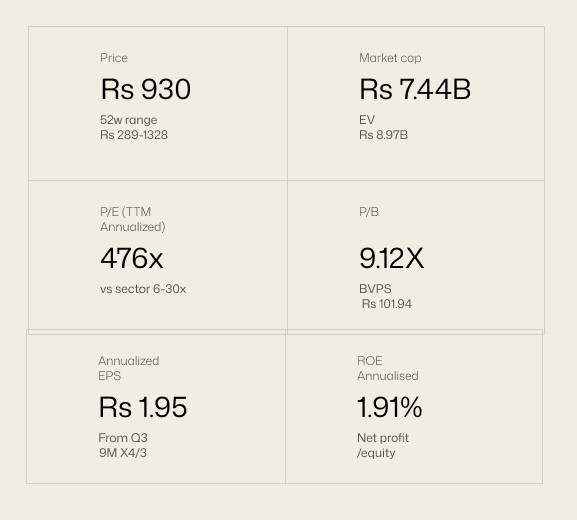
Pure Energy Limited (PURE) is a joint venture between the Golyan Group (Nepali industrial conglomerate) and REnergo Developers (Delhi-based solar EPC firm, 200+ MW commissioned) operating a 20 MW solar facility in Banke and holding a 26% stake in Solar Power Ltd, a five-project 100 MW pipeline that has signed PPAs but not yet broken ground. Annual revenue FY 2081/82 was NPR 259 million on audited financials. The stock settled at Rs 930 in its first year on NEPSE after trading between Rs 289 and Rs 1,328 in a 4.6× range. This piece works through the company's actual operating reality, the Golyan Group context, the unit economics under the regulatory tariff regime, the NEA counterparty situation, peer comparables among listed Nepali IPPs, dated catalysts to the April 2028 promoter unlock and a defended view at the end.
Pure Energy Limited today is a single-asset listed company jointly promoted by Nepal's third-generation Golyan Group conglomerate and REnergo Developers Pvt Ltd, an Indian-headquartered solar EPC firm founded in 2013 with regional offices in Delhi and Kathmandu. The Golyan Group brought the capital and group-standing; REnergo brought the technical execution capability and acted as EPC contractor on the Banke build. Per the CARE Ratings Nepal credit report (September 2023), Akshay Golyan personally held a 60% stake in PEL as of mid-July 2023 with remaining promoter shares distributed across individual Golyan-related and REnergo-related entities. The day-to-day management of PEL is run by CEO Parwin Aryal who concurrently holds the CEO title of Golyan Group's broader energy business, signaling the operational alignment between PURE and the parent group's other renewable-energy projects. The Golyan Group itself is a $400 million annual-turnover business with sixteen companies spanning textiles (Reliance Spinning Mills, Nepal's largest yarn exporter), agriculture (Mato), hospitality (Hyatt Centric Soaltee Mode), real estate (Westar Properties), financial services (shareholdings in NMB Bank, Nepal Life, Asian Insurance) and renewable energy. The Pure Energy listing represents a small fraction of the group's renewable-energy ambition: by management's own stated plan, the Golyan Group is targeting roughly 600–700 MW of renewable capacity in development, with one project alone the Upper Mugu Karnali Hydroelectric Project sized at 306 MW under a joint structure backed by the US International Development Finance Corporation. The 20 MW Pure Energy operating asset in Banke is, in this context, the smallest piece of the group's energy portfolio. It is also the only piece that is publicly listed.
The board reflects the structure. Akshay Golyan, the 37-year-old chairman of the broader Golyan Group as of late 2025, also chairs Pure Energy. Nishant Goyal co-founder of REnergo Developers sits as director, representing the REnergo sponsor side. The CFO of the Golyan Group's energy business, Sanjay Sah appears as a Pure Energy director under the name Sanjay Kumar Sah representing Golyan financial oversight. Bishakha Lakshmi Khadka serves as independent director. The board composition reflects the two-sponsor structure: Golyan provides chairmanship and financial leadership; REnergo provides solar-industry technical leadership. This is, in equity research terms, a concentrated promoter governance structure with internal cross-appointments rather than an independent operating company that happens to share a parent.
Pure Energy operates a 20 MW solar PV facility in Raniyapur, Khajura Rural Municipality, Banke. The facility consists of two 10 MW projects: Pure Energy I (operational from December 2023) and Pure Energy II (operational from May 2023). Combined revenue for FY 2081/82 (year ending July 16, 2025) was NPR 259 million, audited by Crowe member firm BK Agrawal & Co. with a clean opinion. Through the first nine months of FY 2082/83 (the current fiscal year, mid-July 2025 through mid-April 2026), revenue totaled NPR 177 million, a 5.8% year-on-year decline reflecting in part weaker monsoon-season generation. Net profit over the same nine-month window was NPR 11.7 million, up 55% year-on-year from NPR 7.6M driven primarily by lower borrowing costs (down 22% YoY as construction debt amortized). Annualized EPS on the trailing 9M basis is approximately Rs 1.95 meaningfully below the optimistic single-quarter run-rates. The company holds a 26% stake in Solar Power Ltd (SPL) a separately constituted entity with five solar projects in the pipeline. Pure Energy has progressively deployed capital into this stake, the FY 2081/82 audit report (year ending July 16, 2025) carried the investment at NPR 27 million but the Q3 FY 2082/83 balance sheet (Chaitra-end 2082, approximately April 2026) shows the investment increased to NPR 152 million as additional capital was deployed during the year. The Solar Power Ltd pipeline itself comprises 5 projects totaling approximately 100 MW of nameplate capacity with PPAs signed under the new 2024 NEA competitive framework at tariffs of Rs 5.38–5.51/kWh (per Mercom India's November 2024 reporting on the NEA solar auction). If the SPL pipeline executes fully, Pure Energy's look-through economic interest in installed capacity would rise from 20 MW direct to approximately 46 MW (20 MW + 100 MW × 26%). In today's reality, that look-through number is 20 MW; the SPL projects have not begun construction.
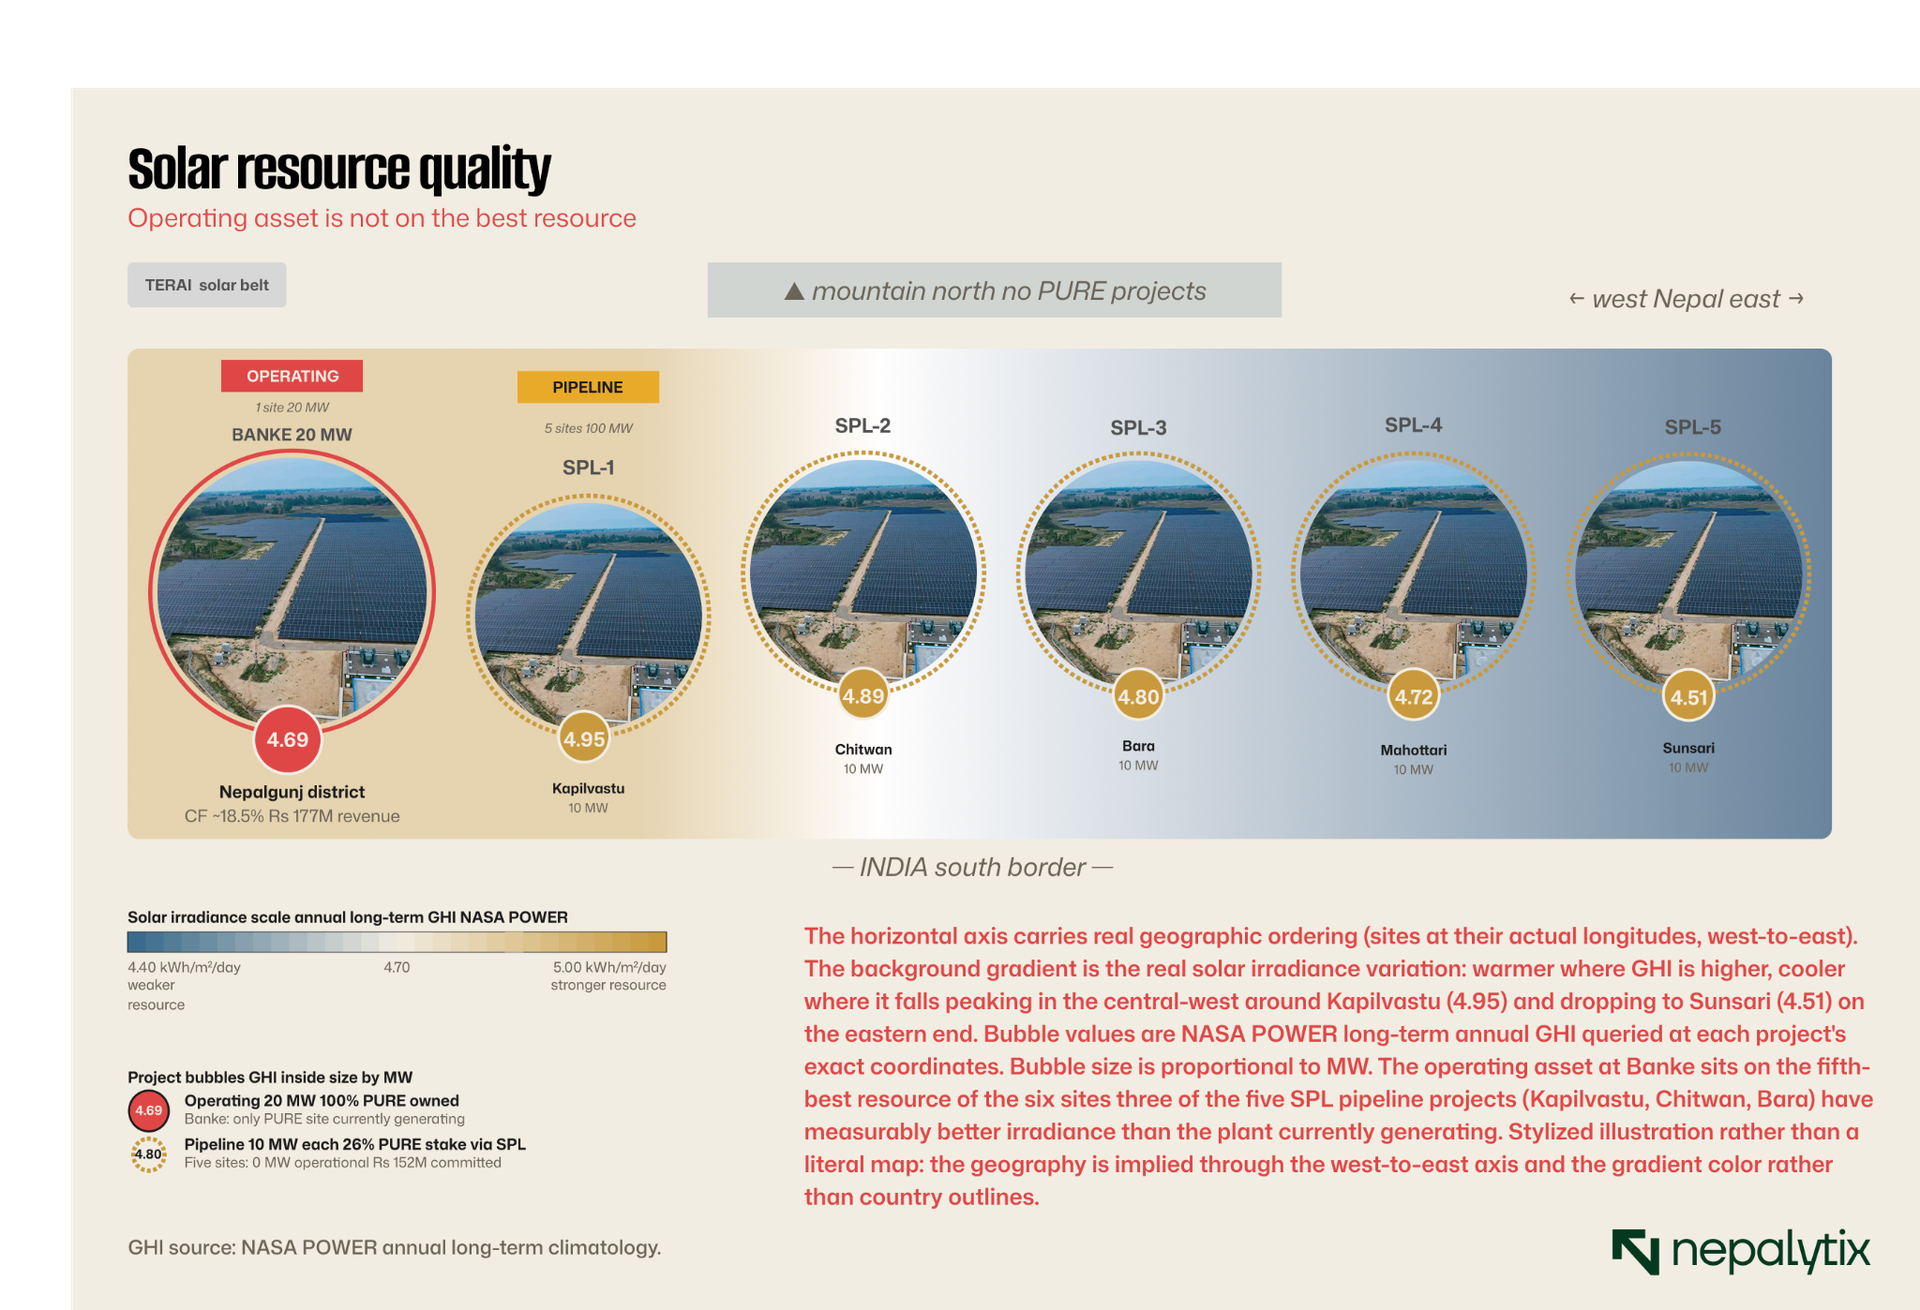
The geography is informative on its own terms. All six PURE-related sites sit along the Terai solar belt where annual irradiance peaks. Banke's long-term GHI of 4.69 kWh/m²/day sits in the middle of the Terai range; three of the five SPL pipeline locations (Kapilvastu 4.95, Chitwan 4.89, Bara 4.80) have measurably better solar resources than the operating plant. Sunsari, at the eastern end of the pipeline, has the weakest resource at 4.51. The operating asset's capacity factor of approximately 18.5 percent is consistent with its resource quality; the pipeline's eventual capacity factors will inherit theirs.
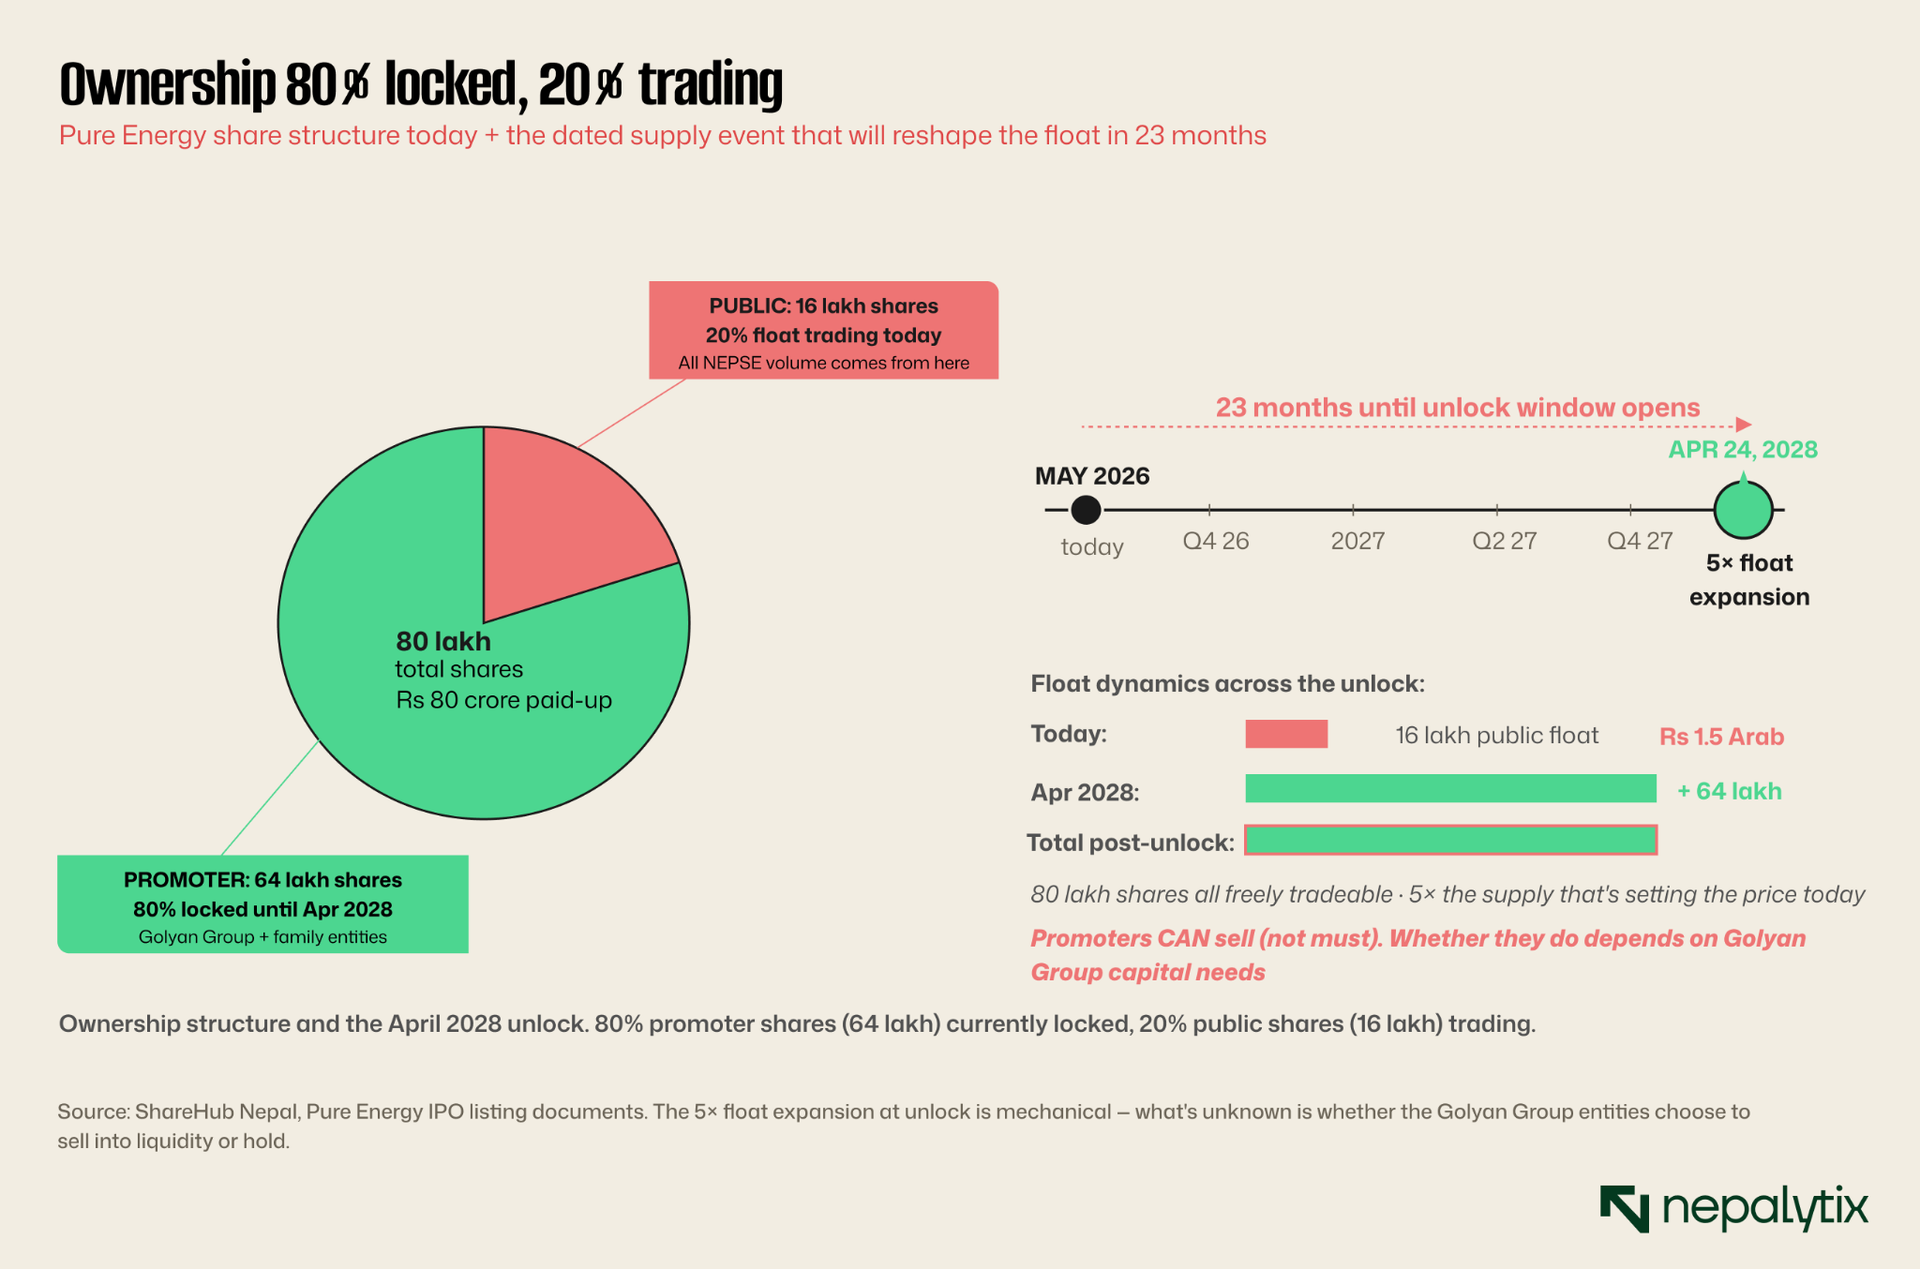
The ownership structure deserves explicit treatment because it dictates how the stock will behave over the next two years. Of the 80 lakh (8 million) shares outstanding, 64 lakh (80%) are held by promoter entities: the Golyan Group and related family-controlled vehicles. Sixteen lakh (20%) trade publicly. The opening range at listing (May 26, 2025) was Rs 96.45 to Rs 289.35; the stock has subsequently settled around Rs 930, well above the opening band. The float market cap of Rs 1.5 Arab represents a small fraction of the total market cap of Rs 7.5 Arab. The April 24, 2028 promoter-unlock date is a known, dated event that mechanically expands the tradeable float by 5×. Whether the promoters choose to sell into that liquidity is unknown. Akshay Golyan has publicly described the group's strategic intent in terms of multi-decade infrastructure, not exit liquidity and a controlling family with $400M of annual turnover does not need PURE share sales for cash flow but the option exists. Promoter-unlock dates in Nepali equity markets have historically been followed by share-price weakness as both supply concerns and the prospect of profit-taking by long-holders weigh on sentiment.
Twelve months of margin compression
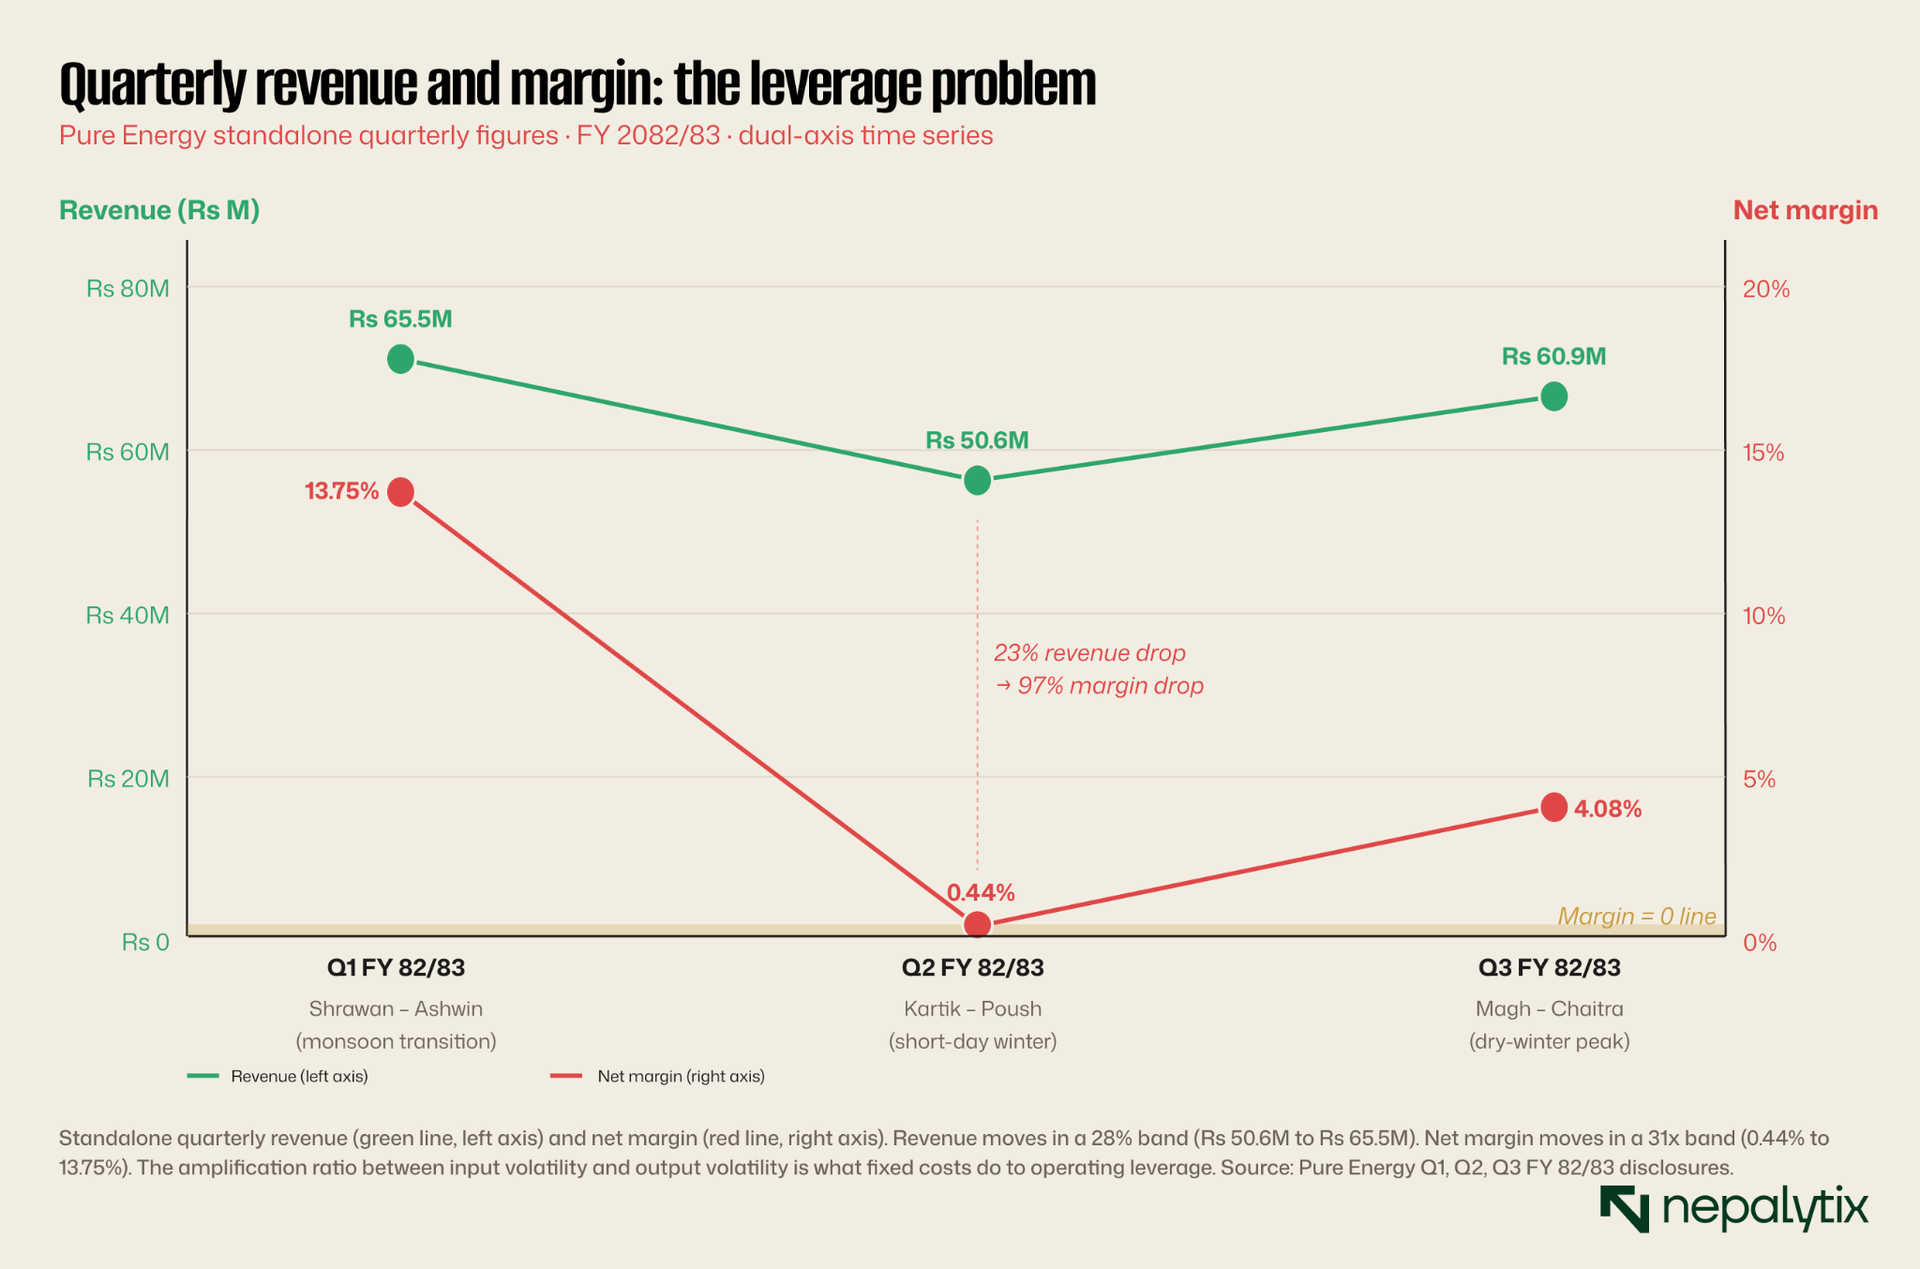
The quarterly arc is where the operating story becomes specific. Pure Energy's revenue scaled with installed capacity as Block 2 came online but margins compressed across the same window partly because debt service on the Block 2 construction loan ramped before generation reached steady state, partly because the realized capacity factor in the early operating quarters has run below long-term expectation.
The margin compression is a real operational fact, not a one-off. At the current PPA tariff of approximately Rs 7.30 per kWh (per CARE Ratings credit report) and project finance debt at typical Nepali bank lending rates, the unit economics are tight by design. Q1 FY 2082/83 (the first quarter of the current fiscal year, ending mid-October 2025) reported net profit of Rs 9 million on the back of seasonal monsoon-cloud-affected generation with EPS rising to Rs 4.50 (from Rs 3.29 in the year-prior quarter) and net worth per share at Rs 101.61. The EPS improvement is real but small. Annualized EPS is approximately Rs 4.50 × 4 = Rs 18 if Q1 represents a fair run-rate though seasonal variation in solar generation is meaningful, the dry-season quarters (Q3 and Q4 of the Nepali fiscal year, roughly January through July) typically deliver materially better capacity factors than the monsoon quarters.
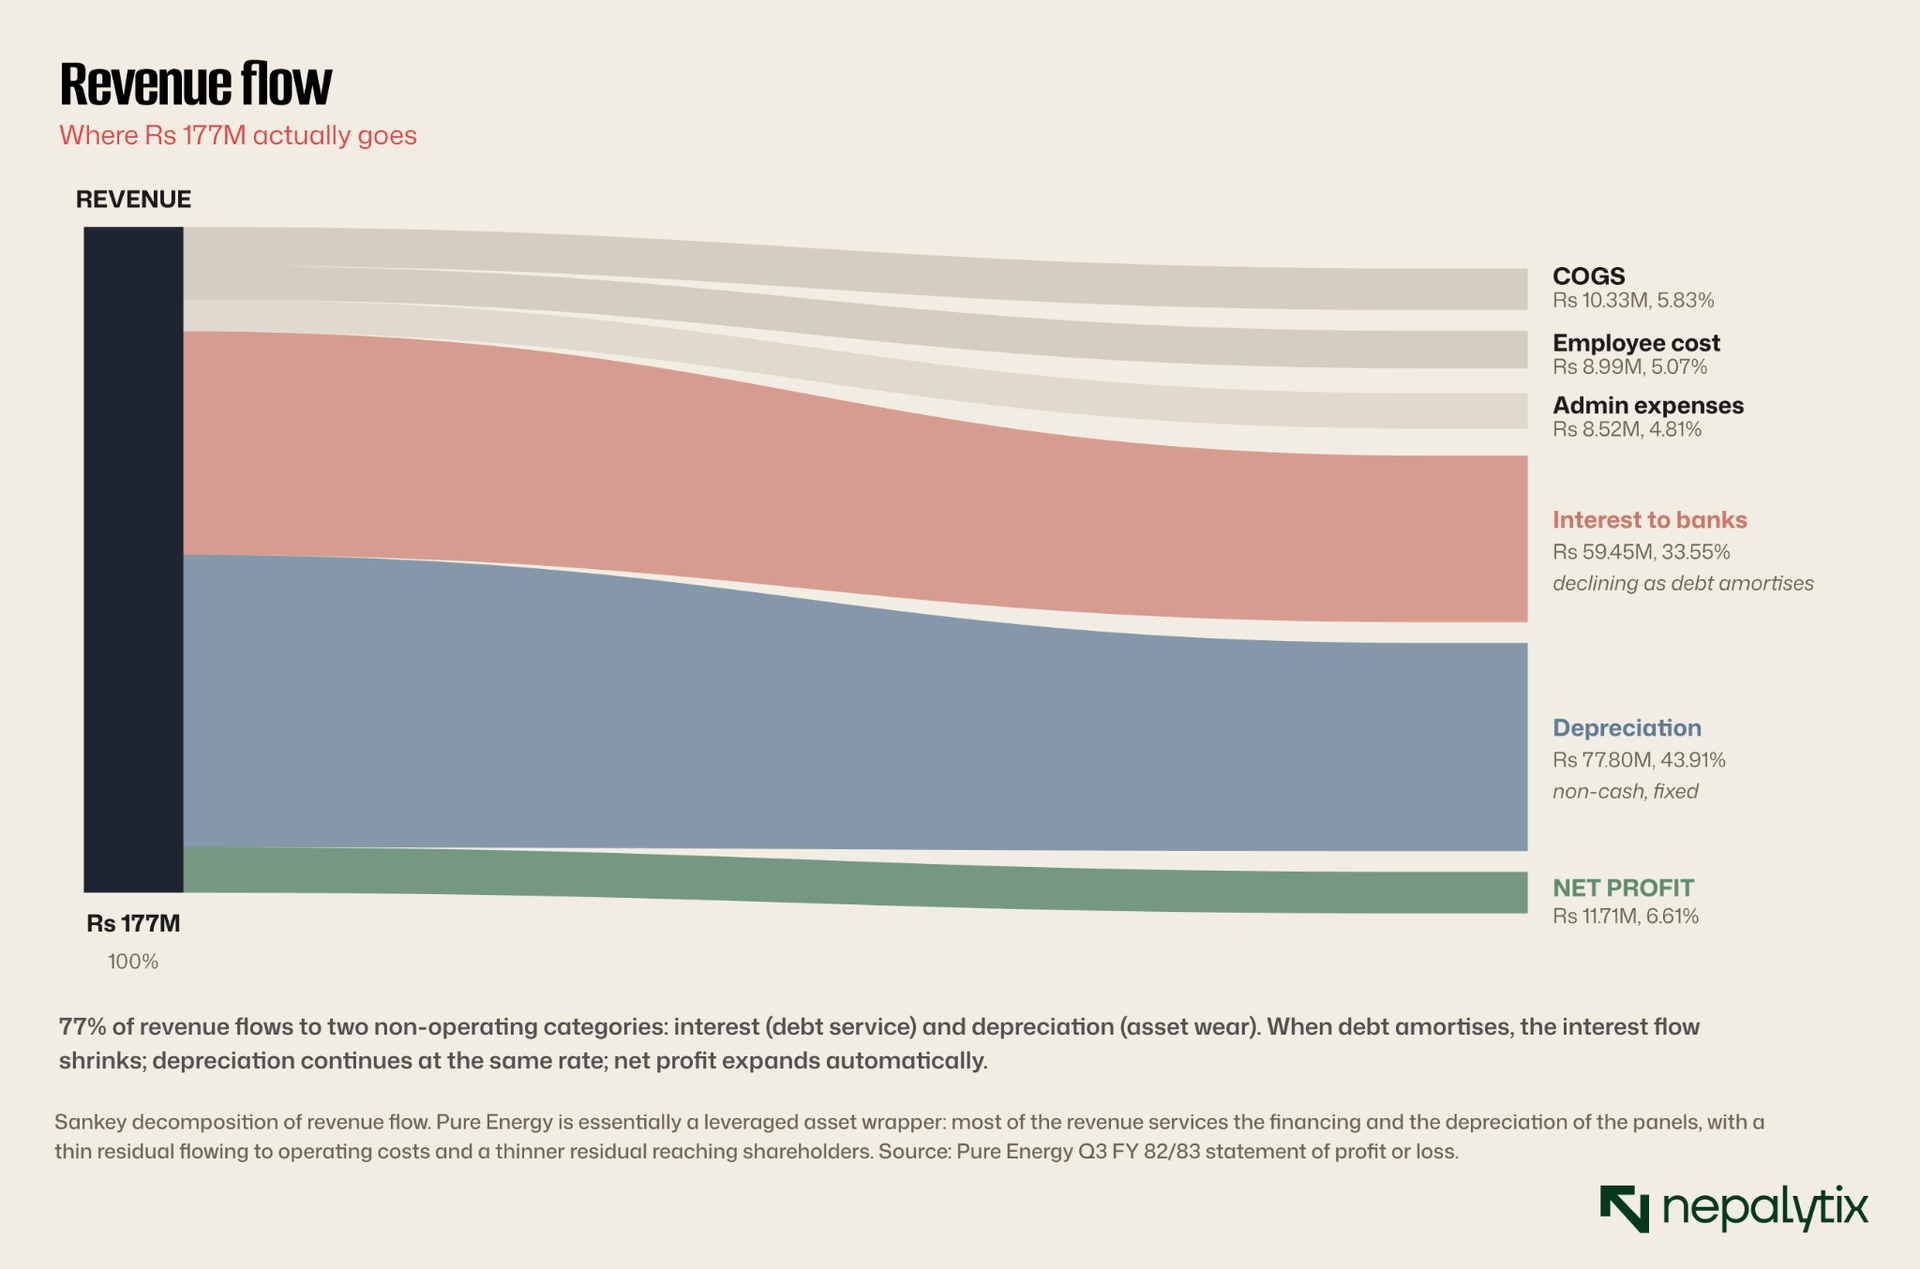
Of every rupee of Pure Energy's 9M FY 82/83 gross revenue, approximately 16 paisa flowed to operating costs (cost of sales, employee compensation, administrative expenses combined), 34 paisa to interest service on construction debt, 44 paisa to depreciation (a non-cash charge reflecting wear on the Rs 2.0 billion gross PP&E base) and only 7 paisa to net profit. Two non-operating categories depreciation and interest absorbed 77% of revenue. The interest line is the largest cash discretionary outflow and the one that mechanically declines as debt amortizes; the depreciation line is non-cash but reflects the very real fact that solar panels have a finite operating life. The path to higher net profit runs primarily through deleveraging (reducing the interest charge) and capacity-factor improvement (raising the revenue against which the same fixed costs are spread), not through tariff or volume growth at constant operations.
The unit economics
For a regulated solar operator under a fixed PPA, two variables drive economics: the realized capacity factor (how much of the installed capacity actually converts to grid sales over a year) and the financing structure (how much of the gross margin gets absorbed by debt service). Tariff is fixed by regulation; cost of inputs is largely fixed by physics and regulation. The remaining variables are operational.
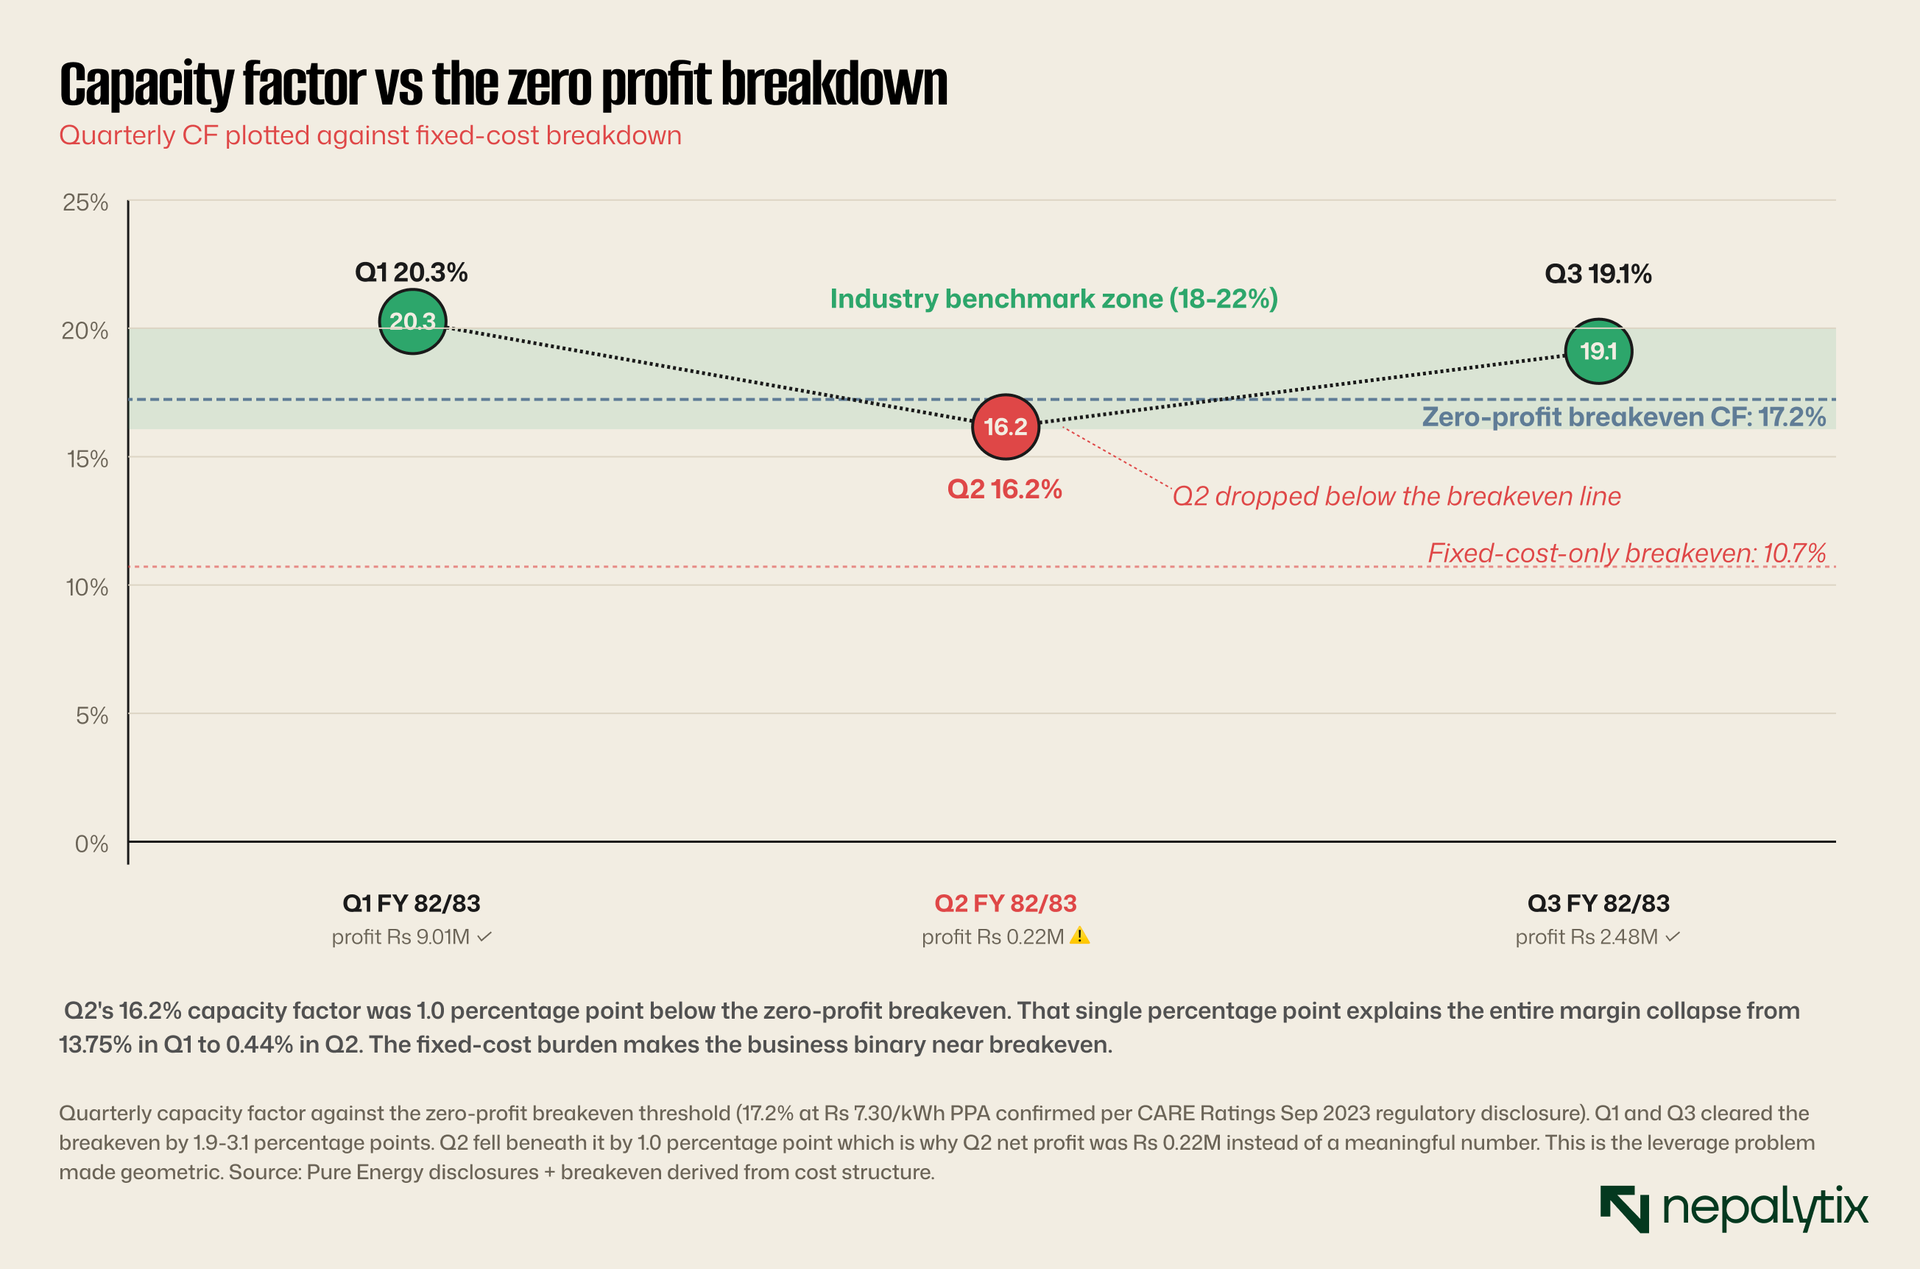
Pure Energy's realized capacity factor across the most recent three quarters of FY 82/83 averaged approximately 18.5 percent only narrowly above the zero-profit breakeven of 17.2 percent (the CF at which gross margin precisely covers fixed costs including interest and depreciation). Quarterly CFs were 20.3% in Q1, 16.2% in Q2 (below breakeven, producing near-zero net profit of Rs 0.22M for that quarter) and 19.1% in Q3. The thin 1.3 percentage-point average cushion above breakeven is the binding economic constraint: a single weak monsoon quarter is enough to drop the company below breakeven on the print. The long-term expectation for well-sited Banke-region solar is typically 19-21 percent; PURE is delivering at the lower edge of that range. The gap between realized and expected capacity factor is the operational drag on current margins. Whether that gap closes through equipment optimization, soiling management, inverter performance is a matter of operational execution rather than market or regulatory change. The 2026 and 2027 monsoon seasons (June through September) will be the natural test windows. Solar generation drops materially during the monsoon due to cloud cover; the question is whether the absolute floor in monsoon-quarter generation has improved over the company's first full operating year which would suggest equipment-optimization efforts are translating to realized output.
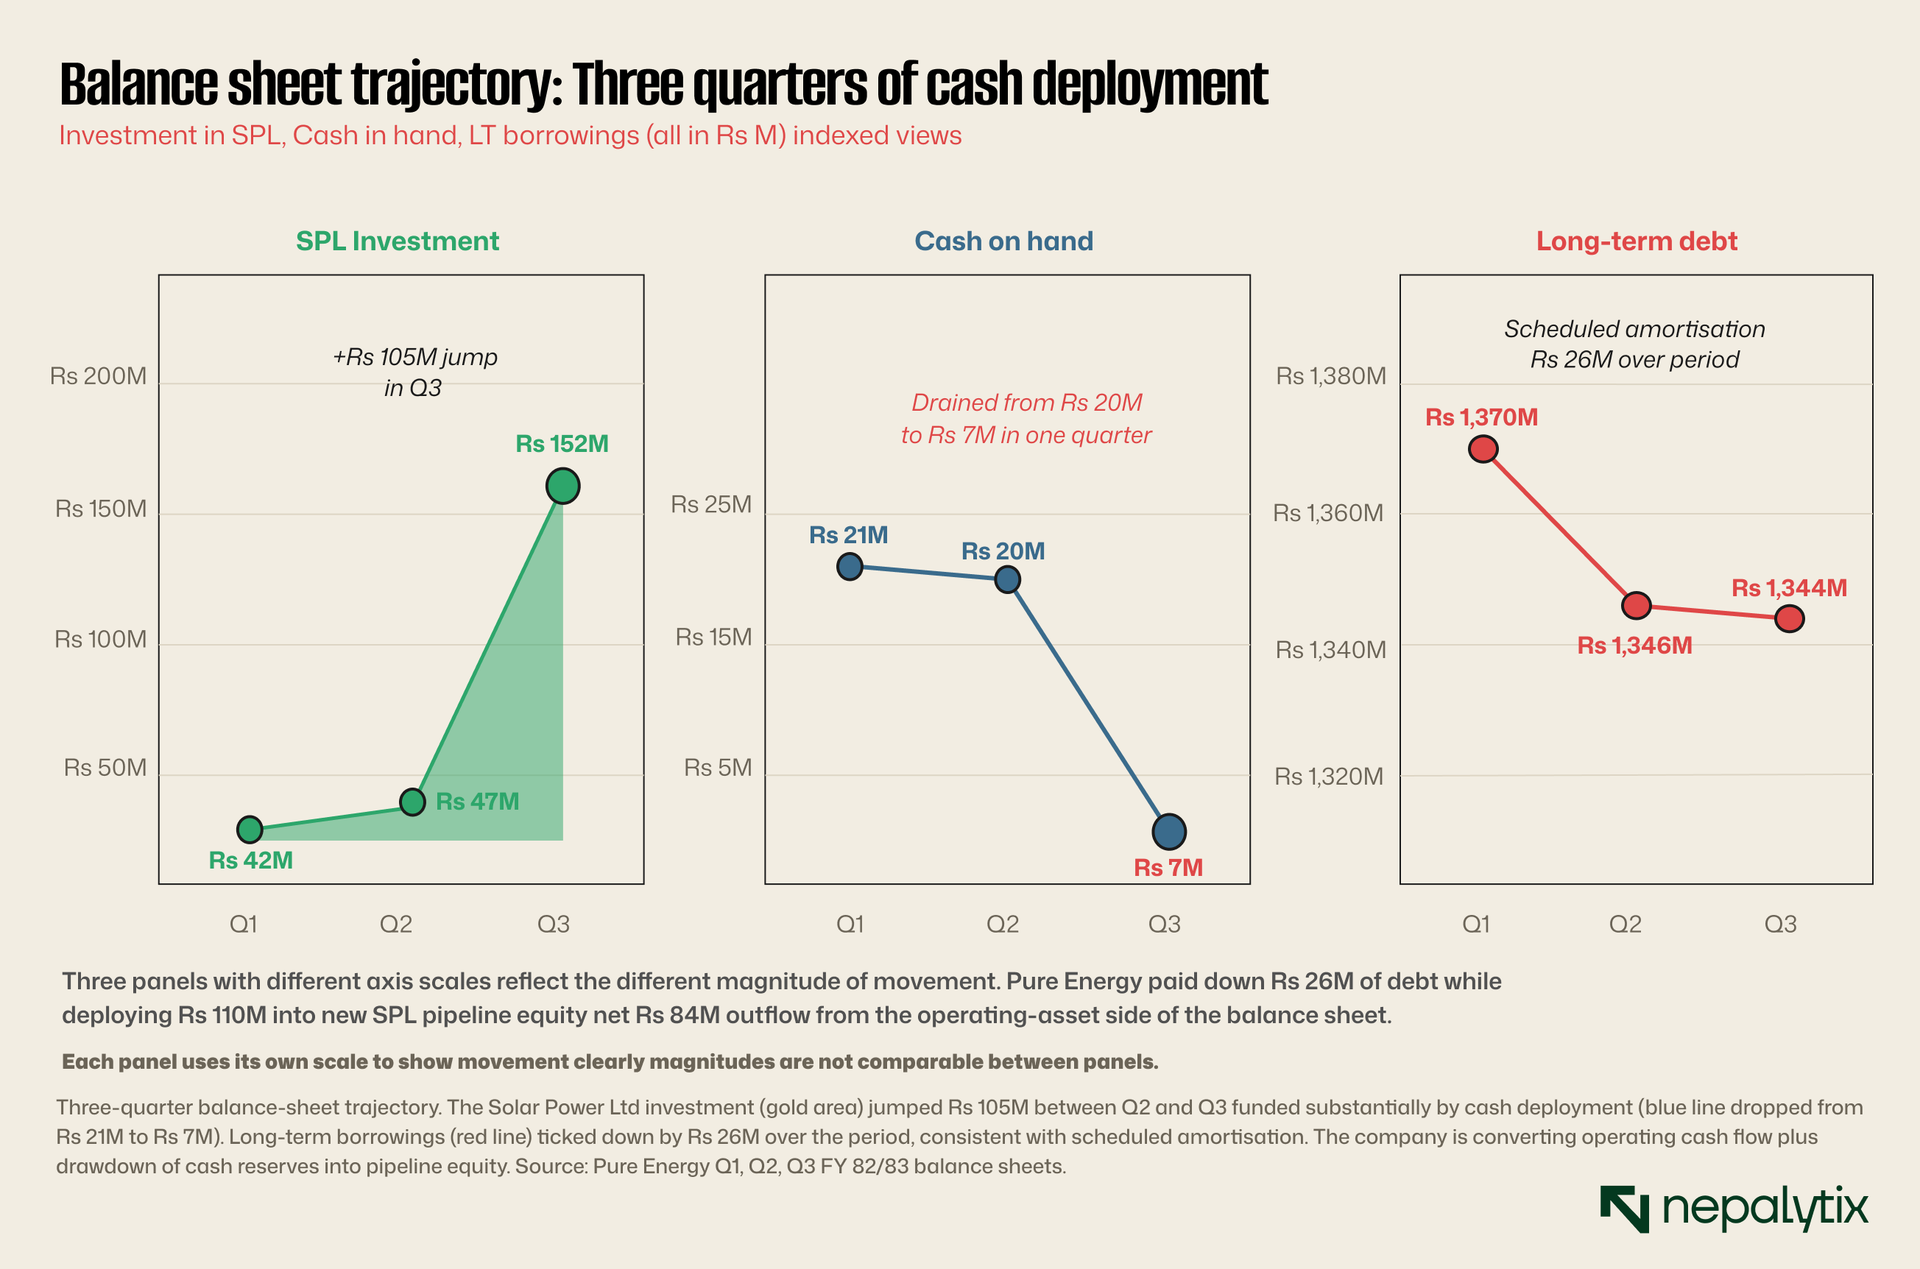
The balance sheet trajectory shows a deleveraging path that is real but slow. Across the three quarters of FY 82/83, long-term borrowings declined from Rs 1,370M (start of Q1) to Rs 1,344M (end of Q3) a reduction of approximately Rs 26 million, or roughly Rs 9 million per quarter. The pace of scheduled amortization is essentially set by the loan agreement and cannot be accelerated without prepayment. At current pace, full deleveraging would take more than 35 years; even accelerated amortization through the tax-holiday years (which expire 10 years after commercial operation, around 2033) would not fully amortize the loan within that window. The ROE improvement story rests on this slow grind plus capacity factor recovery, plus any net contribution from the SPL pipeline if and when it begins generating. The ROE improvement story from current 1.9 percent to something genuinely attractive depends on this deleveraging path holding. Any operational disruption that compresses operating cash flow (a poor monsoon affecting clearance, an inverter failure requiring replacement, a major NEA payment delay) extends the deleveraging timeline.
One specific balance sheet item worth flagging: trade receivables of Rs 43.8 million at end-Chaitra 2082 (April 2026, the most recent quarterly disclosure) against annualized revenue of approximately Rs 236 million implies a days-sales-outstanding (DSO) of approximately 68 days. The FY 81/82 audited annual figure was slightly higher at Rs 45.4 million against Rs 259M revenue a 64-day DSO at year-end. Both readings are on the higher end of plausibility for a regulated utility selling to a single counterparty (NEA). They do not necessarily indicate disputed billing, NEA's IPP payment cycles are known to run 45-90 days during normal operations and can stretch further during NEA's own liquidity squeezes. But it is a real working capital impact that the financial statements record and a useful indicator of NEA's general payment behavior toward IPPs in any given quarter.
The PPA and the counterparty
Pure Energy's economics live or die on the PPA with NEA. Pure Energy's PPA terms per the CARE Ratings Nepal credit rating report (September 2023, BB+ reaffirmed) include: 25-year term from commercial operation (Block 1 commissioned May 1, 2023; Block 2 December 2023; PPA itself signed November 28, 2021); flat-rate tariff of Rs 7.30/kWh (no wet/dry seasonal differential, unlike hydro); take-or-pay structure obligating NEA to pay for contracted generation regardless of dispatch; and a tax holiday of 10 years full exemption plus 5 years at 50% from commercial operation date. The current Rs 7.30/kWh tariff is consistent with the legacy solar PPA framework that was in force when the company signed its agreement; NEA's new 2024 competitive solar PPA framework sets a maximum base rate of Rs 5.94/kWh meaningfully lower than what PURE is currently receiving. This is the underlying tariff risk: at next review, NEA may push to renegotiate down toward the new competitive rate, or insist that any expansion projects come in under the new framework rather than the legacy one.
For now, however, PURE has a meaningful structural advantage. It has a signed PPA. Most of the Nepali IPP universe does not.
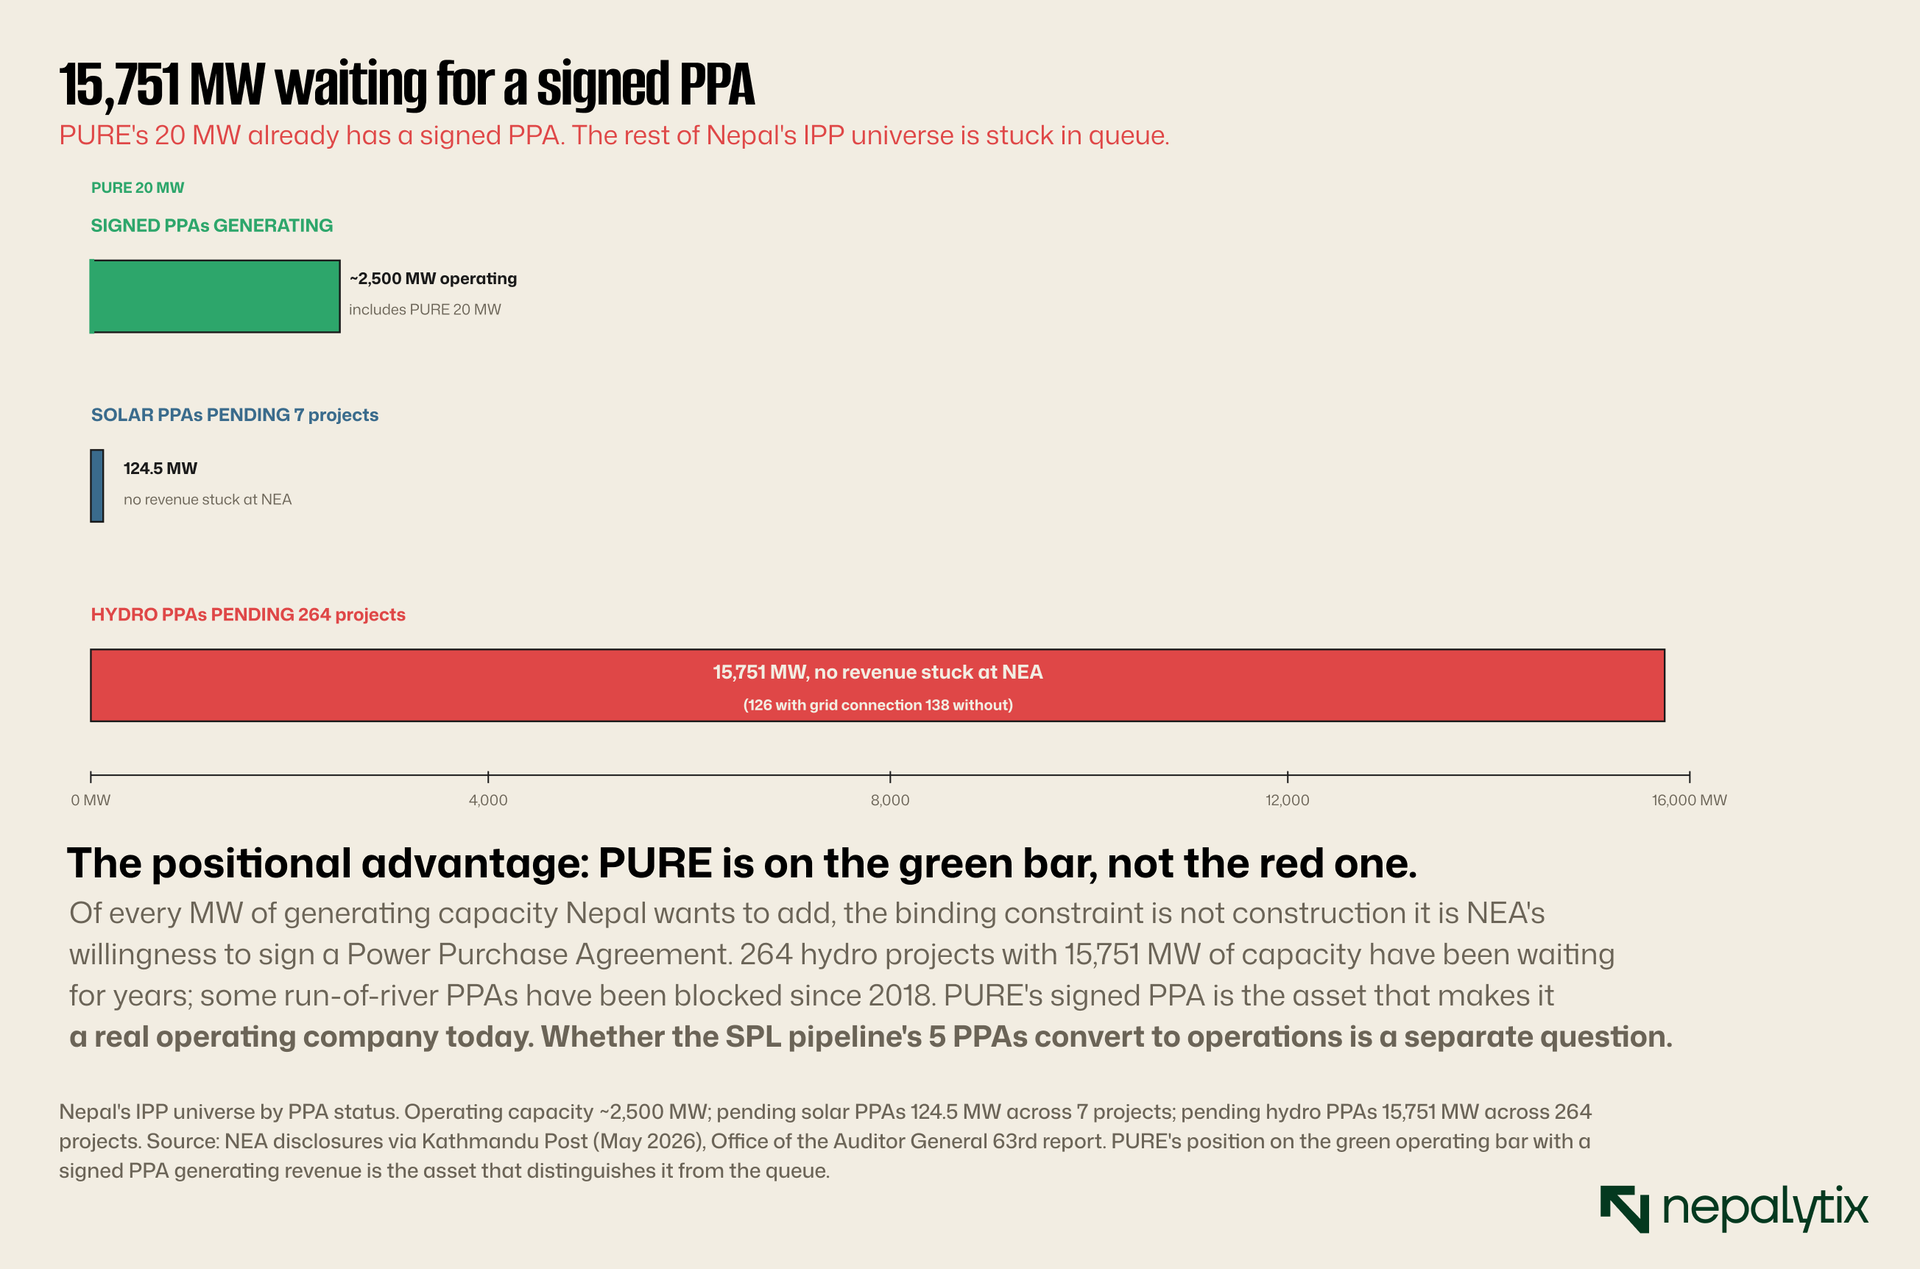
The Kathmandu Post reported on May 18, 2026 that Nepal's IPP universe has a substantial backlog at NEA: 124.5 MW of pending PPAs across 7 solar projects and a staggering 15,751 MW across 264 hydropower projects (126 with grid-connection agreements completed and 138 without). PPAs for run-of-river hydro projects have been largely blocked since 2018; the June 2025 budget controversy over the take-and-pay provision (in which the government attempted to weaken IPP payment guarantees and subsequently backed down on June 24, 2025) was a reminder that the political economy of NEA's IPP relationship is unstable in both directions.
The Office of the Auditor General's 63rd report stated that PPAs for 16,027 MW from 253 producers were still under process during fiscal year 2024-25. Some of these projects have been in process for nearly a decade. Pure Energy's 20 MW operating PPA by contrast is signed and the company is generating revenue against it today. The five Solar Power Ltd projects on PURE's investment ledger have also recently signed PPAs with NEA, per company disclosures but those are PPAs for projects that have not yet begun construction. Signing a PPA and translating it to operating cash flow are two different milestones, and the gap between them is where most of the 15,751 MW currently sits.
The NEA counterparty risk extends beyond tariff renegotiation. The recent management churn at NEA former executive director Kulman Ghising's removal in early 2025 followed by Hitendra Dev Shakya's appointment created a six-month window of uncertainty that affected PPA processing across the sector. Pure Energy's operating revenue is not directly affected by this churn but its working capital cycle is (the rising DSO on trade receivables is consistent with broader NEA payment delays during regime transitions). The risk for PURE is asymmetric: the operating PPA is unlikely to be revoked, but the willingness of NEA to grant tariff revisions favorable to incumbents, or to accelerate payment cycles is sensitive to NEA's own management and the broader political economy.
Peer comparison revenue per MW reveals the solar drag
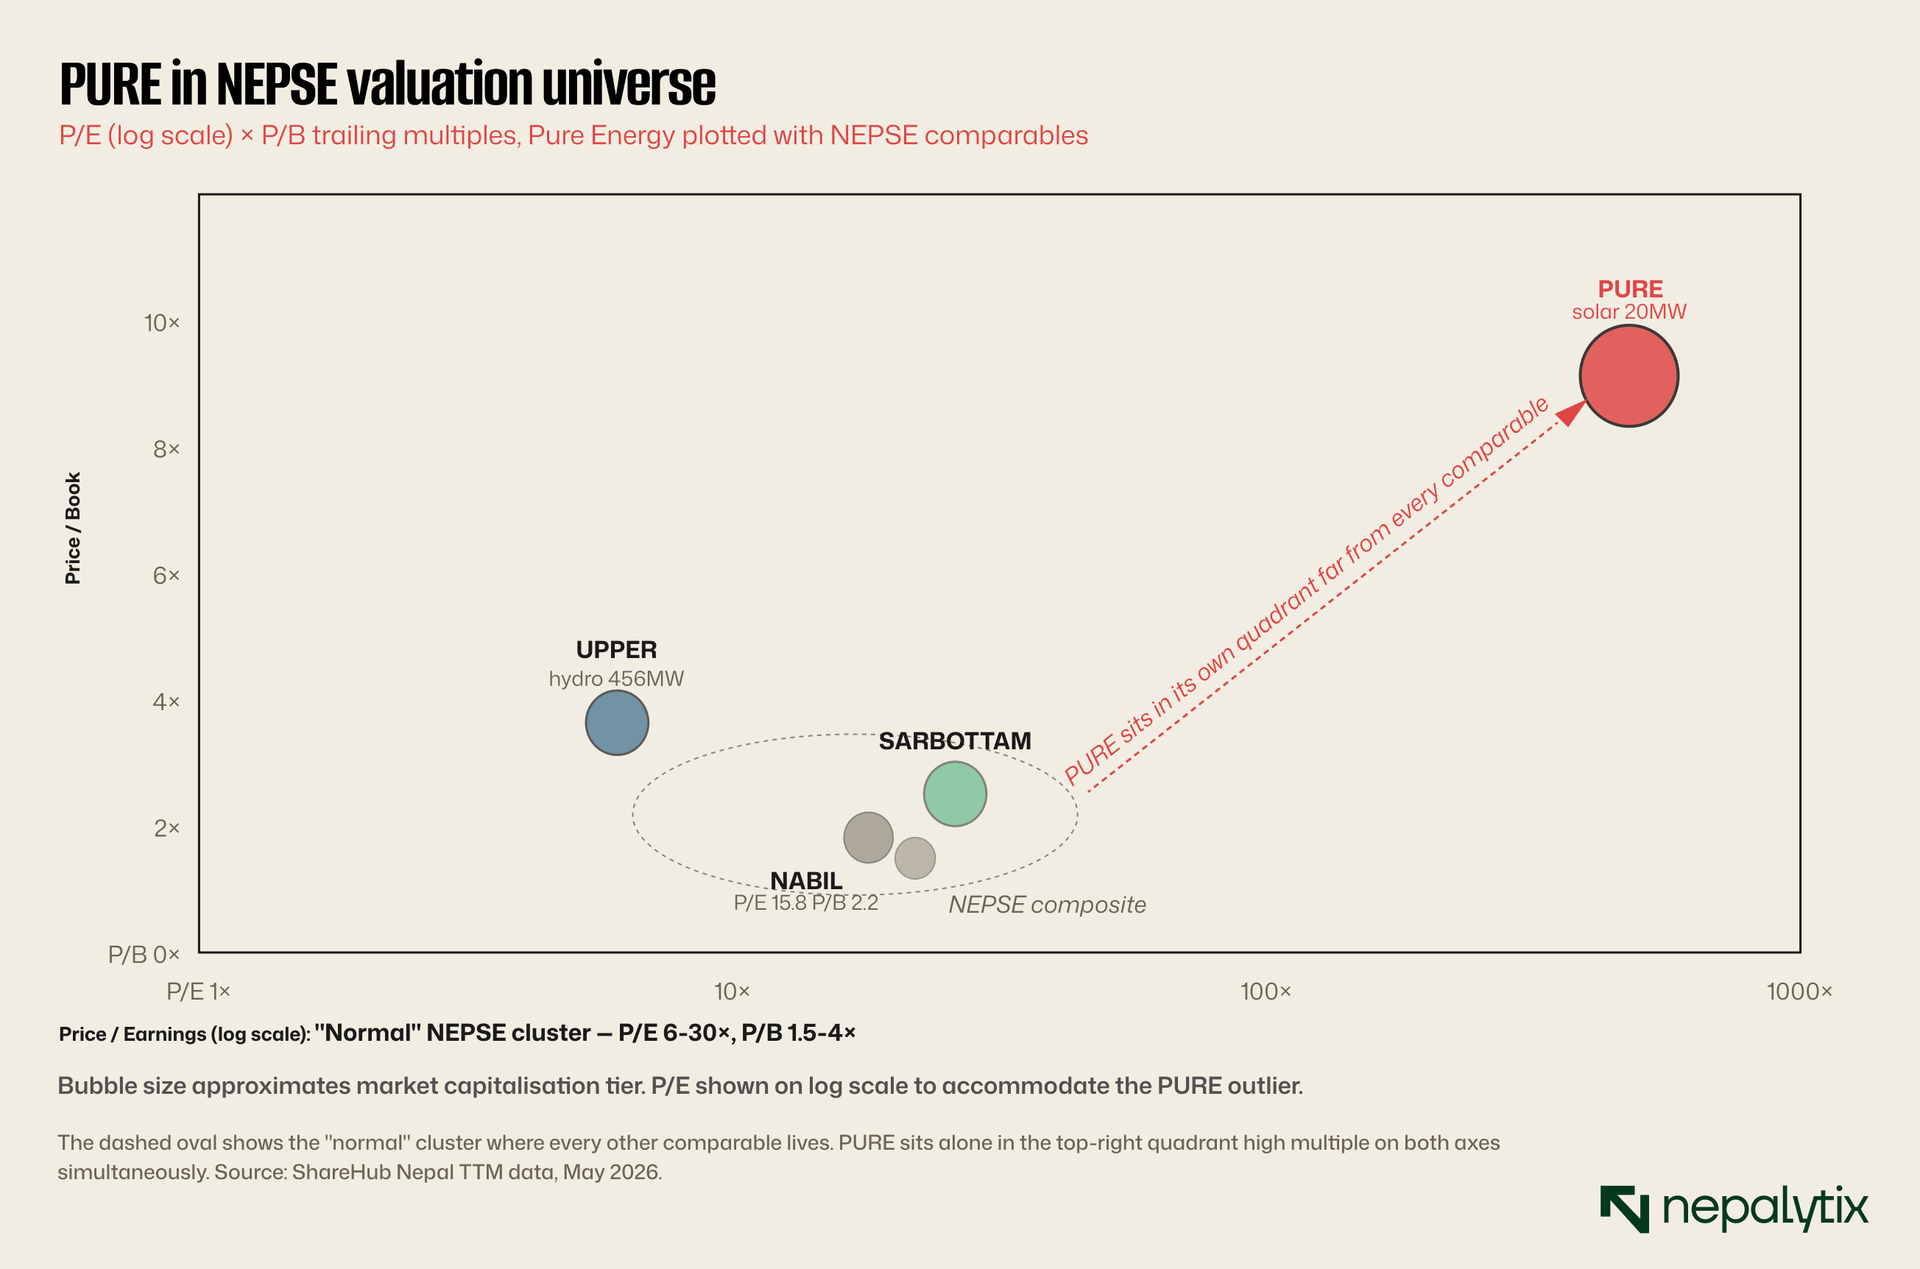
The chart above plots PURE against broad NEPSE benchmarks Upper Tamakoshi (a 456 MW state-controlled hydro behemoth), NABIL (Nepal's largest commercial bank), Sarbottam Cement (a large industrial), and sector composites. PURE sits in its own quadrant well outside the normal NEPSE cluster of P/E 6-30× and P/B 1.5-4×. But the broad NEPSE map is not the most useful comparison for a single-asset IPP. The natural comparables for PURE are specific small-to-mid scale Nepali IPPs with installed capacity in the 5-25 MW range, signed PPAs and commercial revenue.
Three names are worth pulling out specifically as scale-matched comparables. Ru Ru Jalbidhyut Pariyojana (RURU) operates a 5 MW project in Gulmi; current quarterly EPS Rs 23.22 (Q1 FY 82/83 per Nepalipaisa), trailing P/E 31.43×, BVPS Rs 143.28 at share price Rs 729. Mountain Hydro Nepal (MHNL) operates a 22.1 MW project in Panchthar District capacity directly comparable to PURE's 20 MW. Most recent Q2 FY 82/83 EPS Rs 1.14 (a weak quarter), P/E 229.8×, BVPS Rs 31.16 at price Rs 262 showing that even hydro-IPP peers can carry elevated multiples when earnings dip. Nepal Hydro Developers (NHDL) operates a 3.52 MW Charanawoti project in Dolakha; trailing EPS run-rate roughly Rs 13.77, BVPS Rs 122, P/E ~48× at recent prints.
The honest analytical reading: the listed Nepali small-IPP universe trades at structurally elevated multiples relative to global utility benchmarks (12-18× P/E for mature renewable IPPs), reflecting limited float, retail-dominated price discovery, and persistent IPO appetite that supports premium pricing. Within this universe, RURU at P/E 31× and NHDL at P/E ~48× set the rough band of "what the market pays for a small operating IPP." PURE at trailing P/E 476× sits at roughly 10-15× the typical small-IPP multiple not 2× or 3× the peer set. Even on the most generous EPS denominator (annualized Q1 single-quarter run-rate of Rs 4.50 × 4 = Rs 18), PURE trades at P/E 52× close to NHDL but materially above RURU.
The structural difference is what revenue-per-MW reveals. RURU generates roughly Rs 32M per MW annually from 5 MW of hydro capacity; PURE generates roughly Rs 13M per MW from 20 MW of solar capacity. The 2.5× gap reflects the fundamental difference between hydropower capacity factors (typically 40-50% for run-of-river, higher for storage-backed) and solar capacity factors (18-21% for the Terai). Solar simply produces fewer kilowatt-hours per installed MW per year than hydro does in the same geography. Pure Energy will never close this gap with hydro on a kWh-per-MW basis; the bull case for solar rests on lower capex per MW (which PURE realized) and on incremental capacity additions through the SPL pipeline (which remain optionality, not realized revenue).
The bull case for PURE that justifies trading at hydro-comparable multiples (rather than a discount) rests on two claims: that solar will compound faster than hydro as Nepal expands its electrification ambitions, and that the SPL pipeline will materially expand PURE's look-through MW economics. Both are defensible but neither is yet proven in the financial statements.
What the market is pricing
Pure Energy trades at a trailing P/E of approximately 476× on the most conservative read (four-quarter trailing EPS of Rs 1.95) and somewhere closer to 50× on an optimistic forward read (annualized recent Q1 × 4). The realistic figure is in between with seasonality and ramp-up dynamics making any single quarter unreliable as an annualized indicator. What is unambiguous is that the multiple whether 50× or 476× is elevated against the listed Nepali energy sector and against absolute global utility comparables (developed-market solar IPPs trade at 12-18×). The valuation chart below positions PURE against broader NEPSE reference points (Upper Tamakoshi as the largest hydro by capacity, NABIL as a banking-sector benchmark, SARBOTTAM as an industrials reference, plus NEPSE composite and hydro median); PURE sits in its own quadrant with both P/E and P/B far above any comparable. The §5 peer comparison is drilled into scale-matched small-IPP comparables (RURU, MHNL, NHDL); this chart shows PURE against the broader NEPSE universe.
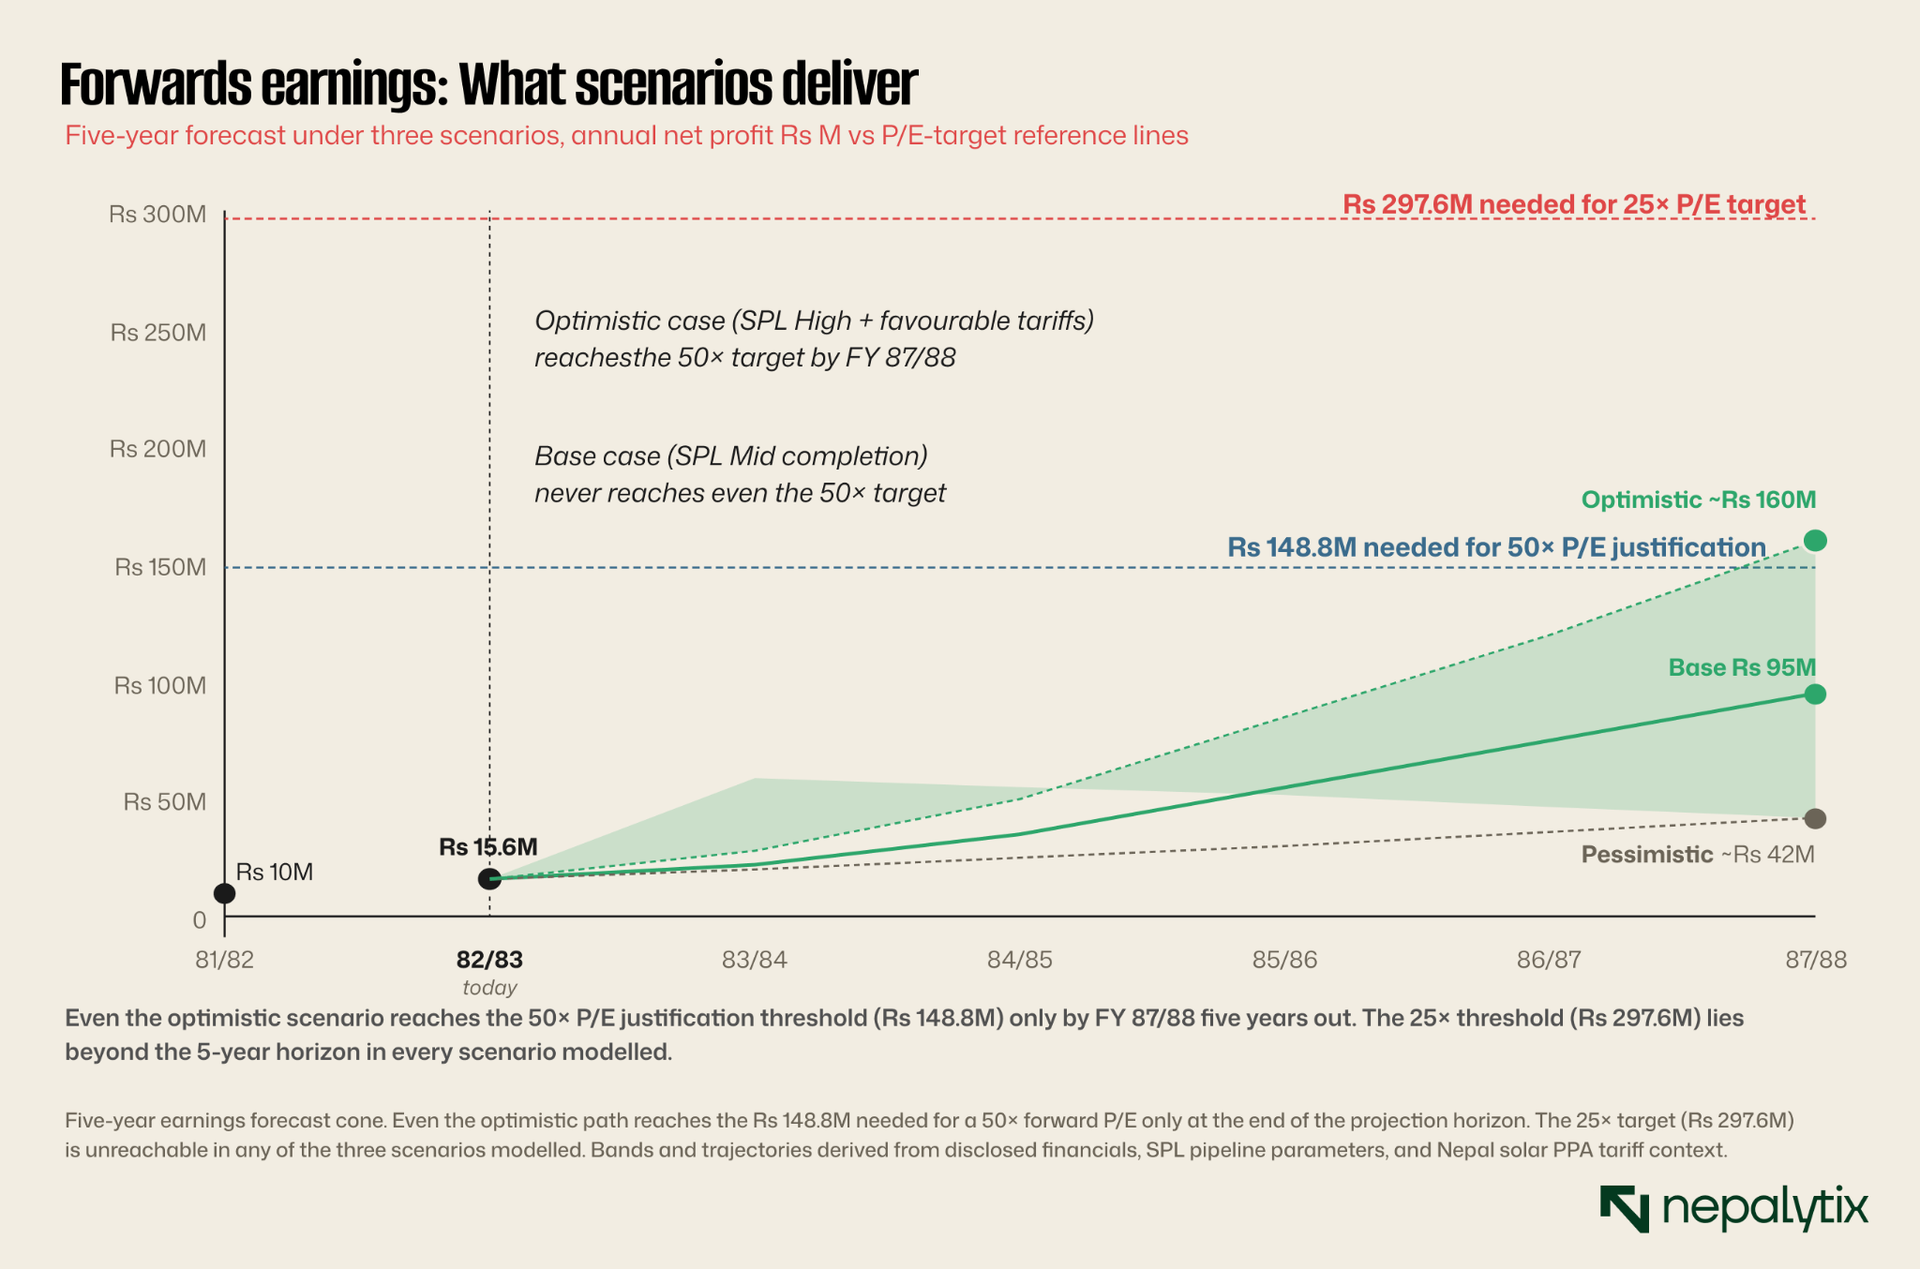
The forward earnings cone shows what the trajectory needs to look like for the current multiple to make sense. The base case current operations, gradual deleveraging, no SPL contribution produces a 10-year earnings path that compresses the P/E to roughly 40× by year four and roughly 20× by year seven. That's still elevated against the energy sub-sector but inside the range investors pay for genuine growth optionality. The bull case SPL pipeline delivers all five projects on schedule, capacity factor improves to 21 percent, deleveraging accelerates, compresses the multiple faster and sustains higher growth through year ten. The bear case SPL pipeline stalls or has its tariffs renegotiated under the new competitive framework, capacity factor stays at 18.5 percent, the legacy PPA itself faces revision pressure leaving the multiple expensive for longer.
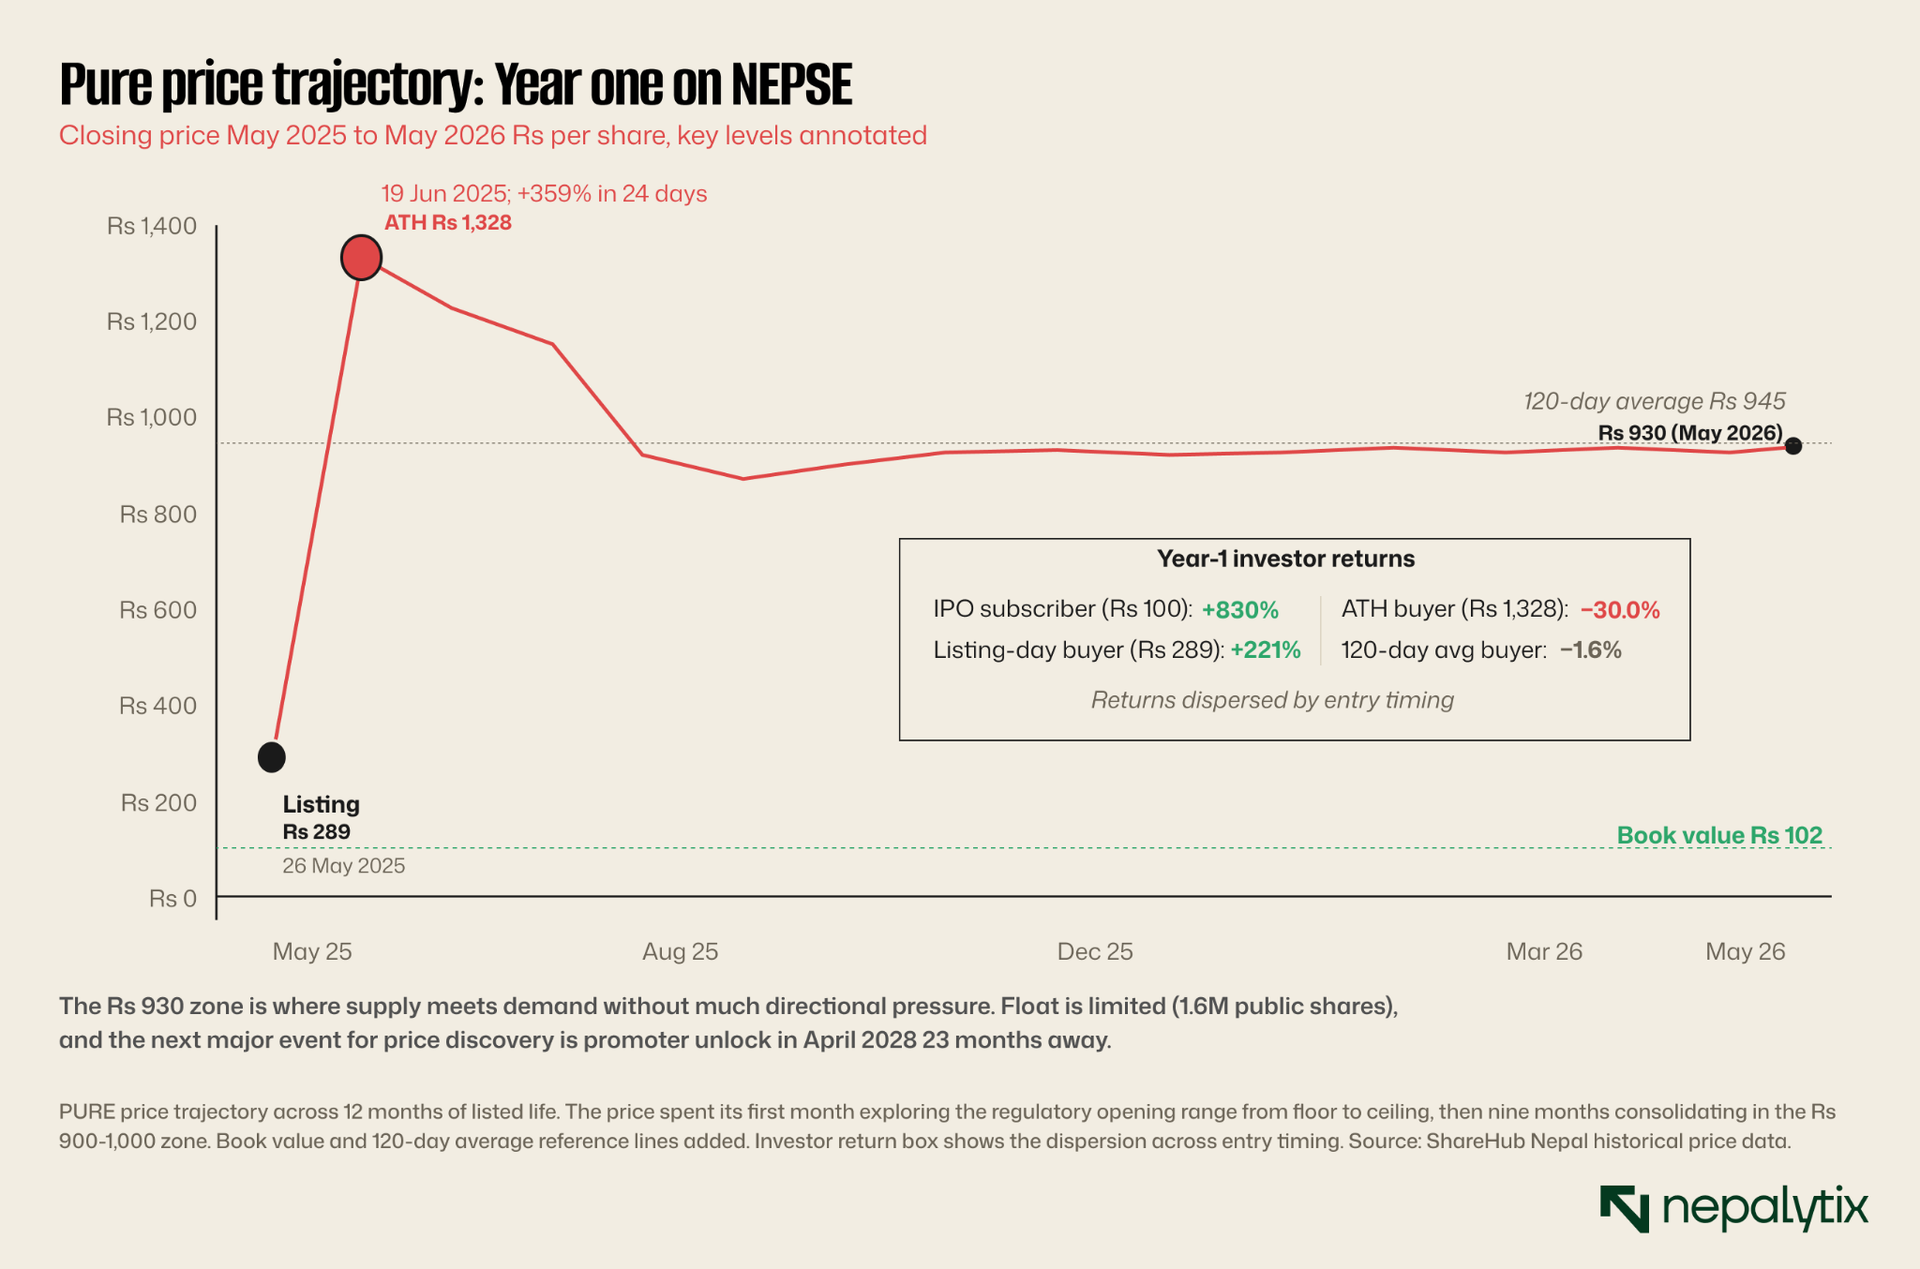
The year-one trading record illustrates the volatility around all of this. From Rs 289 at the lows to Rs 1,328 at the peaks, the stock moved 4.6× within twelve months. The settlement around Rs 930 represents one possible reading; the band itself reflects how widely the market disagrees on what PURE is worth. Newly-listed Nepali equities frequently exhibit this pattern — limited float, concentrated holdings, lack of analyst coverage, and a public that prices on momentum more than fundamentals. The 5-day moving average and 30-day moving average have repeatedly crossed during the year as different cohorts of holders accumulate and trim.
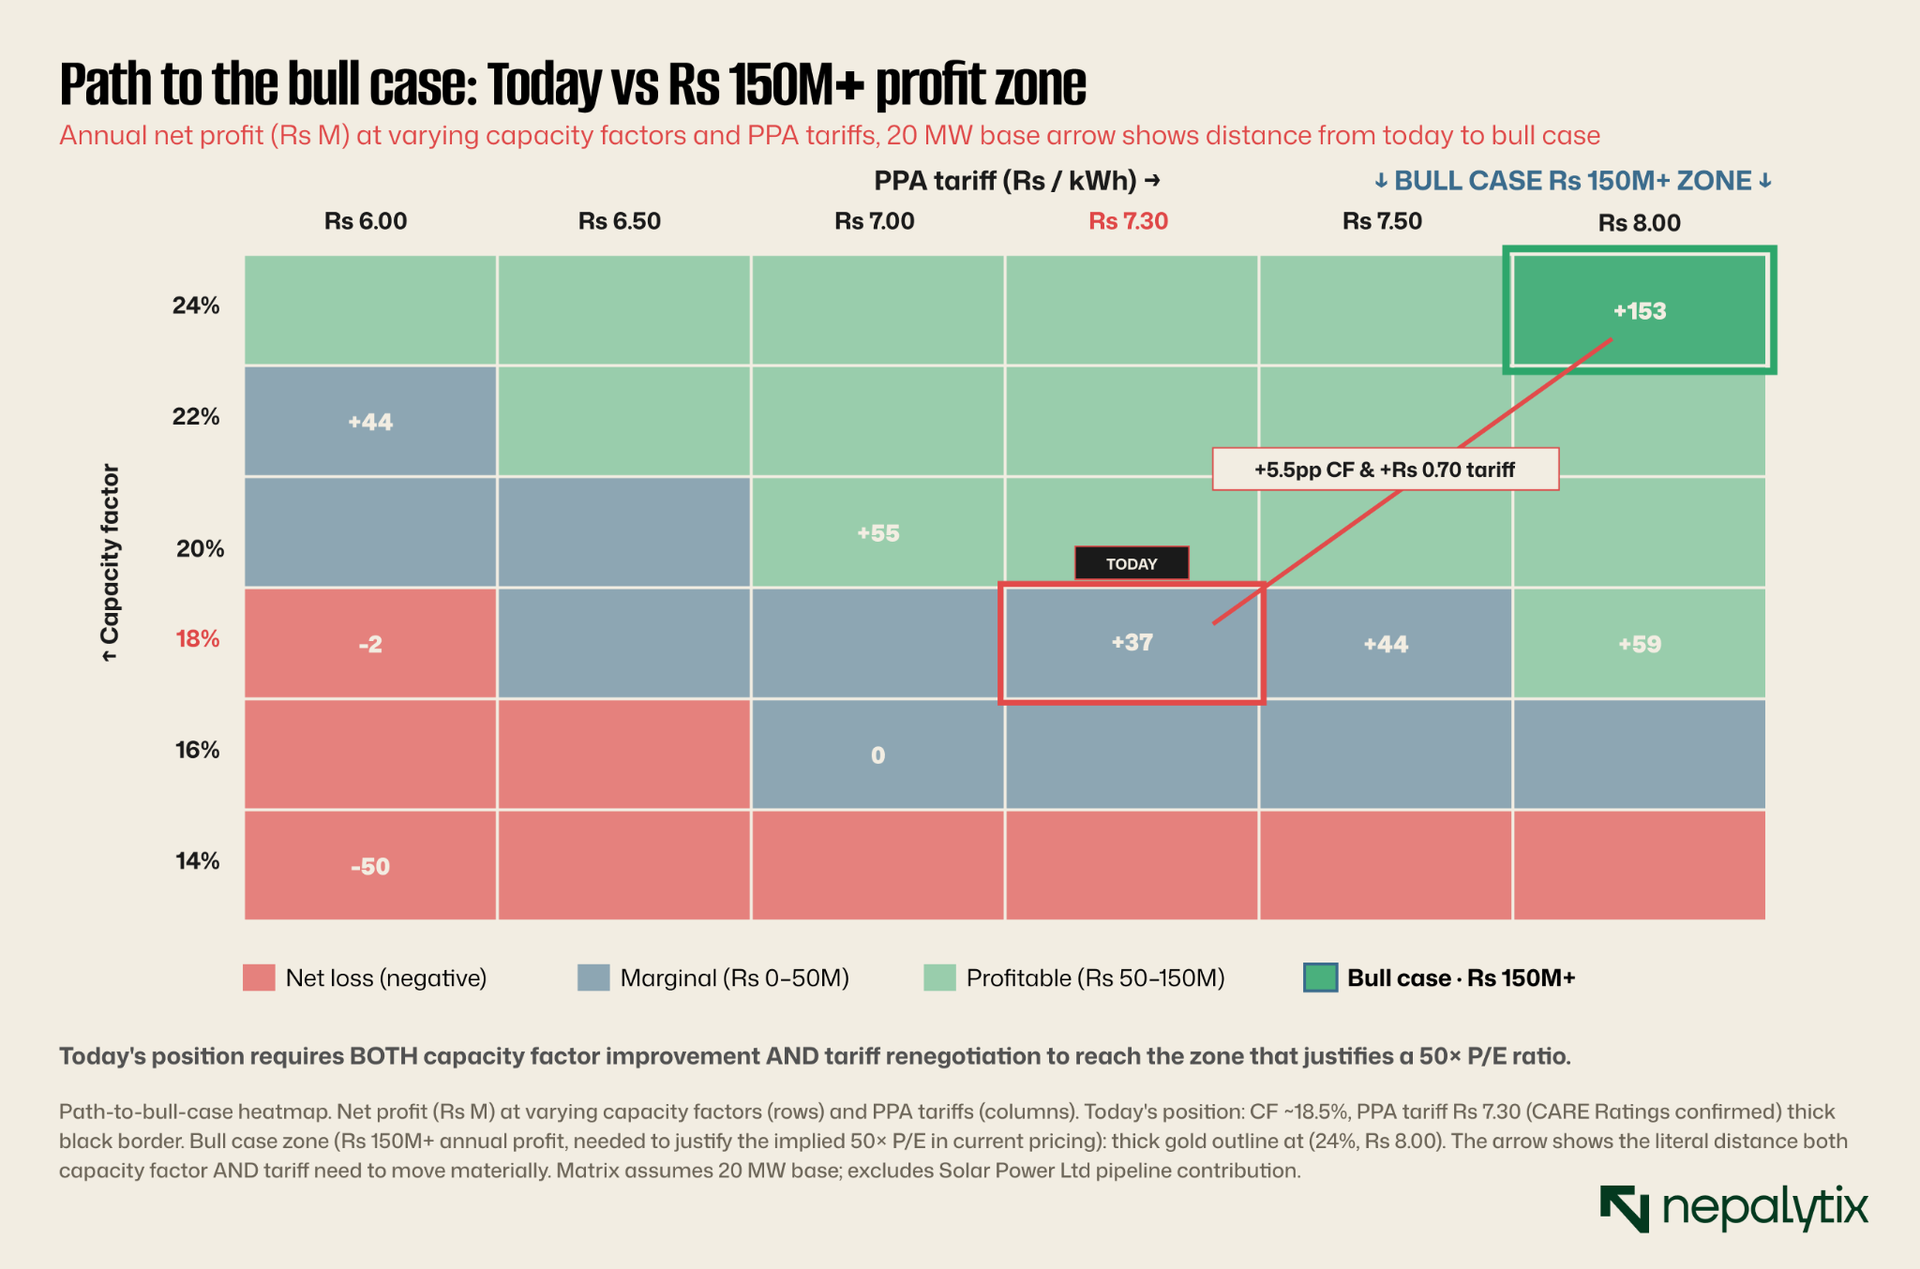
The sensitivity matrix shows what bull-case fundamentals would require explicitly. To generate the Rs 150M+ annual net profit consistent with a comfortable growth-stock multiple, Pure Energy needs capacity factor north of 22 percent AND tariff renegotiation to Rs 8.00 both at the optimistic end of plausibility. Today's combination of CF 18.5% and tariff Rs 7.30 produces approximately Rs 37M of annual profit. The gap between these two states is the operational delivery the current valuation implies will happen.
Catalysts and the bear case
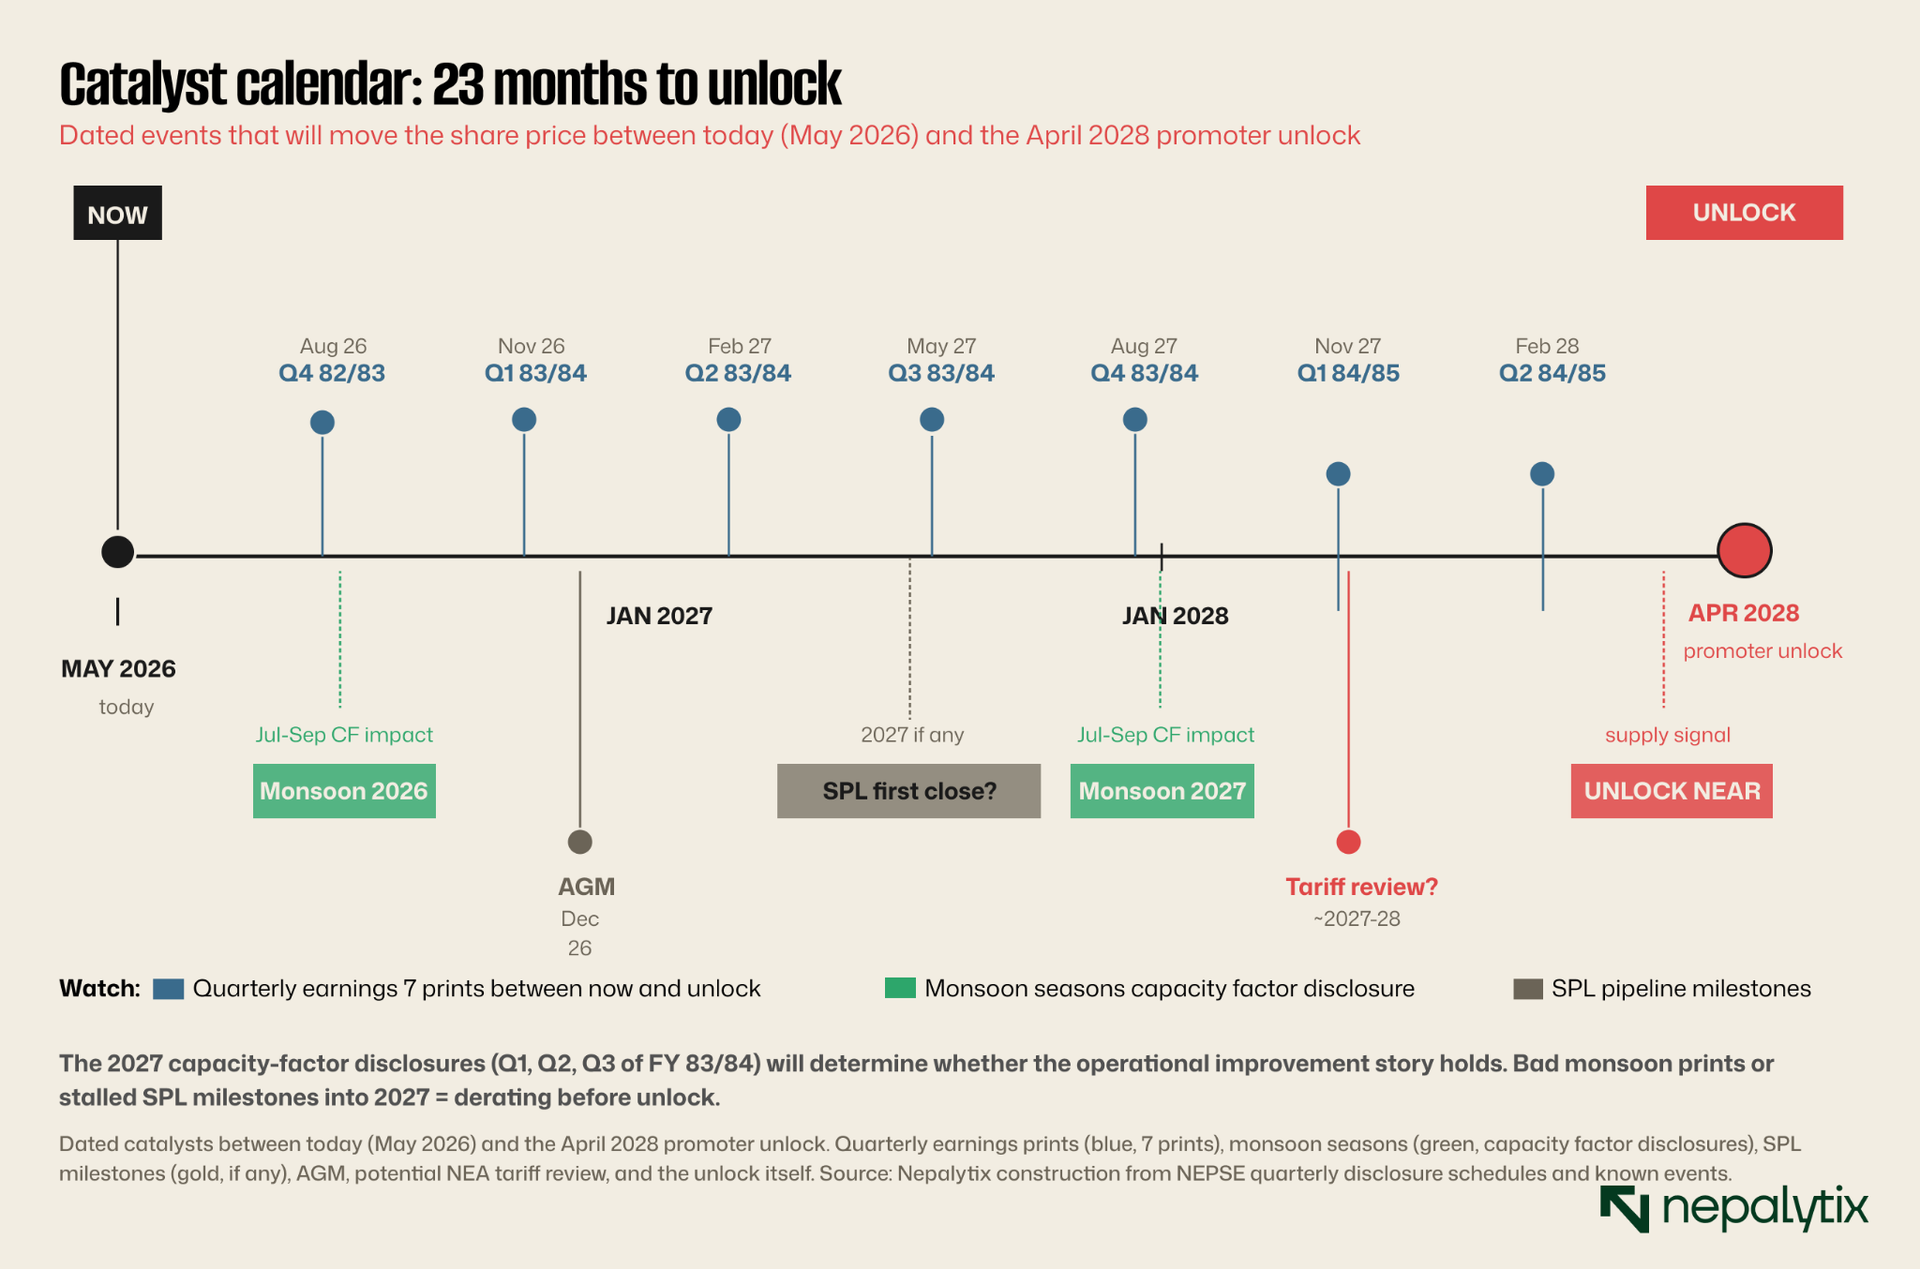
Between today (May 2026) and the April 2028 promoter unlock window, seven quarterly earnings prints will reset the operating narrative four to five times. Two monsoon seasons will test whether the operational improvement story holds. The SPL pipeline will at some point need to show financial close on at least one project for the optionality to remain credible. The NEA tariff framework may be revisited under the next major budget cycle. The promoter unlock itself looms 23 months out.
The bull case bridge from today's Rs 37M annual profit to a Rs 150M+ comfortable-multiple outcome requires multiple things to go right within this calendar. CF improvement needs to show up in Q3 and Q4 disclosures of FY 83/84 (the dry season). SPL financial close on at least one project before mid-2027 keeps the pipeline credible. Either the legacy PPA tariff holds at Rs 7.30 indefinitely or a tariff review revises pricing upward (unusual in markets where new competitive rates are lower). The bull case price target on optimistic assumptions, sits in the Rs 1,100-1,300 range by late 2027, consistent with the upper end of the year-one trading band.
The bear case is asymmetric. If 2027 monsoon prints show capacity factor stalled or regressing, the operational improvement thesis weakens. If SPL pipeline projects fail to reach financial close by Q4 FY 83/84 (mid-2027), the optionality argument weakens. If NEA initiates tariff renegotiation pressure on legacy contracts (which is plausible given the new Rs 5.94/kWh competitive framework setting a market reference), the entire forward earnings cone shifts down. In a scenario where all three of these unfavorable outcomes materialize and the market begins to apply hydropower-IPP-equivalent multiples (~50× P/E) to PURE's current Rs 15.6M annualized profit, the implied share price compresses below Rs 100, a more than 85% drawdown from current levels. Even a less severe bear scenario where the market continues to grant PURE a growth-stock premium (~150× P/E on Rs 15.6M) implies Rs 293, a 68% drawdown. Promoter unlocking supply hitting the same window would amplify any of these scenarios.
The bear case anchor is not "PURE goes bankrupt" , the asset is real, the debt is serviceable at current cash flow, and the Golyan Group standing behind it provides credit support. The bear case is "the multiple compresses faster than earnings growth," which is a different and more common outcome than corporate failure. The arithmetic is sobering when grounded in actual reported earnings rather than sensitivity-model assumptions. Annualized net profit from the disclosed Q3 FY 82/83 9M run-rate (Rs 11.7M × 12/9) sits at approximately Rs 15.6M, dividing across 8 million shares to give EPS of Rs 1.95, the same trailing EPS figure cited at the top of this piece. At a 50× P/E (the level RURU and NHDL trade at, providing a peer-comparable benchmark), the implied PURE price is Rs 97. At a more generous 100× P/E (rewarding solar growth optionality), the implied price is Rs 195. At a 200× P/E (heroic), the implied price is Rs 390. The current Rs 930 price implies a 476× P/E on trailing earnings, which means the market is pricing in earnings growth that must materialize within roughly two to three years to "grow into" even a 100× multiple. The cone of plausible scenarios suggests that growth is possible but not certain at that pace.