Ten Years Of Cheap And Dear Money
Since 2016, Nepal has experienced six liquidity regimes. One fueled a 169% NEPSE rally in just fourteen months. Another has delivered barely 30% growth in over three years, despite Rs 2.28 trillion in unlent bank deposits. Analyzing 120 months of NRB data and a decade of stock prices reveals a fundamental truth: liquidity can move markets, but without borrowers, cheap money has nowhere to go.
Since 2016 Nepali money has swung between glut and crunch six times. Twice it became very cheap. The first time in 2020 and 2021, NEPSE rose 169% in fourteen months. The second time which began in mid-2023 and has not ended, the index is up 30% in more than three years and Rs 2.28 trillion of deposits sits unlent. We went through 132 months of central bank data and ten years of daily prices to find out what made the difference.
1. Ten years, six regimes
In mid-July 2026 the average commercial bank in Nepal paid 3.21% on a deposit and charged 6.55% on a loan. Both were the lowest readings in the central bank’s monthly series which starts in August 2016. Three years earlier the same banks were paying 7.86% and charging 12.30%. In between, every price of money in the country fell: the interbank rate, the Treasury bill yield, the base rate that banks use to price their loans. Nepal Rastra Bank cut its policy rate from 7% in mid-2023 to 4.25% by mid-2026.
On the textbook account, money that cheap should have done three things. It should have pushed banks to lend more because their deposits cost them almost nothing to hold. It should have pushed savers out of deposits and into other assets because a 3% deposit rate barely keeps up with inflation. And it should have lifted the stock market because the rate at which future earnings are discounted fell by more than half.
Some of that happened. Most of it did not. Private-sector credit grew by 6.6% in the year to mid-July 2026 against an average of 22% a year between August 2016 and July 2019. Deposits grew more than twice as fast as loans. The share of deposits that banks lent to the private sector fell to its lowest level in ten years. And NEPSE which closed at 2,664.13 on 3 November 2026, is about 17% below the all-time high of 3,198.60 that it set in August 2021 during the previous episode of cheap money.
This piece goes back over the last ten years of Nepali money to work out why the two episodes ended so differently. We use the monthly series that the central bank publishes in the statistical annexes to its macroeconomic reports: the interbank rate, the 91-day Treasury bill yield, the average deposit and lending rates of commercial banks, the average base rate, total deposits and the monetary sector’s claims on the private sector. We line those up against the daily closes of NEPSE and its banking sub-index. Everything here can be recomputed from public numbers and the method and a data appendix are at the end.
The first thing the data shows is that “cheap” and “dear” are not two states but at least six. Reading the interbank rate, lending rates and credit growth together, we divide the decade into six regimes. They are our own labels, dated to the month and the boundaries are a matter of judgment but each one has a different mix of what money cost and what it did.
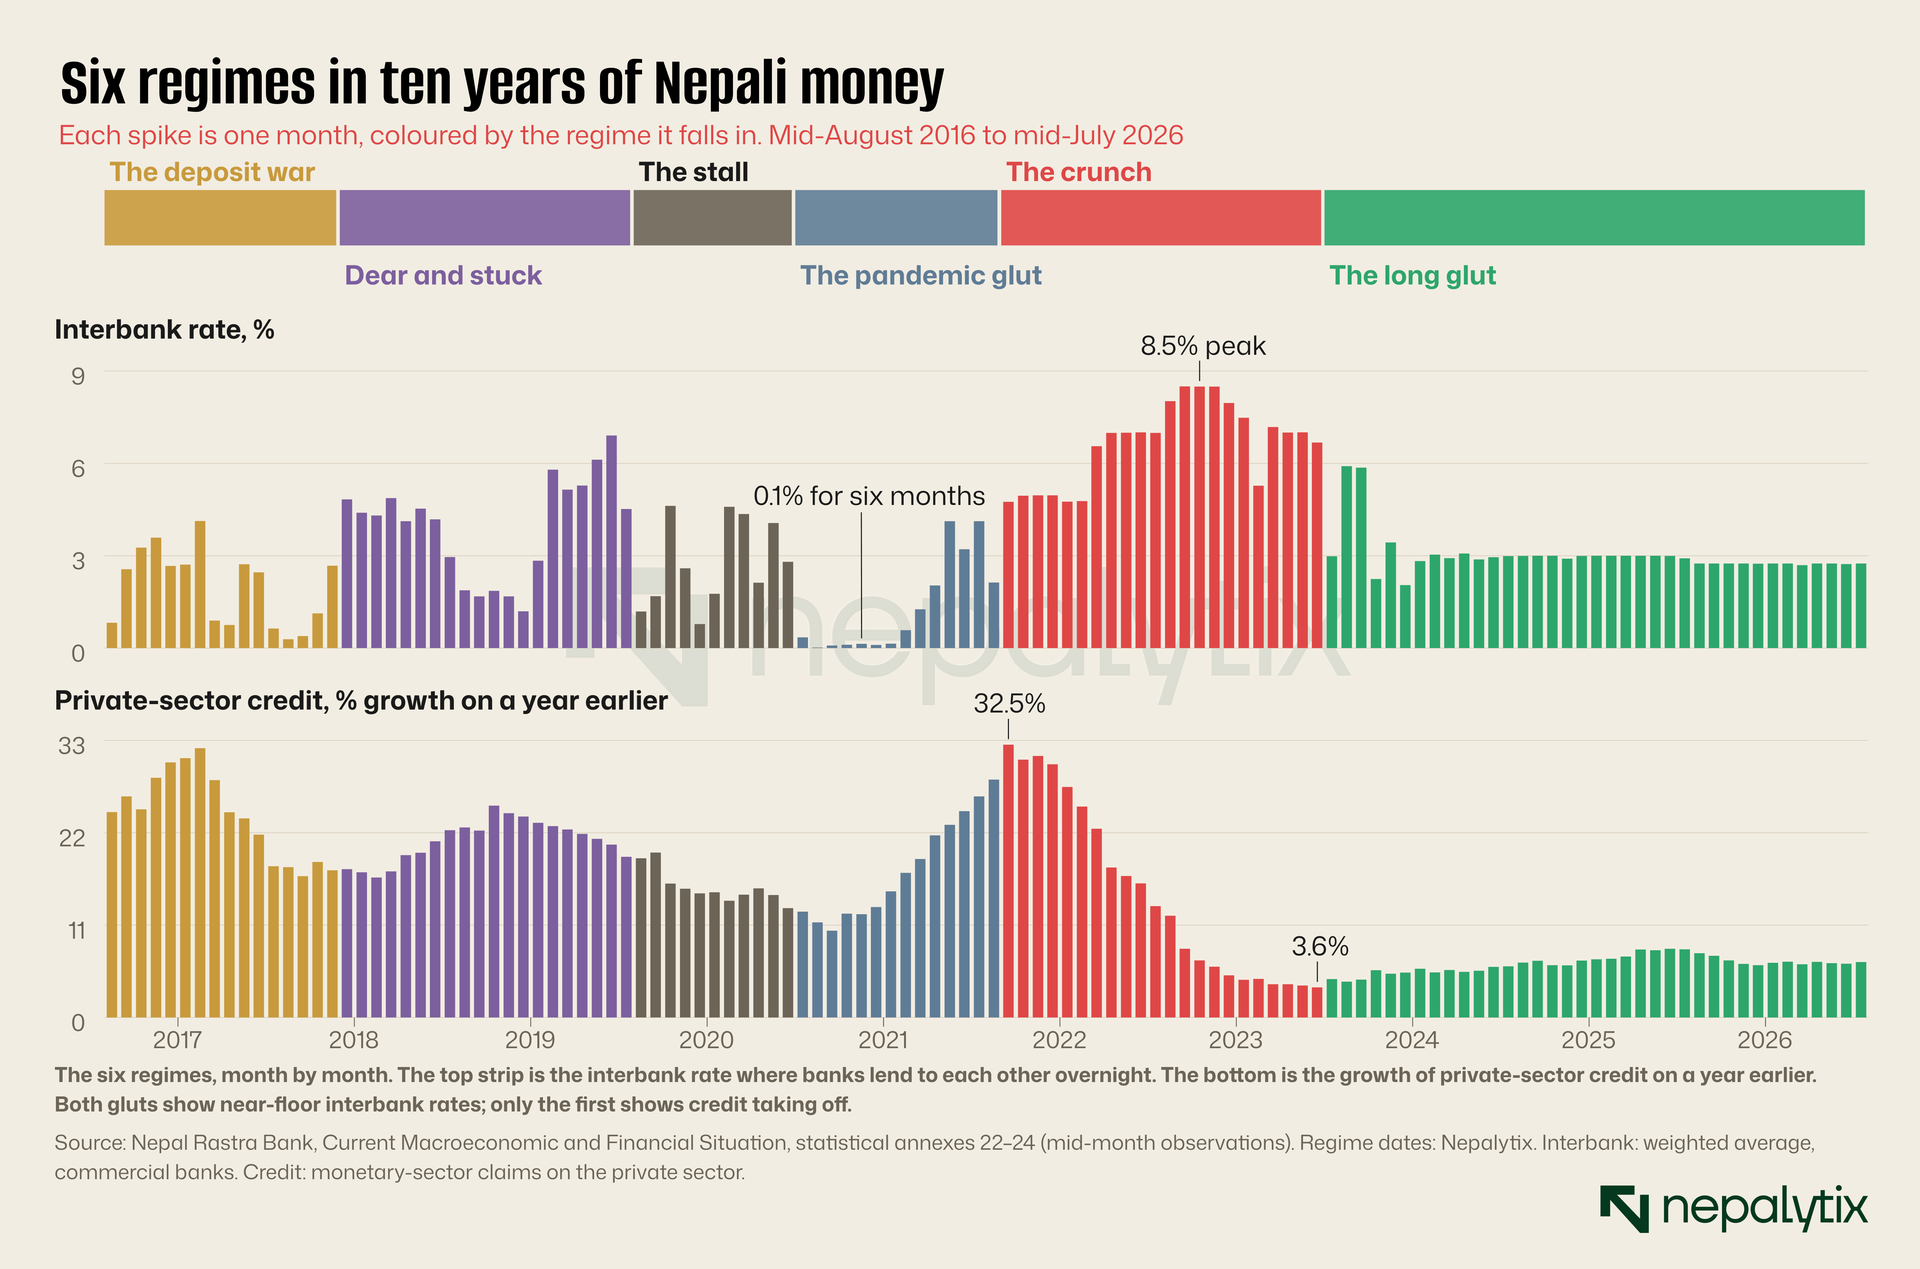
The deposit war of 2016 and 2017 was a scramble for funding. Credit was growing at 25% to 32% a year and banks were also racing to meet a new capital requirement so they bid up deposit rates from 3.3% to over 6% in fifteen months. Dear and stuck, from late 2017 to mid-2019 was a long stretch of 12% lending rates in which banks lent almost every rupee they took in and the market drifted lower. The stall began in mid-2019 as credit growth slowed and ended in the pandemic. The pandemic glut from mid-2020 to August 2021, was the cheapest money Nepal had seen: the interbank rate was at or below 0.1% for six months. The crunch that followed was the most violent tightening in the series with interbank rates of 8.5% and credit growth falling from 32.5% to 3.6% in under two years. And the long glut which began in mid-2023, is the regime the country is still in.
The rest of this piece takes the regimes one at a time, then steps back to ask what the market actually responds to. The short answer which the evidence supports more strongly than we expected is that the stock market reads liquidity months in advance and that credit follows the market rather than leading it. But the size of the response depends on something the interbank rate does not measure: whether there is anyone to lend the money to.
2. How money gets its price in Nepal
It helps to start with the plumbing because Nepal’s is unusual. In most economies a central bank sets a short-term rate and the banking system lends against it. In Nepal the first-order driver of liquidity is not the central bank at all. It is the remittances of Nepali workers abroad.
When a worker in Qatar or Malaysia sends money home, the dollars end up with a Nepali bank which sells them to Nepal Rastra Bank for rupees. Because the rupee is pegged to the Indian rupee, the central bank buys whatever dollars are offered at the going rate. Every dollar it buys creates new rupees in the banking system. In the first ten months of FY2082/83, from mid-July 2025 to mid-May 2026, the central bank’s net dollar purchases injected Rs 946.26 billion into the system. That is the tide. Domestic policy can lean against it but rarely reverses it.
The second force is the government. Tax revenue flows out of banks into the government’s account at the central bank and spending flows back. Nepal’s government collects through the year and spends late with a large share of its capital budget paid out in the last months of the fiscal year which ends in mid-July. That shows up very clearly in the interbank rate.
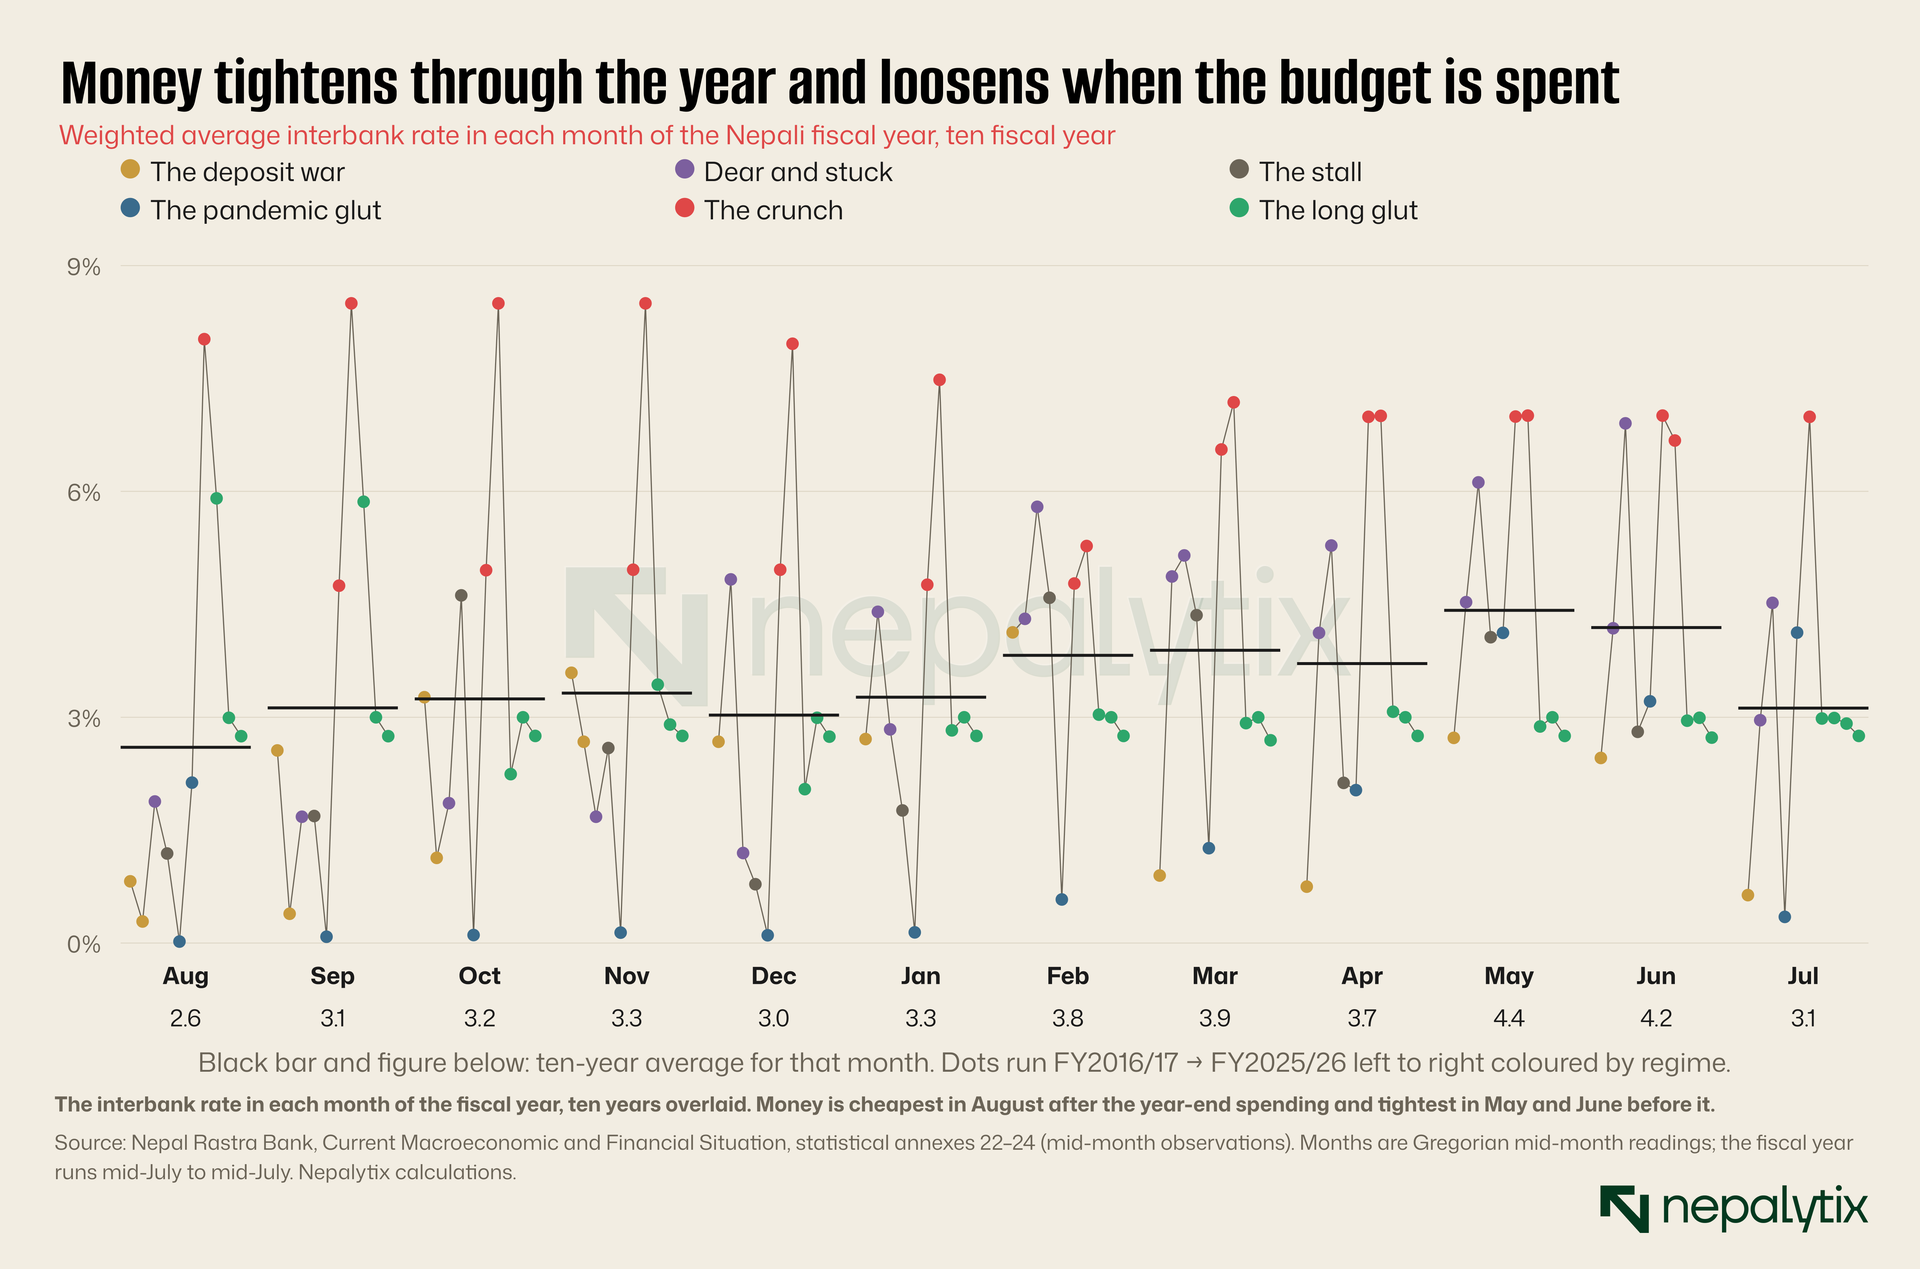
Across ten fiscal years the average interbank rate in August, the first full month of a new fiscal year was 2.6%. By May it was 4.4% and by June 4.2%. Then it fell back to 3.1% in July. The pattern is not the same every year: in the crunch, interbank rates stayed at 7% or higher from April 2022 to January 2023 regardless of the month, and in the long glut there has been almost no variation at all. But in ordinary years Nepali banks enter the fiscal year flush and end it short.
The third force is the central bank itself. Since 2016 Nepal Rastra Bank has operated an interest rate corridor. The floor is the rate at which it absorbs surplus funds from banks, now through a standing deposit facility. The ceiling is the rate at which it lends overnight against collateral, the standing liquidity facility. Between them sits the policy rate which is the rate the central bank aims to hold the interbank market near. In mid-July 2017 the corridor ran from 3% to 7% around a policy rate of 5%. In mid-July 2021, at the bottom of the pandemic cycle, it ran from 1% to 5% around 3%. In mid-July 2023 it was 5.5% to 7.5% around 7%. By mid-July 2026 it was 2.75% to 5.75% around 4.25%.
The corridor sets bounds, not levels. When the system is short, the interbank rate climbs toward the ceiling; when it is flush, it falls toward the floor. In the long glut, the interbank rate has sat on the floor for almost three years. It was 2.99% in mid-July 2024, 2.92% a year later and 2.75% in mid-July 2026, the floor rate exactly. Between those dates the central bank has spent much of its effort not injecting money but taking it out. In the first ten months of FY2082/83 it absorbed Rs 716.7 billion through deposit-collection auctions, Rs 111.9 billion through the standing deposit facility and Rs 200 billion through its own bonds. The auctions have continued into the new fiscal year: on 9 October 2026 it offered to take Rs 70 billion for 61 days.
The fourth piece is how banks price loans. Since 2012 Nepali banks have priced most loans as a premium over a base rate, which each bank computes from its own cost of funds, statutory reserves and operating costs. When deposit rates fall, base rates follow with a lag of a few months and loan rates follow the base rate. The average base rate of commercial banks was 10.03% in mid-July 2023 and 4.83% in mid-July 2026. The chain from deposit rate to base rate to lending rate is why the lending rate is the slowest of the four prices to move and why, when it does move, it is mostly a consequence of what has already happened to deposits.
So a Nepali glut usually looks like this. Remittances rise or imports fall and the central bank’s dollar purchases flood the system with rupees. Banks with more deposits than they can lend, stop competing for funding and cut deposit rates. Base rates and loan rates follow. The interbank rate drops to the floor of the corridor and the central bank starts mopping up. A crunch runs the same chain backward: imports surge, reserves fall, rupees drain out of the system, banks fight for deposits, and everything gets dearer, starting with the interbank rate and ending with the loan rate.
3. The deposit war, 2016–17
The decade opens at the top of a boom. NEPSE closed at 1,881.45 on 27 July 2016, then its all-time high, after a rally of about 80% over the previous twelve months. Private-sector credit was growing at 24.5% a year in August 2016 and still accelerating. Deposit rates were extraordinarily low: the average commercial bank paid 3.30% in August 2016 and the 91-day Treasury bill yielded 0.4%.
Two things turned that around. The first was arithmetic. Loans were growing faster than deposits: in February 2017, credit growth peaked at 32.1% against deposit growth of 20.2%. Lending at that pace soon runs into the regulator’s lending ceiling, which ties a bank’s loans to its core capital and deposits. Banks that wanted to keep lending had to raise deposits and the only way to raise deposits quickly was to pay more for them.
The second was capital. The central bank’s monetary policy for FY2072/73 had required commercial banks to raise their paid-up capital to Rs 8 billion by mid-July 2017, four times the old minimum. Banks met it through rights issues, bonus shares and mergers and every one of those routes needed either investors or deposits to expand into. The rights issues absorbed investors cash; the larger balance sheets needed funding.
The result was a scramble. The average deposit rate rose from 3.30% in August 2016 to 6.15% in July 2017 and stayed above 6% for the next three years. The average lending rate rose from 8.9% to 11.3% over the same eleven months. The interbank rate, oddly, stayed low through most of the period, averaging 2.0% across the sixteen months with spikes to 3% to 4% in late 2016 and February 2017. The war was being fought over retail deposits, not wholesale liquidity: banks were short of funding they could count on for a year not of cash for the night.
The market noticed. NEPSE fell from its July 2016 peak to 1,252.50 on 12 February 2017, a drop of a third in seven months with the low coming in the same month that credit growth peaked. It recovered to about 1,700 by April, on the back of the capital-raising season and then drifted. Over the regime as a whole, from mid-July 2016 to mid-November 2017, the index lost 14% and the banking sub-index 21%.
The deposit war is worth remembering because it shows a pattern that repeats through the decade. The market turned well before the cost of loans did. The first serious fall came while lending rates were still between 9% and 10%. By the time the average lending rate passed 11%, in June 2017, the steepest part of the decline was over. The stock market was reacting to the scramble for deposits not to its consequences for borrowers.
4. Dear and stuck, then the stall
From December 2017 to July 2019, Nepali money was dear and stayed dear. The average lending rate of commercial banks held between 11.2% and 12.5% for twenty months. The deposit rate settled between 6.2% and 6.7%. The interbank rate moved around a lot, from 1.2% to 6.9%, and averaged 4.0%. Credit growth did not collapse: it ran between 16.7% and 25.2%.
What made the regime distinctive was how fully banks were lent out. Private-sector credit, measured in the monetary survey, was equal to 89 rupees of every 100 deposited in mid-July 2018 and 90 a year later, against 84 in mid-July 2016. On that basis the system was close to fully lent with little room to grow loans faster than deposits. Every rupee of new lending needed a new rupee of deposits and banks competed for them by holding rates up. Over the twenty months, deposits rose by Rs 826 billion and private credit by Rs 766 billion.
The stock market spent the regime going sideways to down. NEPSE fell from 1,505 in mid-November 2017 to a low of 1,100.58 on 3 March 2019, then recovered a little, ending the regime at 1,255. The banking sub-index lost 12%. There was no crash, just twenty months of drift under a 12% cost of borrowing.
Then, from mid-2019, credit growth started to slow on its own. It fell from 19.1% in July 2019 to 15.9% by October and 13.9% by February 2020. Deposits kept coming in at 15% to 18% a year. Interbank rates dipped. The average lending rate slipped from 12.1% to 11.9%. We call this the stall. NEPSE briefly rallied to 1,632 in late February 2020 and then the pandemic arrived.
The exchange stopped trading normally on 22 March 2020, opened for two sessions in mid-May and resumed on 29 June 2020 at 1,188.71. During those three months the economy shut. Imports collapsed, remittances held up better than almost anyone expected and the rupees the central bank created when it bought those dollars had nowhere to go but bank deposits.
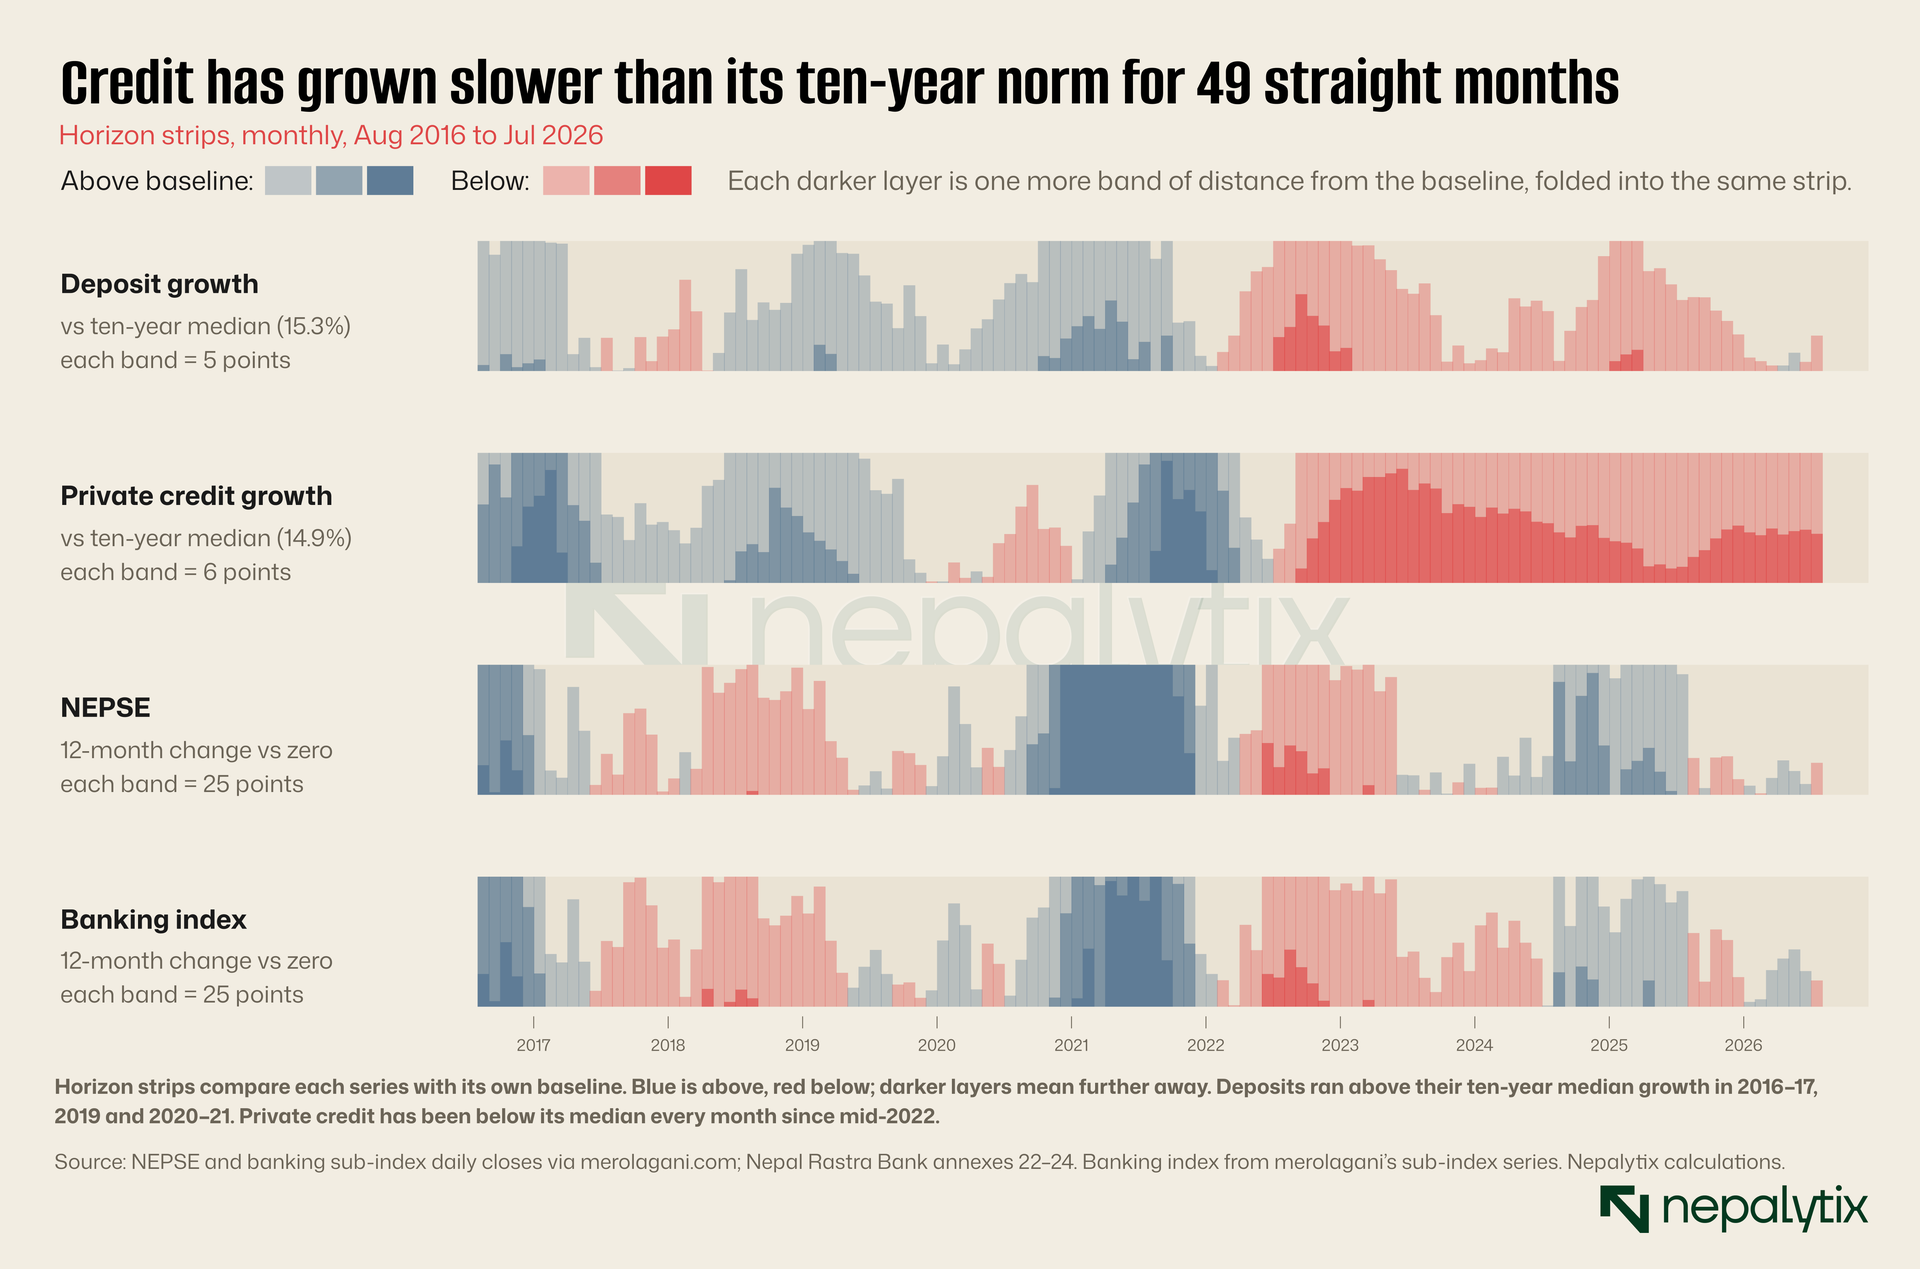
The horizon strips show the same ten years from another angle. Deposit growth has run above its ten-year median of 15.3% in three stretches: 2016–17, 2019 and most strongly from mid-2020 to early 2022. Credit growth against its own median of 14.9%, ran above in 2016–17 through most of 2018 and 2019 and in 2021. NEPSE’s twelve-month change ran deeply positive only once in the period from the end of 2020 to the end of 2021. The banking sub-index tracks NEPSE but with smaller moves in both directions.
The bottom-right corner of the credit strip is the striking part. Credit growth has been below its ten-year median in every one of the last 49 months. At no point in the long glut did it even return to its median. In the pandemic glut, by contrast, credit went from below median to the darkest blue band within a year. The rest of this piece is, in one way or another, an attempt to explain that difference.
5. The pandemic glut, 2020–21
From July 2020 to August 2021, Nepal had the cheapest money in its modern history. The weighted average interbank rate was 0.00% in mid-August 2020 and 0.1% or less every month from then until January 2021. The 91-day Treasury bill yield fell to 0.1%. The central bank cut its policy rate to 3%, lowered the cash reserve ratio to 3%, opened a refinance window and allowed banks to restructure and defer loans to pandemic-hit borrowers.
Lending rates followed. The average lending rate of commercial banks fell from 10.1% in mid-July 2020 to 8.4% by mid-July 2021. That is a large cut but notably smaller than the 6-point fall of 2023–26. What was different about 2020 was what happened next.
Credit took off. Private-sector credit growth bottomed at 10.3% in September 2020 and then accelerated every month for a year: 13.1% by December, 18.9% by March 2021, 24.6% by June and 28.3% by August 2021 before peaking at 32.5% in September. Over the fourteen months of the regime, deposits rose by Rs 920 billion and private-sector credit by Rs 910 billion. Almost every new rupee deposited was lent.
The money went into the economy that reopened: imports of vehicles, consumer goods and construction materials, working capital for traders, real estate and housing. And a good part of it went into shares. The central bank’s FY2020/21 monetary policy raised the loan-to-value ratio on margin loans against listed shares from 65% to 70%. Initial public offerings were oversubscribed many times over. Daily turnover on the exchange broke records repeatedly.
NEPSE rose from 1,188.71 on 29 June 2020 to 3,198.60 on 18 August 2021. That is a gain of 169% in fourteen months, the largest bull market in the index’s history. The banking sub-index rose by 108% over the regime, less than the main index because the strongest gains came in hydropower, insurance and microfinance stocks but still a doubling. Of the twelve months to June 2021, NEPSE’s trailing return was 151%.
The pandemic glut is the episode most people in Nepal’s market have in mind when they talk about “liquidity”. It established a model: rates fall, money becomes cheap, the market rallies. The model is not wrong, but it is incomplete. In 2020 and 2021 three conditions held at once. Money was cheap. Borrowers wanted it because the economy was reopening and import demand was surging. And banks were willing and allowed to lend it including against shares. Remove either of the last two and the first does much less.
The glut also carried the seeds of the crunch. Credit growing at 30% a year in an economy growing at 4% to 5% has to be paid for somewhere. In Nepal it was paid for through imports which surged as the loans were spent and through foreign-exchange reserves which fell as the central bank sold dollars to pay for them. By the second half of 2021 the system that had been flooded with rupees a year earlier was running short.
6. The crunch, 2021–23
The crunch arrived quickly. The interbank rate, 2.1% in August 2021 was 4.7% in September and 5.0% by October. It reached 7.0% in April 2022 and 8.5% from September to November 2022. The 91-day Treasury bill yield rose from 0.7% in August 2021 to 10.9% in November 2022. Banks bid deposit rates up from 4.8% to 8.5% by December 2022 and the average lending rate rose from 8.5% to a peak of 13.0% in February and March 2023.
The central bank tightened with the market. The policy rate went from 3% in mid-2021 to 5.5% by mid-2022 and 7% by mid-2023. The cash reserve ratio went back to 4%. The FY2021/22 monetary policy capped margin lending at Rs 40 million per individual from one bank or financial institution and Rs 120 million across the system. Imports of some non-essential goods were restricted in 2022 to protect reserves.
Credit growth collapsed. From 32.5% in September 2021, it fell to 22.5% by March 2022, 13.3% by July, 6.8% by October and 4.0% by March 2023. It bottomed at 3.6% in June 2023, the lowest reading in the series. In twenty-two months, the growth rate of private-sector credit fell by nearly nine-tenths.
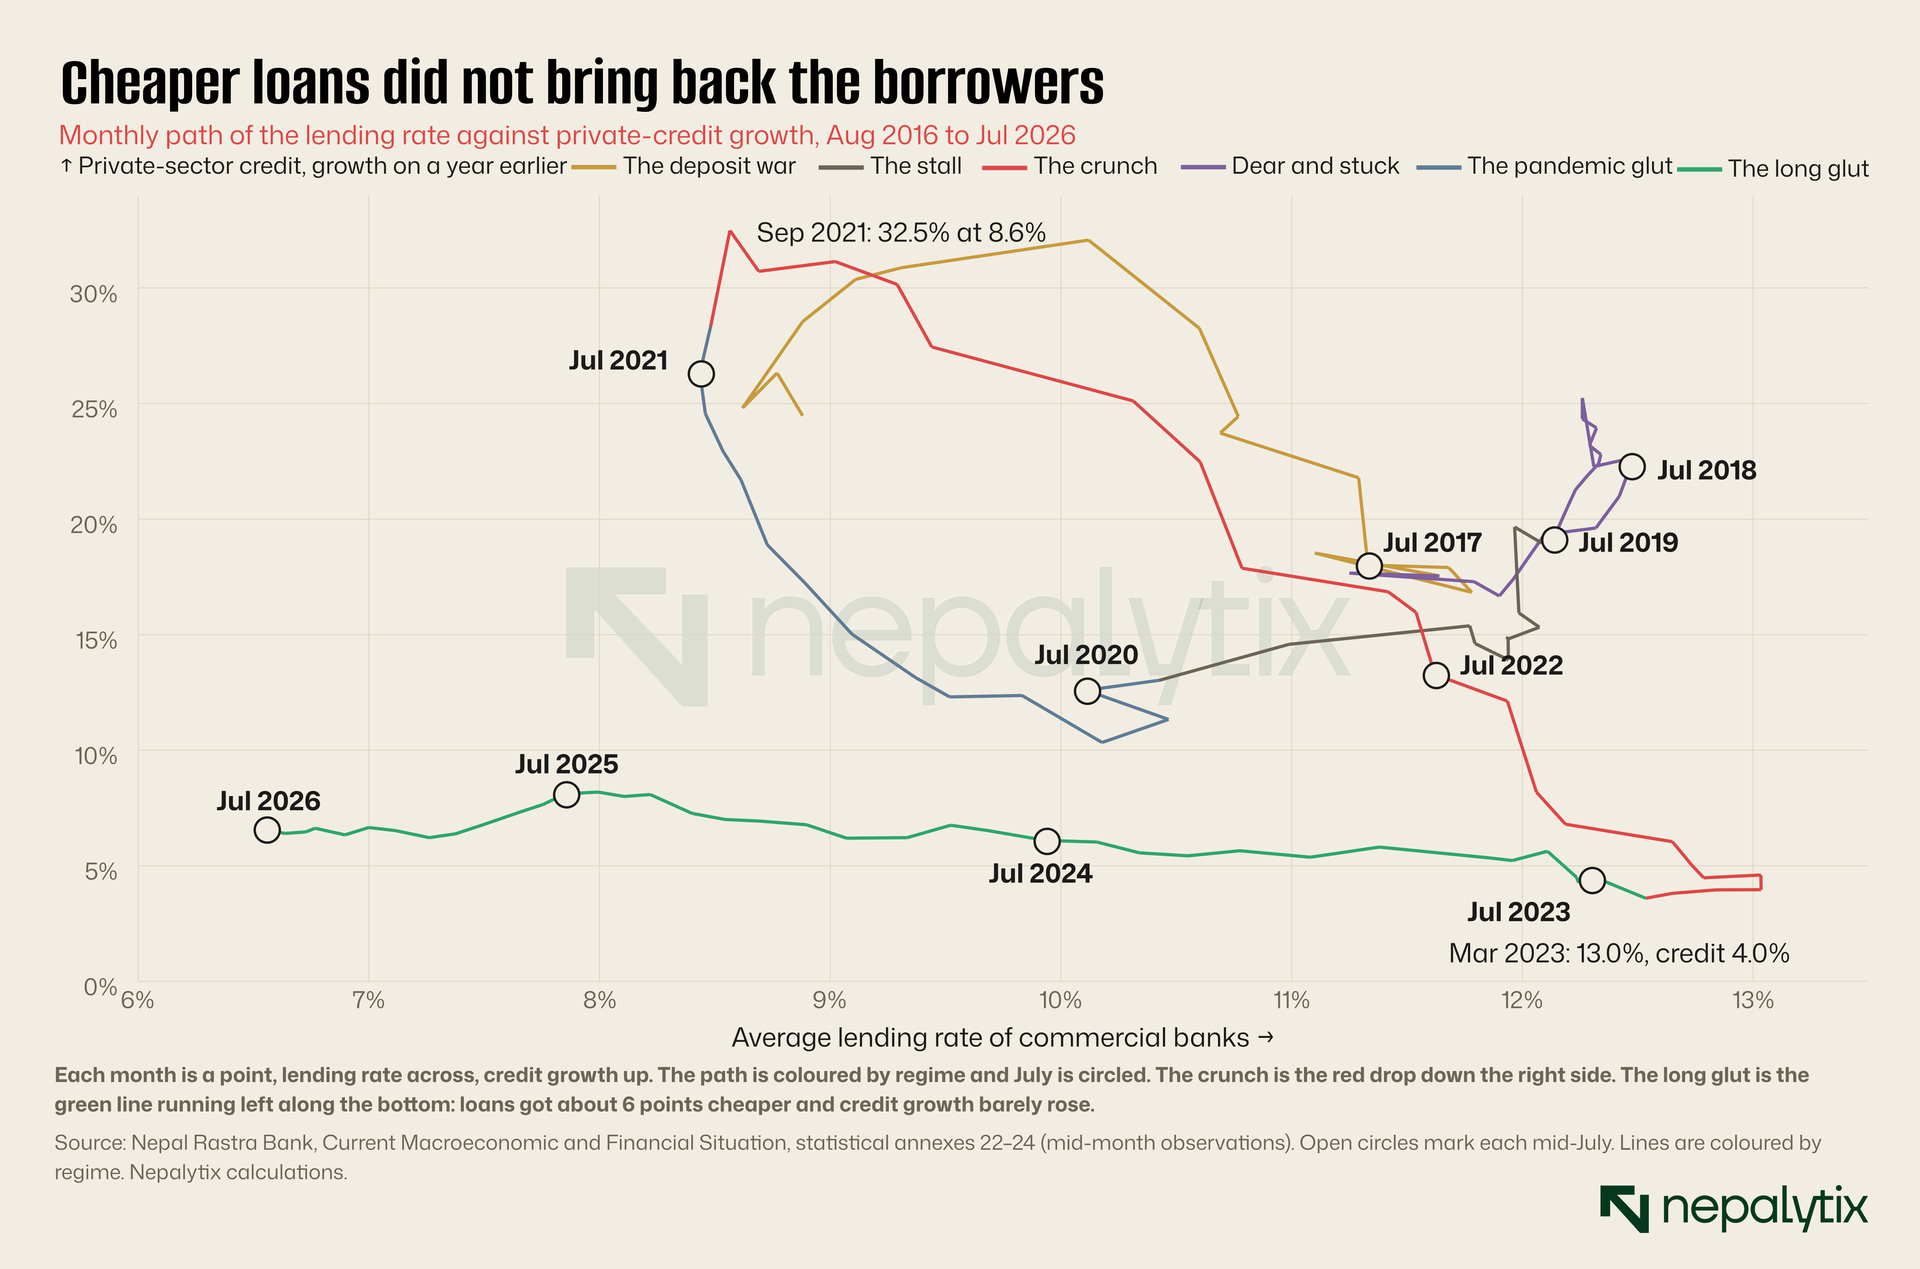
Tracing the lending rate against credit growth month by month makes the shape of the decade visible. The deposit war runs up and to the right as credit growth peaked and lending rates rose. Dear and stuck is a tight knot around 12% and 20%. The pandemic glut climbs almost vertically on the left from 12.6% credit growth at a 10.1% lending rate in July 2020 to 26.3% at 8.4% a year later. The crunch, in red, swings back across the top and falls down the right-hand side ending at 4.6% credit growth and a 12.3% lending rate in July 2023.
And then the long glut does something the earlier regimes did not. It travels almost horizontally. Between July 2023 and July 2026 the average lending rate fell from 12.3% to 6.6%, the largest fall in the series. Credit growth went from 4.6% to 6.1%, 8.1% and then back to 6.6%. In 2020–21, a fall of under two points in the lending rate came with a rise of about fourteen points in credit growth. In 2023–26, a fall of almost six points came with a rise of two.
The market had fallen well before the lending rate peaked. NEPSE dropped from its August 2021 high to 2,009 by mid-July 2022 and to a low of 1,815.13 on 25 September 2022, a fall of 43%. The banking sub-index fell from 2,175 in July 2021 to 1,133.47 on 6 December 2023, a decline of almost half that ran into the start of the next regime. By the time lending rates hit their 13.0% peak in early 2023, NEPSE had already done most of its falling. Over the crunch as we date it, the index lost 35% and the banking sub-index 42%.
The crunch did lasting damage in one place the stock market cares about: bank balance sheets. Loans made at 8% in 2021 were repriced to 12% and 13% in 2022 and 2023, as base rates rose. Borrowers who had taken on debt to import, build or speculate found themselves paying half as much again in interest within two years. Non-performing loans began to climb and by mid-June 2026 they were 5.6% of loans. That legacy is one of the reasons the next glut did not behave like the last one.
7. The long glut, 2023–26
The turn came in mid-2023. Imports, held down by high rates and restrictions, stayed weak. Remittances kept rising. The central bank bought the dollars and the rupees piled up. The interbank rate, at 6.7% in June 2023, fell to 3.0% in mid-July. After a brief rebound to 5.9% in August and September, it settled around 3% from October and has barely moved since. From May 2024 to July 2026, every monthly reading was between 2.69% and 3.0%.
Every other price followed, in order. The 91-day Treasury bill yield fell from 6.35% in July 2023 to 3.0% by March 2024 and has mostly been between 2% and 3% since. Taking mid-July readings, the average deposit rate fell from 7.86% in 2023 to 5.77% in 2024, 4.19% in 2025 and 3.21% in 2026. The base rate fell from 10.03% to 4.83%, and the average lending rate from 12.30% to 6.55%. The policy rate went from 7% in mid-2023 to 5.5% by mid-2024 and 5% by mid-2025; the July 2025 policy cut it to 4.5% and the first review of that policy to 4.25%, with the corridor narrowed to 2.75%–5.75%.
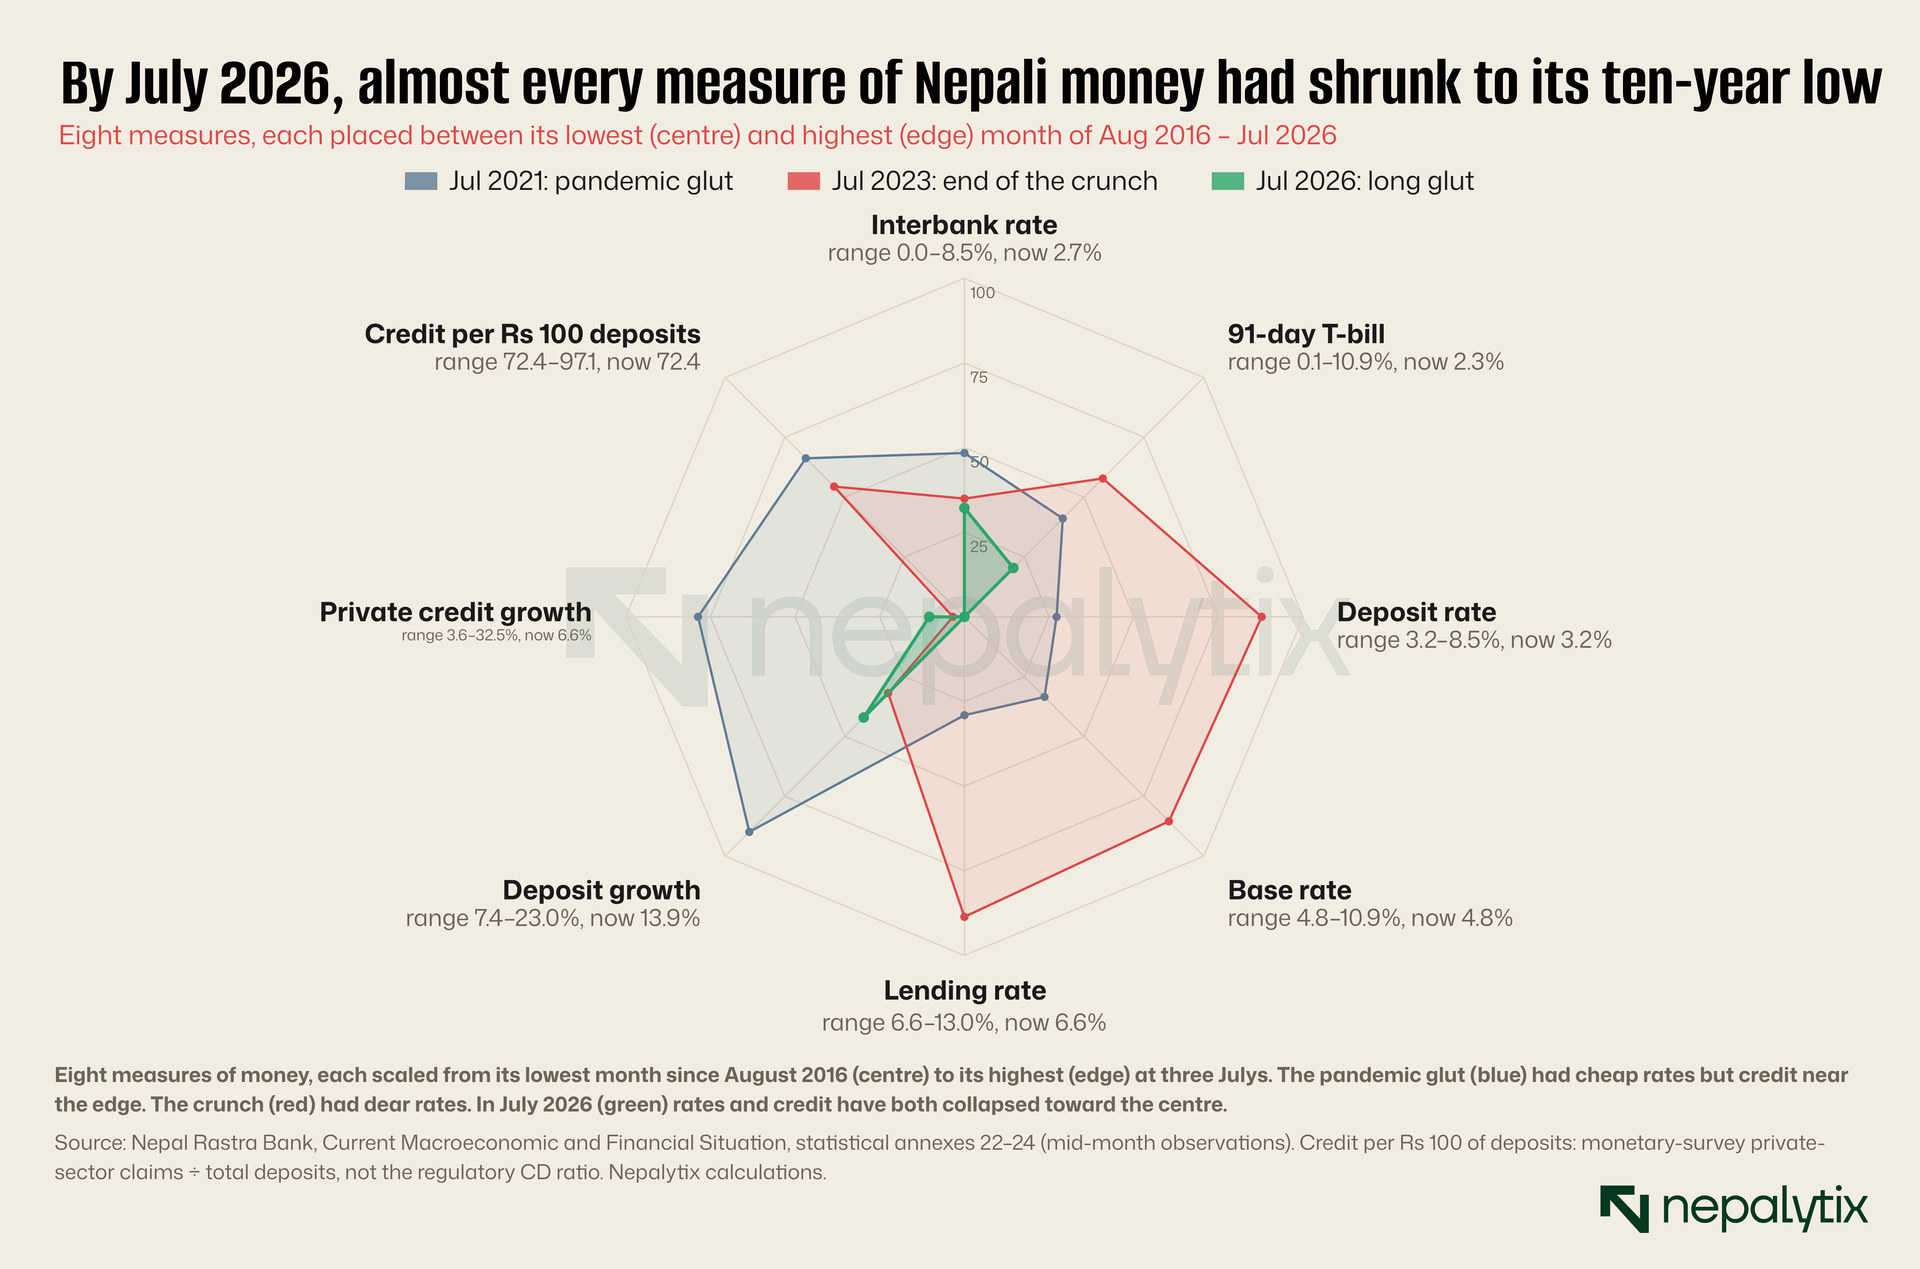
Comparing three Julys shows how unusual the current shape is. In July 2021 rates were low but credit growth, deposit growth and the share of deposits lent were all near the top of their ranges. In July 2023 the shape flipped: deposit, base and lending rates near their highs, credit growth at its floor. By July 2026 the polygon has shrunk on almost every axis at once. By mid-July 2026, the average deposit rate, base rate and lending rate were each the lowest of 120 monthly readings. Private-sector credit was equal to 72.4 rupees of every 100 deposited also the lowest. Credit growth was 6.6% with only 30 of 120 months lower and every one of those 30 was in the crunch or the long glut. The interbank rate and the Treasury bill yield were not at their lows but only because the pandemic glut briefly pushed both close to zero; the floor of the corridor is higher now.
It is worth being precise about what did not cause the glut. Deposits did not surge. Deposit growth was 12.3% in the year to mid-July 2023, 13.0% a year later, 12.6% the year after and 13.9% in mid-July 2026, peaking at 16.0% in May 2026. Those are ordinary numbers by Nepali standards: below the ten-year median of 15.3% and well below the 21% to 23% of early 2021. What changed was the other side of the balance sheet. Credit growth which had run at 17% to 25% through the dear years of 2018 and 2019, ran at 4% to 8%. A deposit base growing at an ordinary pace with loans growing at a third of their old pace, produces a surplus that compounds every year.
The question is where the money went. In the three years of the long glut, deposits rose by Rs 2,749 billion. Private-sector credit rose by Rs 1,065 billion. In the pandemic glut those two numbers were almost equal. This time banks lent less than 40 rupees of every new 100 they took in.
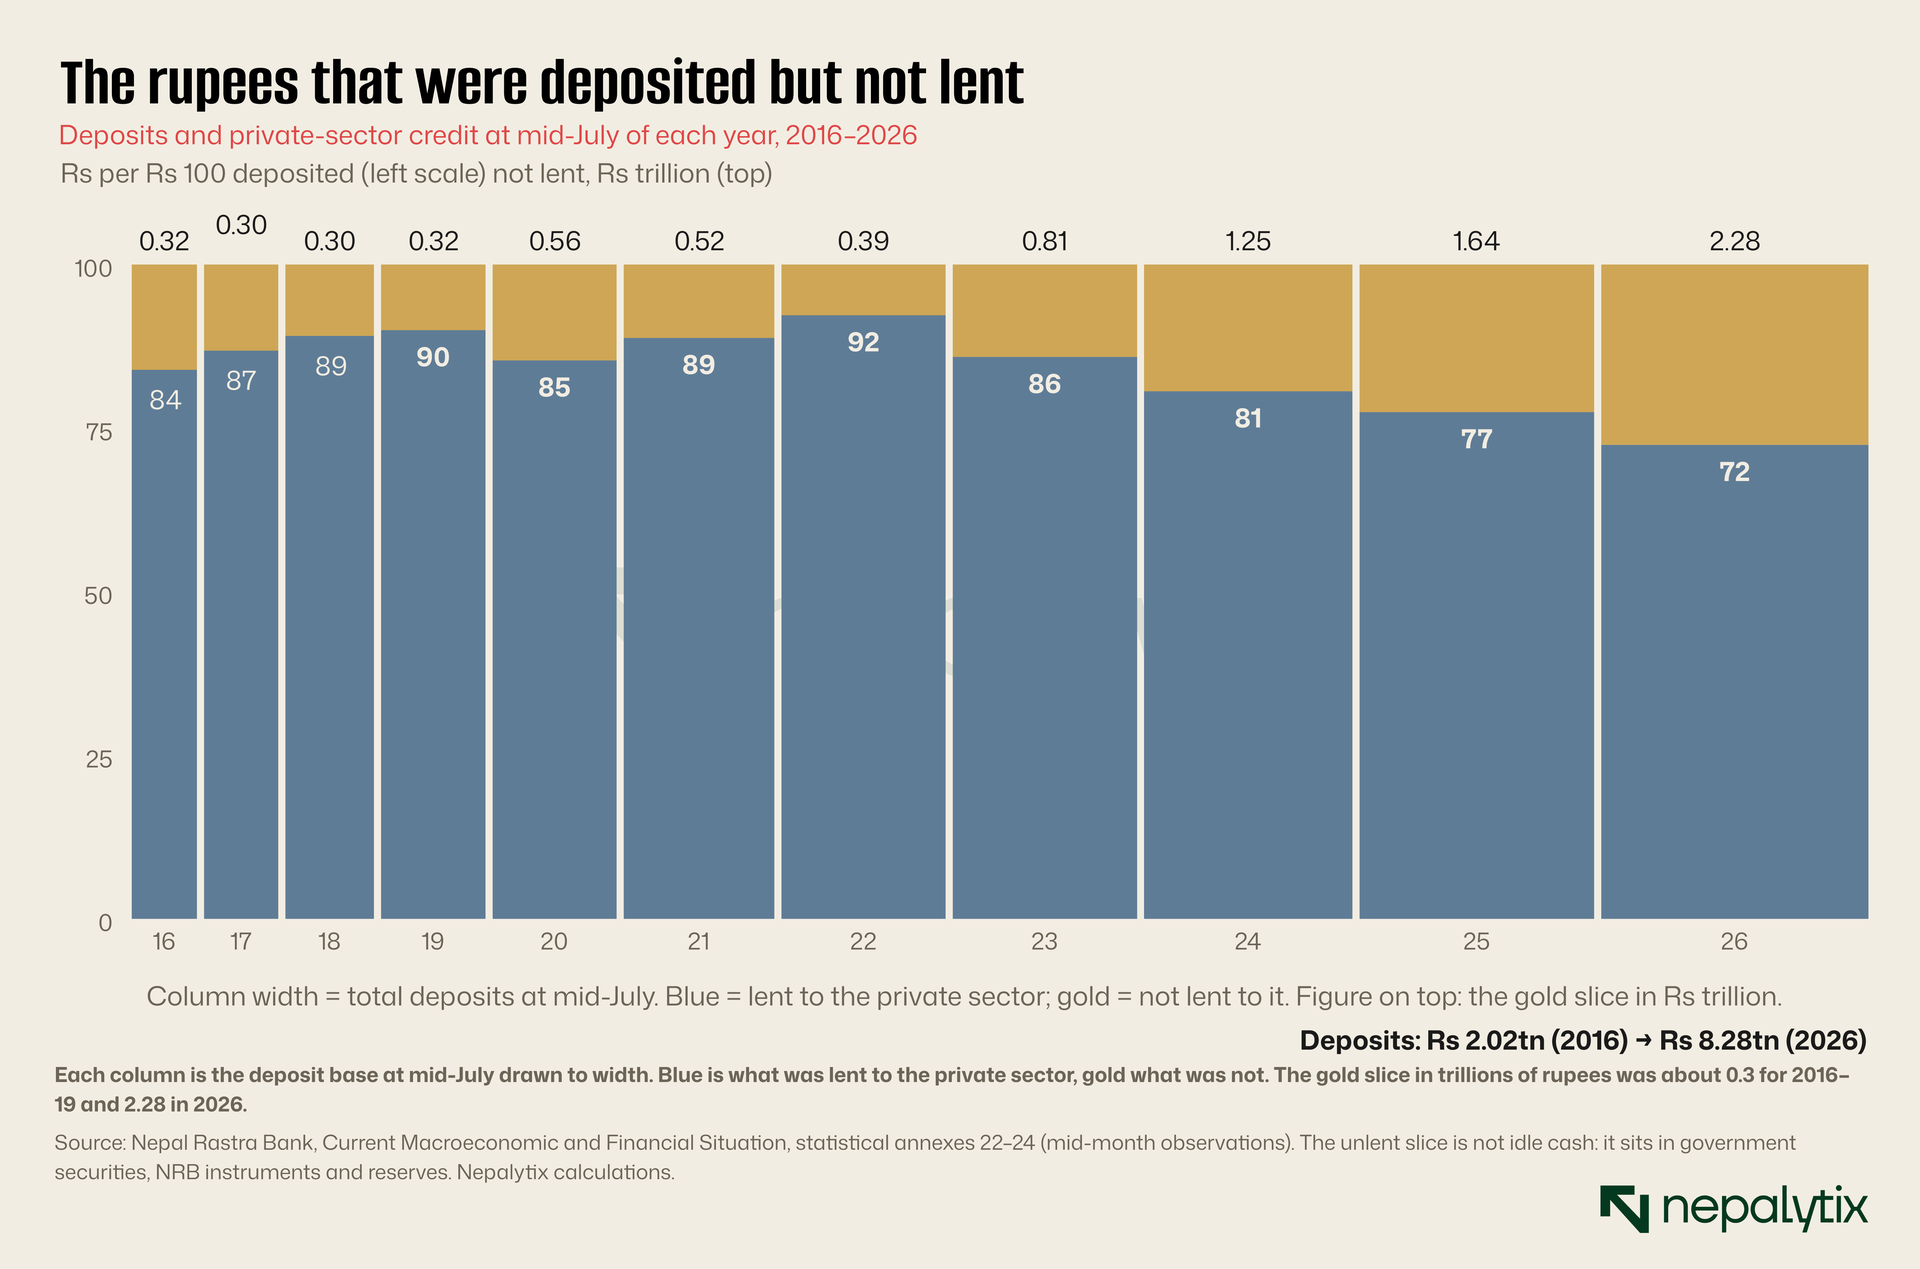
The cumulative picture is stark. In mid-July 2016, deposits were Rs 2.02 trillion and the part not lent to the private sector was about Rs 0.32 trillion. That gap barely changed until 2019 then roughly doubled in the pandemic to Rs 0.56 trillion and shrank again in the crunch, to Rs 0.39 trillion in mid-July 2022. Since then it has grown every year: Rs 0.81 trillion in 2023, Rs 1.25 trillion in 2024, Rs 1.64 trillion in 2025 and Rs 2.28 trillion in mid-July 2026 against deposits of Rs 8.28 trillion. A Kathmandu Post analysis put the system’s loans at Rs 5,915 billion against deposits of Rs 8,268 billion as of 21 July 2026, the same picture on a slightly different basis.
The gap is not idle cash in vaults. It sits in Treasury bills and development bonds in the central bank’s deposit-collection auctions and standing deposit facility, and in statutory reserves. Banks earn something on it but very little: the 91-day bill yielded 2.32% in mid-July 2026 and the floor of the corridor was 2.75%. On deposits that cost them about 3.2% on average, they make a small loss or close to nothing on the unlent part of their balance sheet. That is why they cut deposit rates so far and why they are so keen to lend.
The demand is not there. Credit demand has been weak for two years by any measure and official projections have been missed: the July 2025 policy projected private-sector credit growth of 12% for FY2025/26, and the outturn in mid-July 2026 was 6.6%. The regulator has spent the period loosening almost every constraint it could find. It removed the Rs 120 million system-wide cap on margin lending in October 2023 and replaced it with limits of Rs 150 million for individuals and Rs 200 million for institutions. It removed the institutional cap in the FY2024/25 policy. It raised the individual limit to Rs 250 million in July 2025, cut the risk weight on such loans from 125% to 100% in August 2025, and lifted the limit entirely that October. The FY2026/27 policy announced on 7 July 2026 raised the ceiling on private housing loans from Rs 20 million to Rs 30 million.
None of it has produced 2021-style credit. Margin loans against shares, the channel most directly connected to the stock market, have grown: from Rs 76.5 billion in mid-July 2023 to Rs 162.9 billion by mid-June 2026. But that is still only 2.7% of total loans. The economy-wide constraint is not the cost of a loan or the rules about collateral. It is that households and businesses that borrowed at 8% in 2021 were repriced to 13% in 2023 and are now carrying bad loans and restructured debt are not lining up to borrow again. And banks with non-performing loans of 5.6% are not keen to find new ones.
The stock market has reflected that. NEPSE rose from 2,042 in mid-June 2023 to 2,664 on 3 November 2026, a gain of 30% in a little over three years. Most of that came in one burst: the index went from 2,053 at the start of July 2024 to 3,000.81 on 15 August 2024, a 46% move in six weeks. It touched 3,002.07 on 29 July 2025, its high for the regime and has traded between about 2,450 and 3,000 since. The banking sub-index is also up 30%, to 1,602.06. Those are respectable numbers, but they are a fraction of what the previous glut delivered from a market that was already pricier to start with.
8. What the market actually reads
So far we have looked at the regimes one at a time. The next question is more systematic. Across all ten years, which of these measures moves with the stock market, and which moves first?
To test that, we take NEPSE’s twelve-month return at each month-end and compare it with five monthly measures: the interbank rate, the average lending rate, the average deposit rate, deposit growth and private-sector credit growth. We then shift each measure forward and backward in time, from six months before the market’s return to twelve months after and compute the correlation at each shift. A strong correlation when the measure is shifted to an earlier date means the measure tends to move before the market. A strong correlation when it is shifted to a later date means the market moves first.
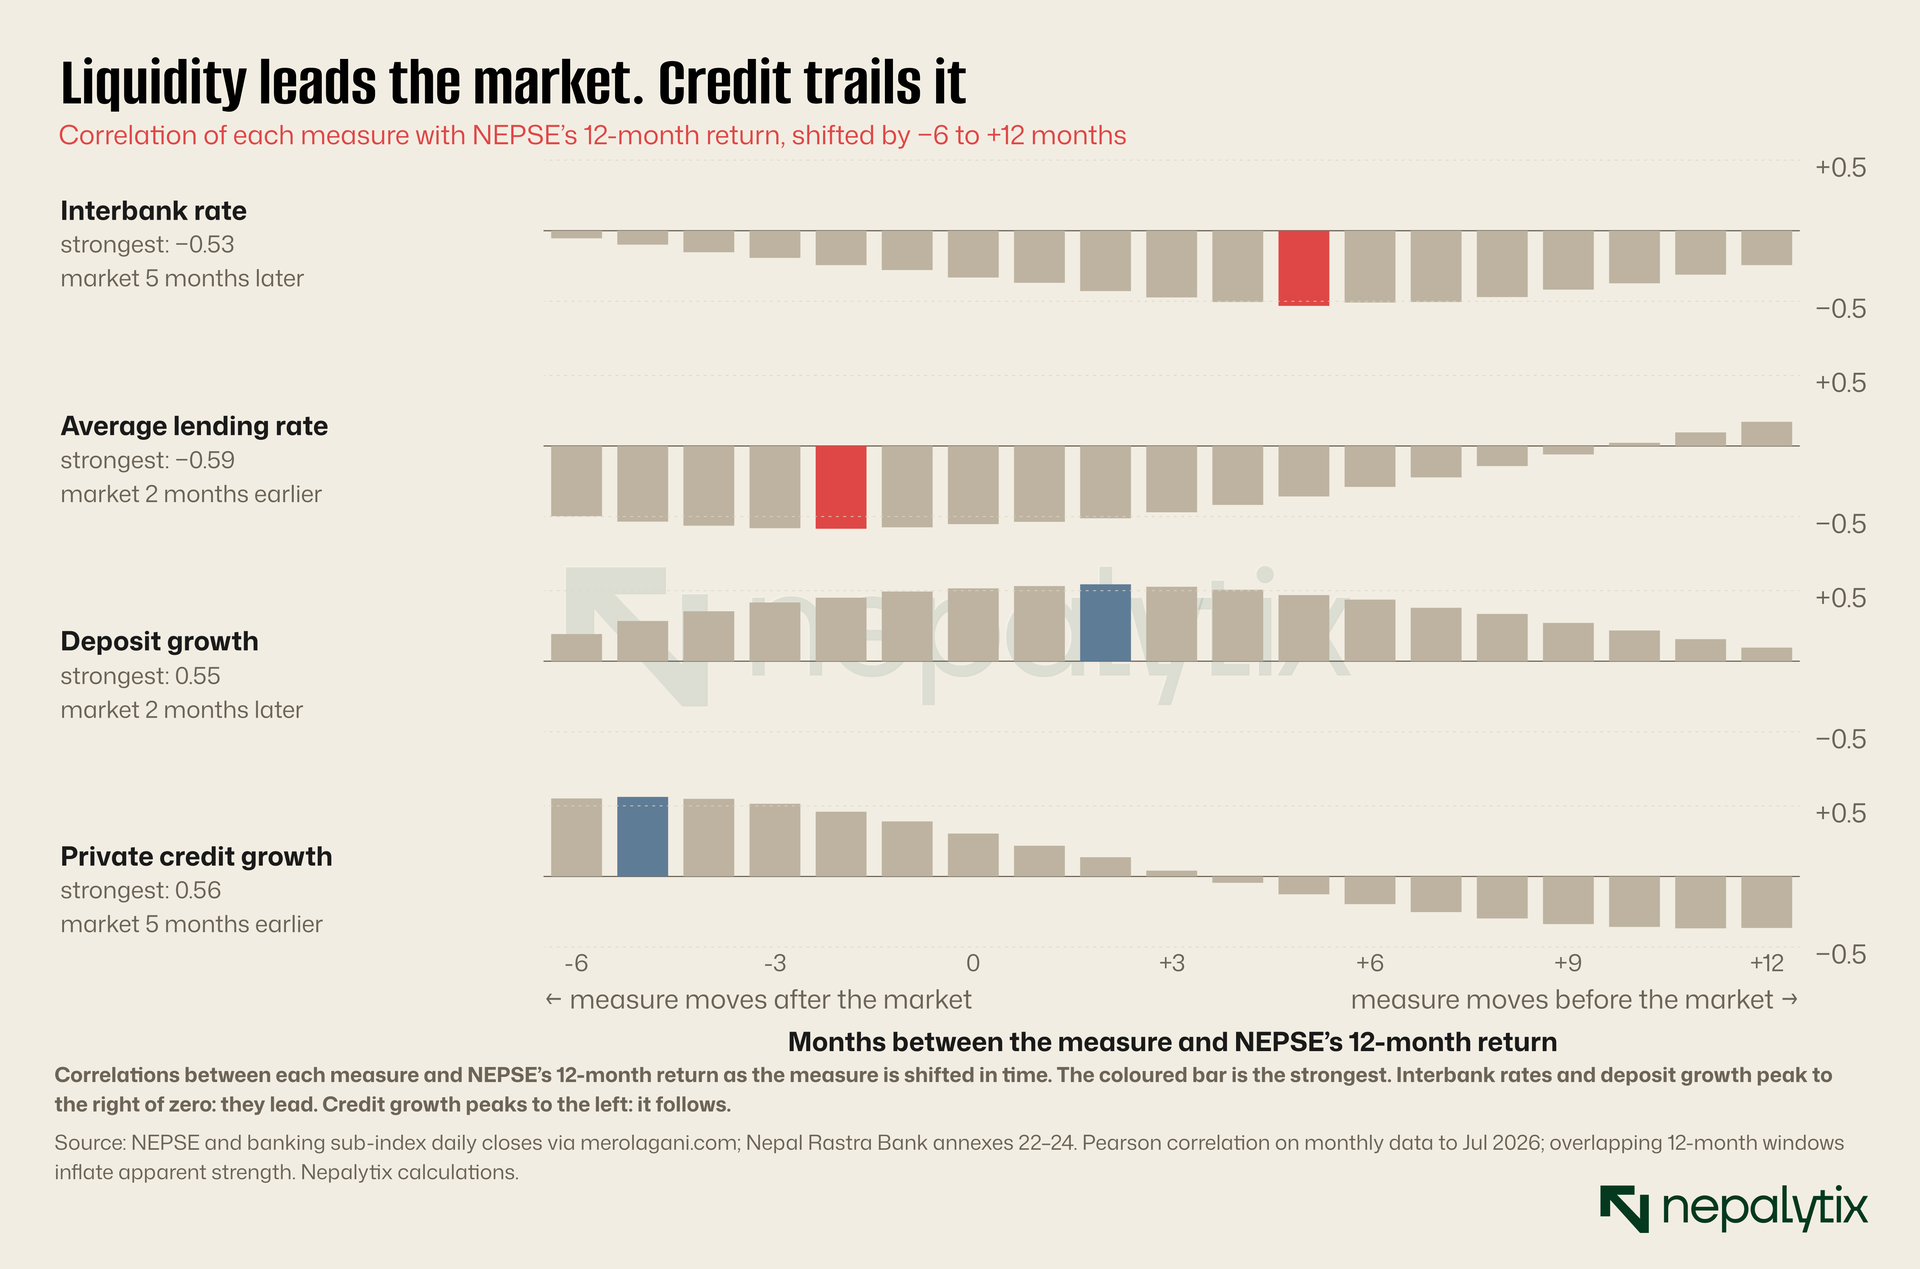
The pattern is clean and it is not the one that the usual story would predict. The interbank rate is most strongly linked to NEPSE’s return about five months later, with a correlation of −0.53: when interbank rates fall, the market tends to rise over the following months. Deposit growth leads by about two months with a correlation of 0.55. Both are measures of liquidity arriving in the system and the market appears to read them early.
The average lending rate moves roughly with the market. Its strongest correlation, −0.59, is with the return ending two months earlier. The average deposit rate behaves the same way, at −0.54 two months after the market. That fits the plumbing described earlier: lending rates are priced off base rates, which are priced off deposit costs so they lag the liquidity that the market has already reacted to.
Credit growth is the most interesting result. In the same month, it has a weak positive correlation with NEPSE’s twelve-month return, 0.30. But its strongest link, 0.56 is with the market’s return ending five months earlier. Twelve months ahead, the correlation turns negative, at −0.36. In other words, over this decade, credit growth has followed the market more than it has led it. When the market rallies, credit picks up a few months later, in part because higher share prices support more margin lending and in part because the conditions that lifted the market also lift other borrowing. By the time credit growth is at its peak, the market has often turned.
These are correlations on overlapping twelve-month windows on 120 or so monthly observations dominated by two big cycles. They overstate how reliable any of these measures is as a trading signal and they cannot separate cause from coincidence. But the ordering is consistent across all five measures and it fits the narrative in every regime. In 2016–17, the market fell while credit growth was still near its peak. In 2021 it peaked in August, a month before credit growth did. In 2022 it was falling hard while lending rates were still rising toward their peak.
The simplest form of the relationship is the one most investors already use and it holds up well. If we compare the twelve-month change in the average lending rate with NEPSE’s twelve-month return, month by month from August 2017 to July 2026, the two moved in opposite directions in 86 of 108 months.
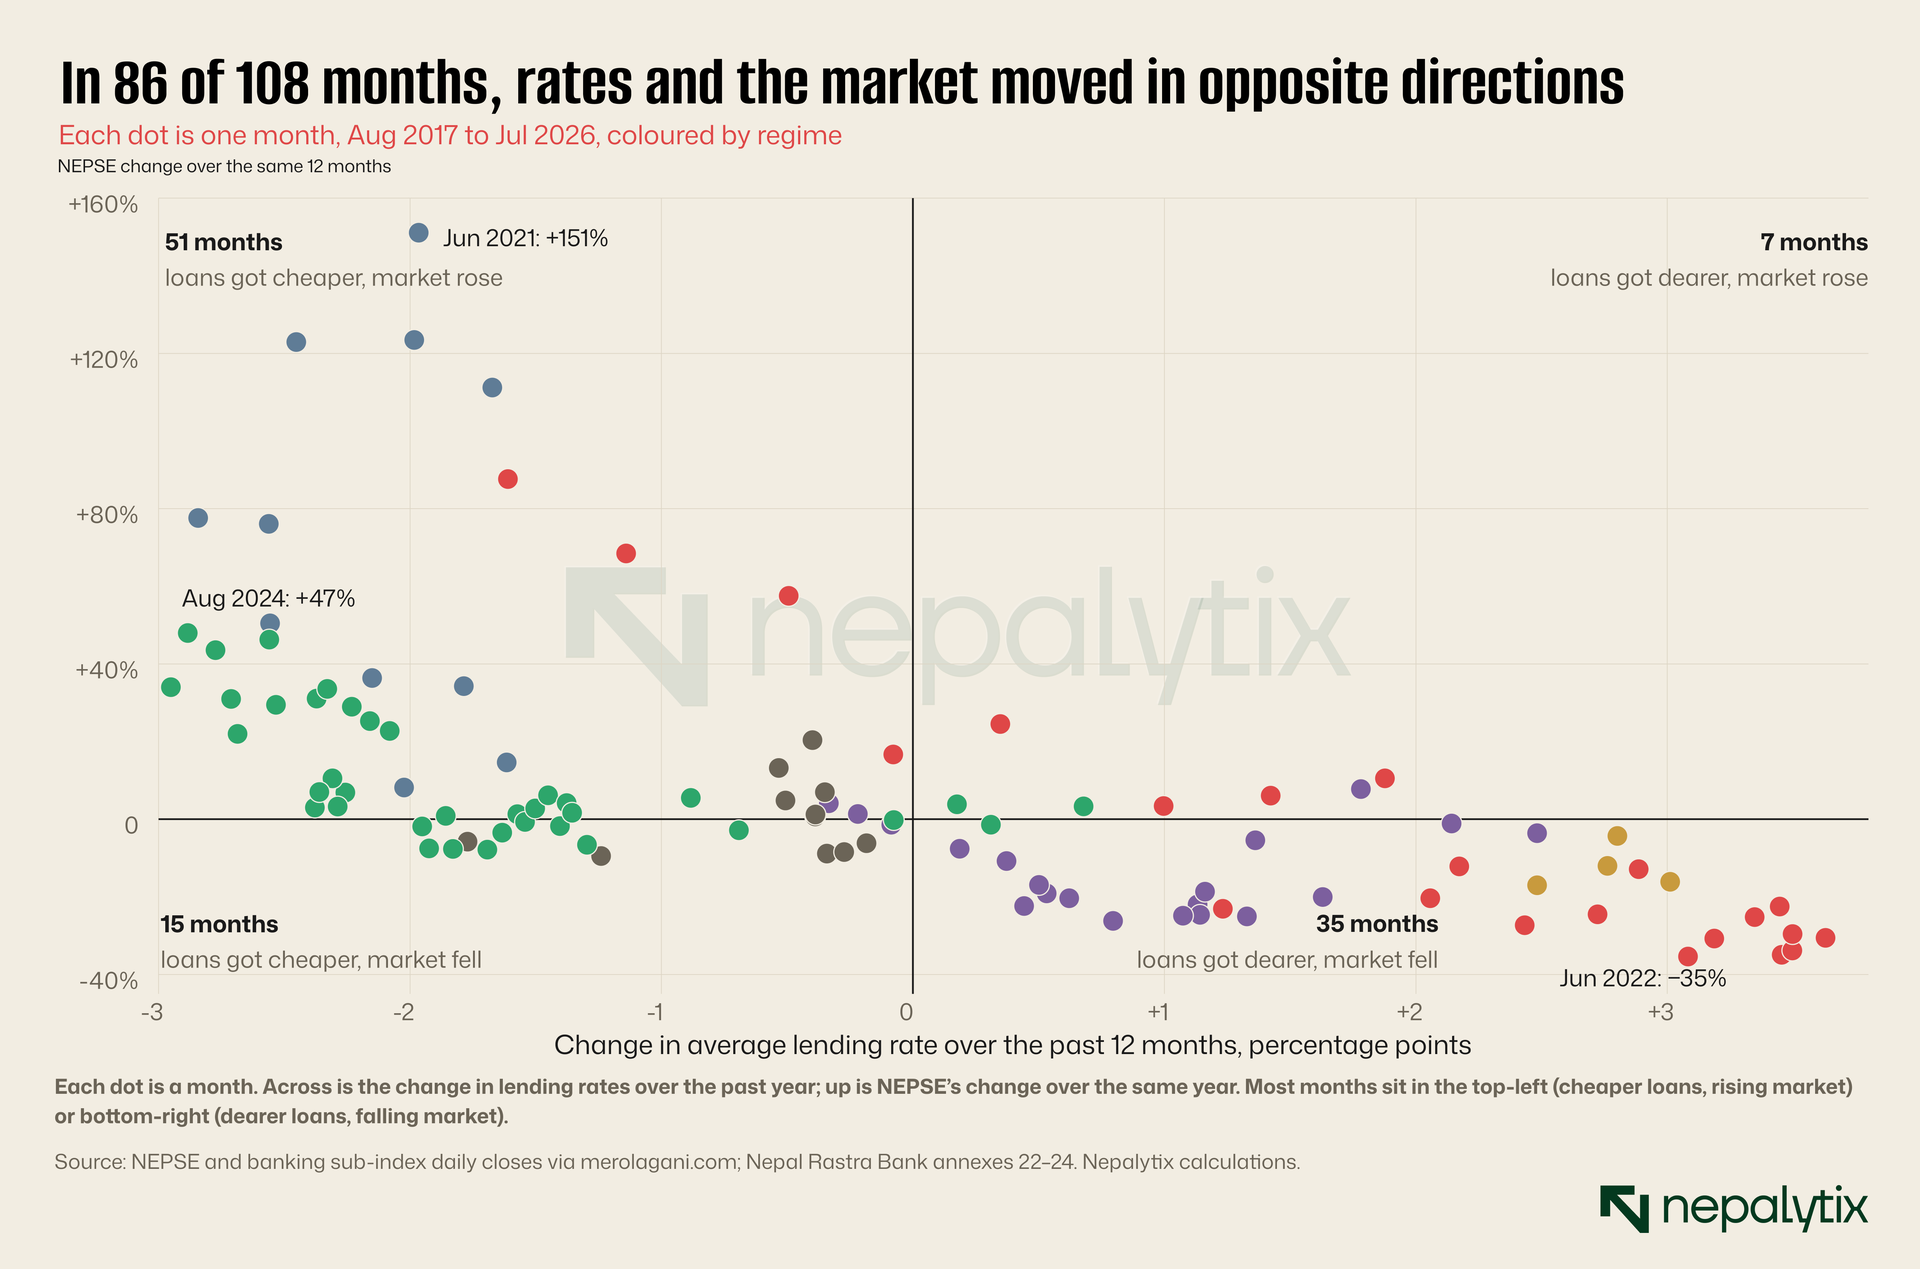
In 51 months loans got cheaper and the market rose. In 35 they got dearer and the market fell. In only 7 did rates rise and the market rise with them, and in 15 rates fell and the market still fell. Six of those fifteen are from the stall of 2019–20 and nine from the long glut: three in its first year, before the market caught up with falling rates and six in the past twelve months.
The quadrant chart also shows the scale problem. The blue dots of the pandemic glut sit high above everything else: twelve-month returns of 80% to 151% with lending rates down by two to three points. The green dots of the long glut sit mostly between 0% and 50% with lending rates down by just as much. Cheaper loans pointed the market in the right direction both times. They moved it very different distances.
9. Two gluts, side by side
Putting the six regimes in one table shows what separates the two cheap-money episodes and what does not.
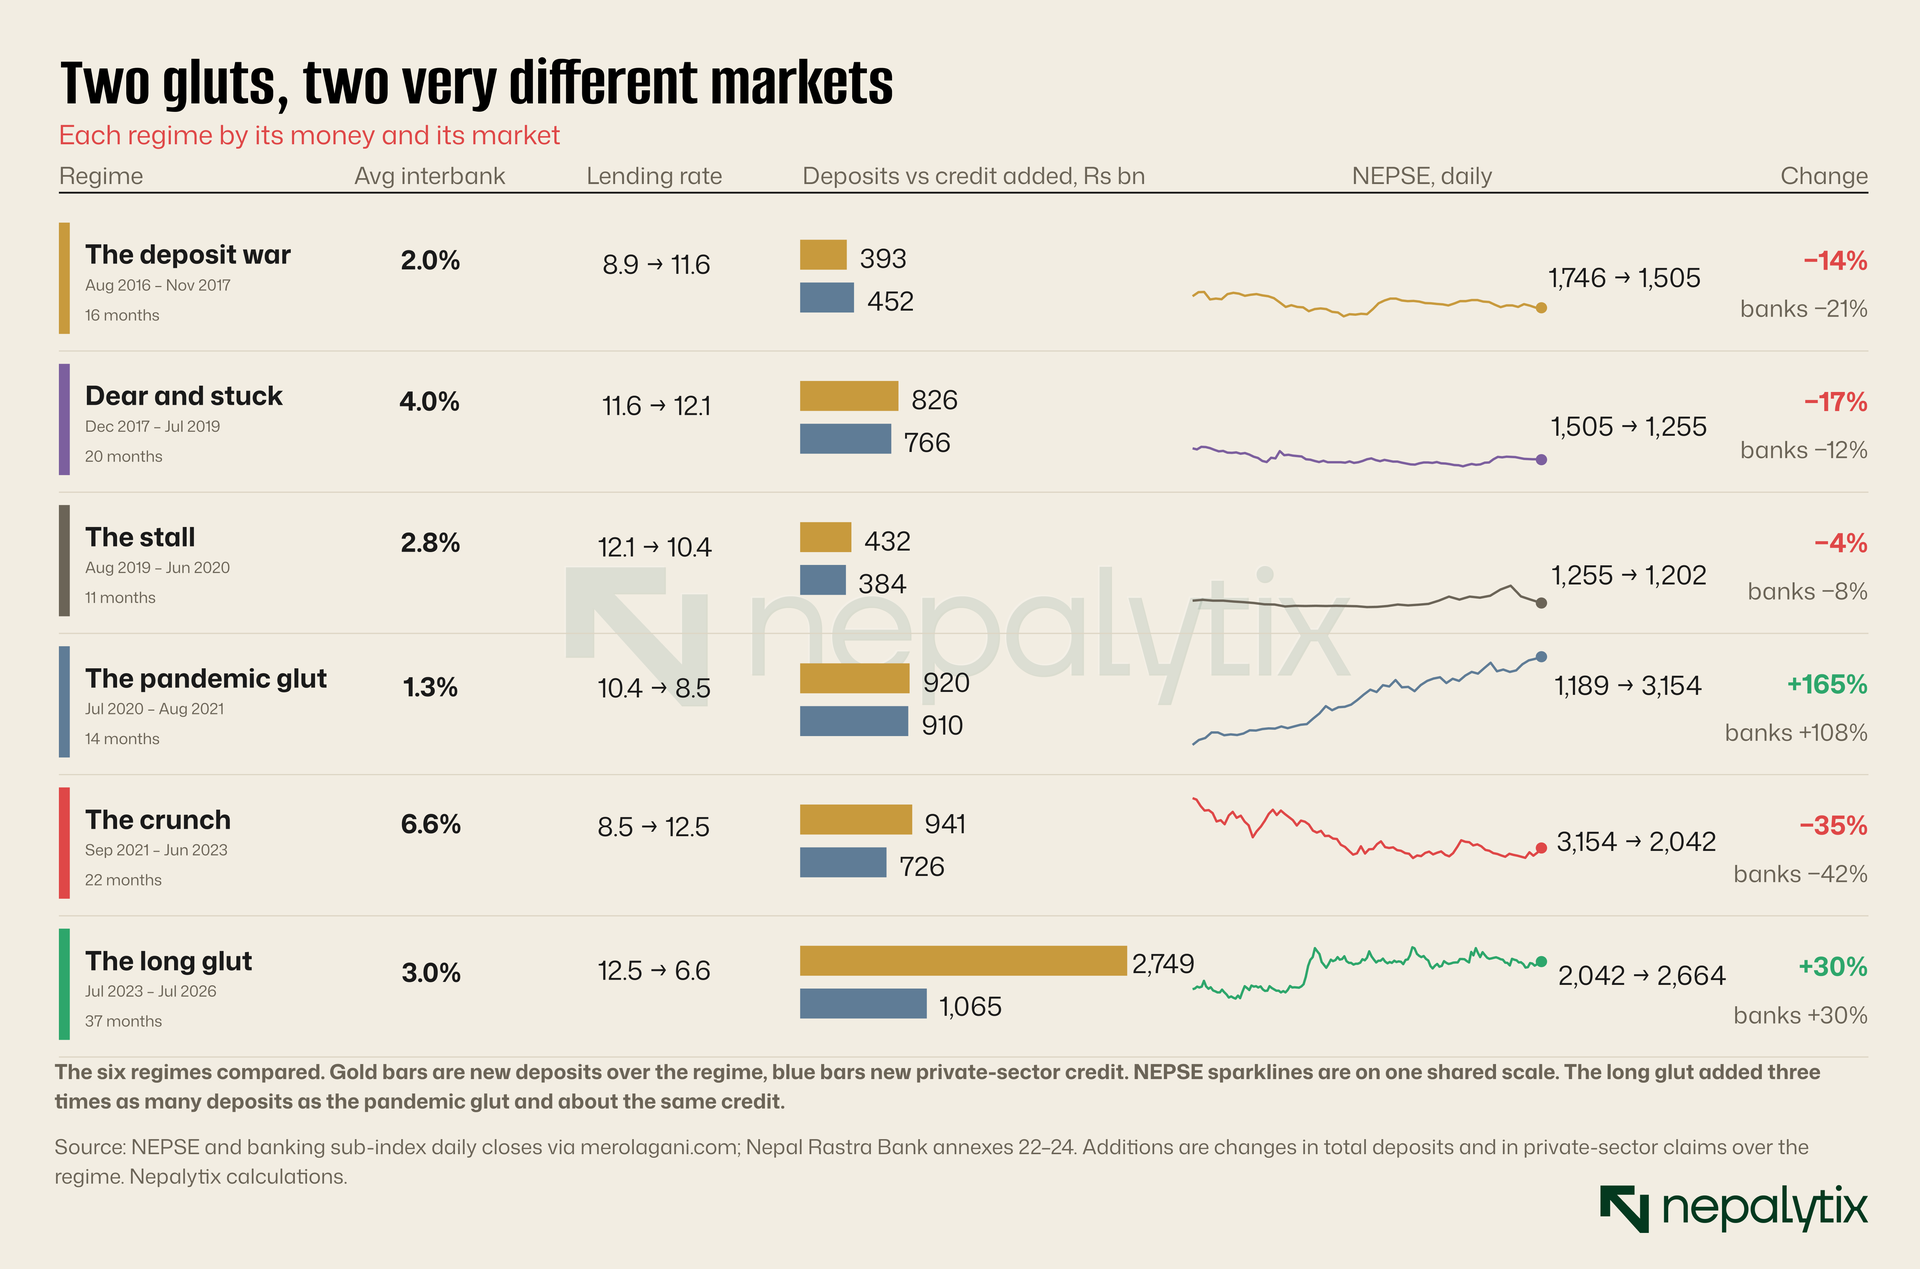
On the price of money alone, the two gluts look similar. The average interbank rate was 1.3% in the pandemic glut and 3.0% in the long glut, both low by Nepali standards. The fall in lending rates was larger the second time: 5.9 points against 1.9. If cheapness were all that mattered, the long glut should have produced at least as strong a market.
The difference is in the bars. In the pandemic glut, deposits rose by Rs 920 billion and private-sector credit by Rs 910 billion. In the long glut, deposits rose by Rs 2,749 billion and credit by Rs 1,065 billion. In 2020–21, nearly all new money became new loans. In 2023–26, about four rupees in ten did. The rest went to the central bank, to government securities and to statutory reserves where it does nothing for the stock market directly and very little for the economy.
The squeeze also reached bank profits, which is part of why the banking sub-index has done no better than the market. The gap between the average lending rate and the average deposit rate of commercial banks was 5.98 points in mid-July 2018 and 5.53 in 2019, when banks were fully lent and could pass their costs on. It was 4.44 in mid-July 2023, at the start of the long glut, and has narrowed every year since: 4.16 in 2024, 3.66 in 2025 and 3.35 in 2026. A bank earning a thinner spread on a smaller share of its balance sheet and holding the rest in instruments that yield less than its deposits cost is a bank whose earnings are under pressure even as its funding gets cheaper. The pandemic glut squeezed spreads too, to 3.78 points by mid-July 2021 but loan volumes growing at 26% more than made up for it.
The NEPSE sparklines make the consequence obvious. The pandemic glut shows a steady climb from start to finish. The long glut shows a flat line, a jump in mid-2024 and then a flat line again at a higher level. The banking sub-index was up 108% in the first episode and 30% in the second.
There are other differences that the table does not show. The pandemic glut began from a cheap market: NEPSE at 1,189 was about 37% below its 2016 peak. The long glut began from 2,042 after a crash but still higher than any level reached before 2020. The pandemic glut came with an economy reopening and borrowers eager to spend. The long glut came after a tightening that had left borrowers with expensive debt and banks with rising bad loans. And the pandemic glut came with a regulator that was relaxing margin rules; the long glut came with one relaxing them too, but more slowly and from a tighter starting point.
None of that makes the pandemic glut repeatable, nor would most people want it to be. A bull market built on credit growing at 30% a year in an economy growing at 4% is the sort that ends in a crunch, and this one did. But it does mean that anyone waiting for the long glut to deliver a 2021-style market is waiting for something that the data does not support. Cheap money is necessary for that kind of market in Nepal. It is not sufficient.
10. What to watch from here
If the lesson of the decade is that liquidity leads, credit follows and the size of the move depends on whether money becomes loans then the indicators worth watching for the next regime change are fairly clear.
The interbank rate leaving the floor. In every tightening in the series, the interbank rate moved first and by the most. It has been between 2.7% and 3.0% for more than two years. A sustained move above about 3.5% would be the earliest sign that the glut is ending, most likely because imports are picking up faster than remittances. It would also, on the evidence of the last decade, be the earliest negative signal for the market with a lead of several months.
Deposit growth relative to credit growth. In the year to mid-July 2026, deposits grew by 13.9% and credit by 6.6%, a gap of more than seven points. The gap narrowing because credit growth rises with deposit growth holding up, would be the healthiest version of a recovery. The gap narrowing because deposit growth falls would be the start of a squeeze.
The unlent stock. Rs 2.28 trillion is a very large buffer. Even if credit growth doubled to 13%, the system could fund it from the existing surplus for well over a year without bidding up deposit rates. That cushions the next tightening. It also means that the next tightening, when it comes will probably show up in the central bank’s absorption operations shrinking before it shows up in deposit rates rising.
Inflation. Consumer price inflation averaged 2.66% in the first ten months of FY2025/26, but was 5.04% on a year earlier by April–May 2026, and the central bank projects it within 5.5% this year. With deposit rates at 3.2%, a rise in inflation would leave savers with negative real returns, which has historically been one of the forces that pushes Nepali money out of deposits and into land, gold and shares. It is also the force most likely to make the central bank tighten.
The speed of the turn. Regime changes in Nepal have been abrupt at the short end and slow everywhere else. The interbank rate went from 2.1% in August 2021 to 4.7% the following month, and from 6.7% in June 2023 to 3.0% the month after. Deposit and lending rates took a year or more to follow, and credit growth took two. An investor who waits for lending rates or credit growth to confirm a turn has, on the evidence of this decade, waited too long. The month the interbank rate leaves the floor is likely to matter more than the month the central bank changes its policy rate.
Credit quality. The single biggest difference between the two gluts is the condition of borrowers. Non-performing loans at 5.6% in mid-June 2026 are high by recent standards. A clean-up, through write-offs, recoveries or a pickup in the economy, would do more for credit growth than another cut in the policy rate. Without it, cheaper money is likely to keep pooling in the central bank’s auctions.
The market itself may already be telling us something. The quadrant chart shows that in the last twelve months, as lending rates fell another 1.3 points, NEPSE’s twelve-month return slipped to around zero, from 2,760 in mid-July 2025 to 2,590 a year later. That is the bottom-left quadrant, the rarest combination after rising rates with a rising market. In the past it has marked either the late stage of a glut, when the cuts are no longer news, or the early stage of one, when the market has not yet caught up. Which of the two it is this time depends less on the central bank than on whether Nepal’s borrowers are ready to borrow again.
Disclaimer
This report has been prepared by Nepalytix for informational and educational purposes only and does not constitute investment advice, an offer, or a solicitation to buy or sell any securities.
The information contained in this report is based on sources believed to be reliable; however, Nepalytix does not guarantee its accuracy, completeness, or timeliness. Opinions, estimates, and projections expressed herein are those of the authors as of the date of publication and are subject to change without notice.
Investing in securities involves risks, including the possible loss of principal. Past performance is not indicative of future results. Readers are advised to conduct their own independent research and consult with a qualified financial advisor before making any investment decisions.
Nepalytix and its contributors may hold positions in the securities discussed in this report at the time of publication or thereafter.
Neither Nepalytix nor any of its affiliates accept any liability for any loss arising from the use of this report or its contents.