The capital-raise tax on EPS
Nepal’s latest earnings season shows why profit growth can mislead investors. At SY Panel, profit rose 1.08% while EPS fell 39.35% as the share count increased 66.67%.

SY Panel's profit rose 1.08% and its earnings per share fell 39.35%. Himalayan Distillery's profit rose 28.14% and its EPS rose 6.78%. Nothing went wrong at either company. The denominator moved.
The Signal
Profit growth is not shareholder growth and this quarter the gap between them reached 40 percentage points at a single company.
Earnings per share is a fraction. Nepali coverage reports the numerator and Nepali companies grow the denominator, through bonus issues, rights issues and regulatory capital minimums. Where both figures are published the wedge is measurable. In two thirds of this quarter's filings only the numerator was reported.
The arithmetic is exact and it runs in reverse: from profit growth and EPS growth you can derive how much the share count moved. Applied to SY Panel it returns 66.66% against a filing that states 66.67%.
Two companies, one week, the same arithmetic
SY Panel Nepal reported a 1.08% rise in net profit for the fourth quarter of FY2082/83 to Rs 67.5 million on turnover of Rs 812.79 million. Its earnings per share fell 39.35%.
Prabhu Mahalaxmi Life Insurance reported a 1.31% rise in net profit to Rs 37.55 crore. Its EPS fell to Rs 7.08.
Neither company had a bad year in any operating sense. Both grew profit. Both saw shareholders' claim on that profit shrink because in both cases the number of shares grew faster than the earnings did.
This is not a Nepali peculiarity and it is not misconduct. It is the definition of a fraction. But it is systematically under-reported here and this quarter offers an unusually clean set of cases to measure it with.
Where both numbers are published, the wedge is visible
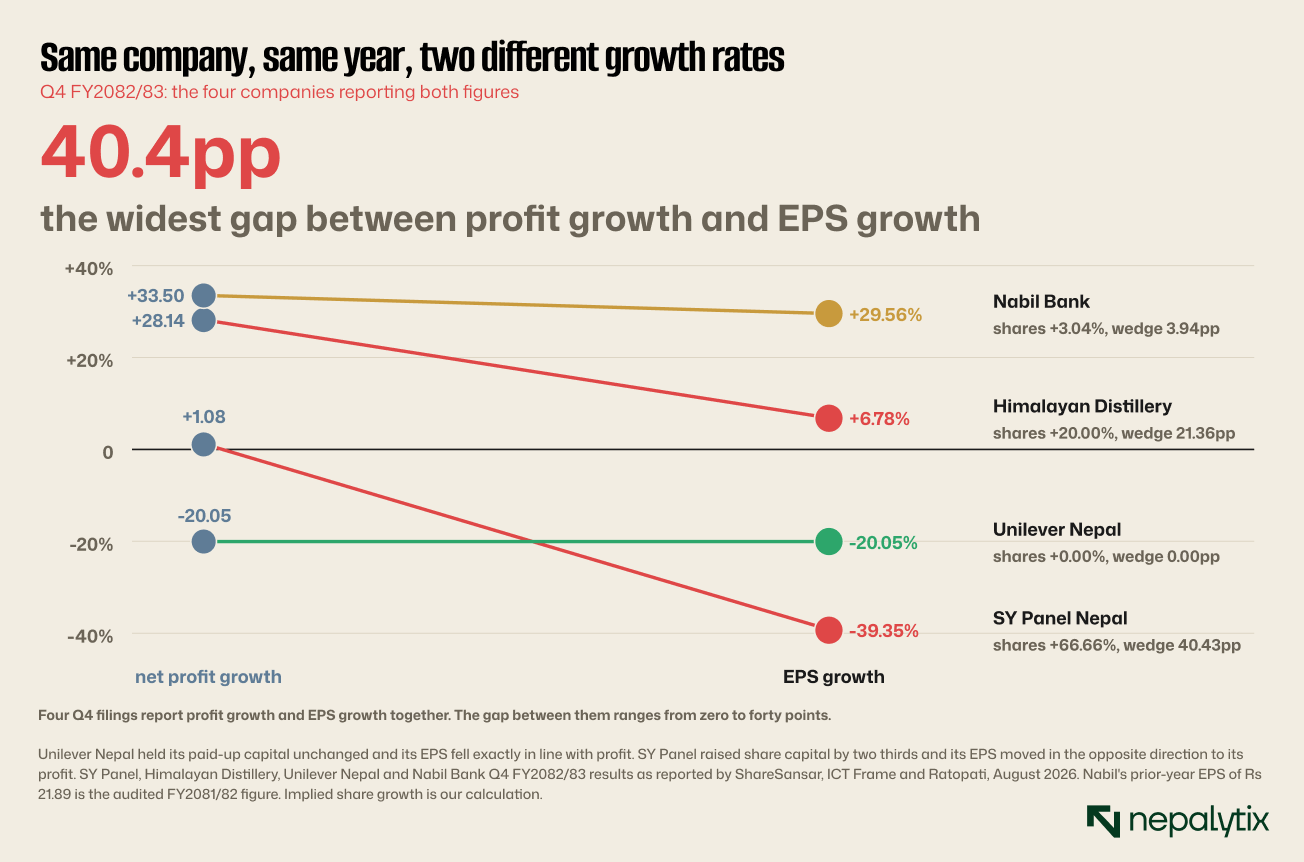
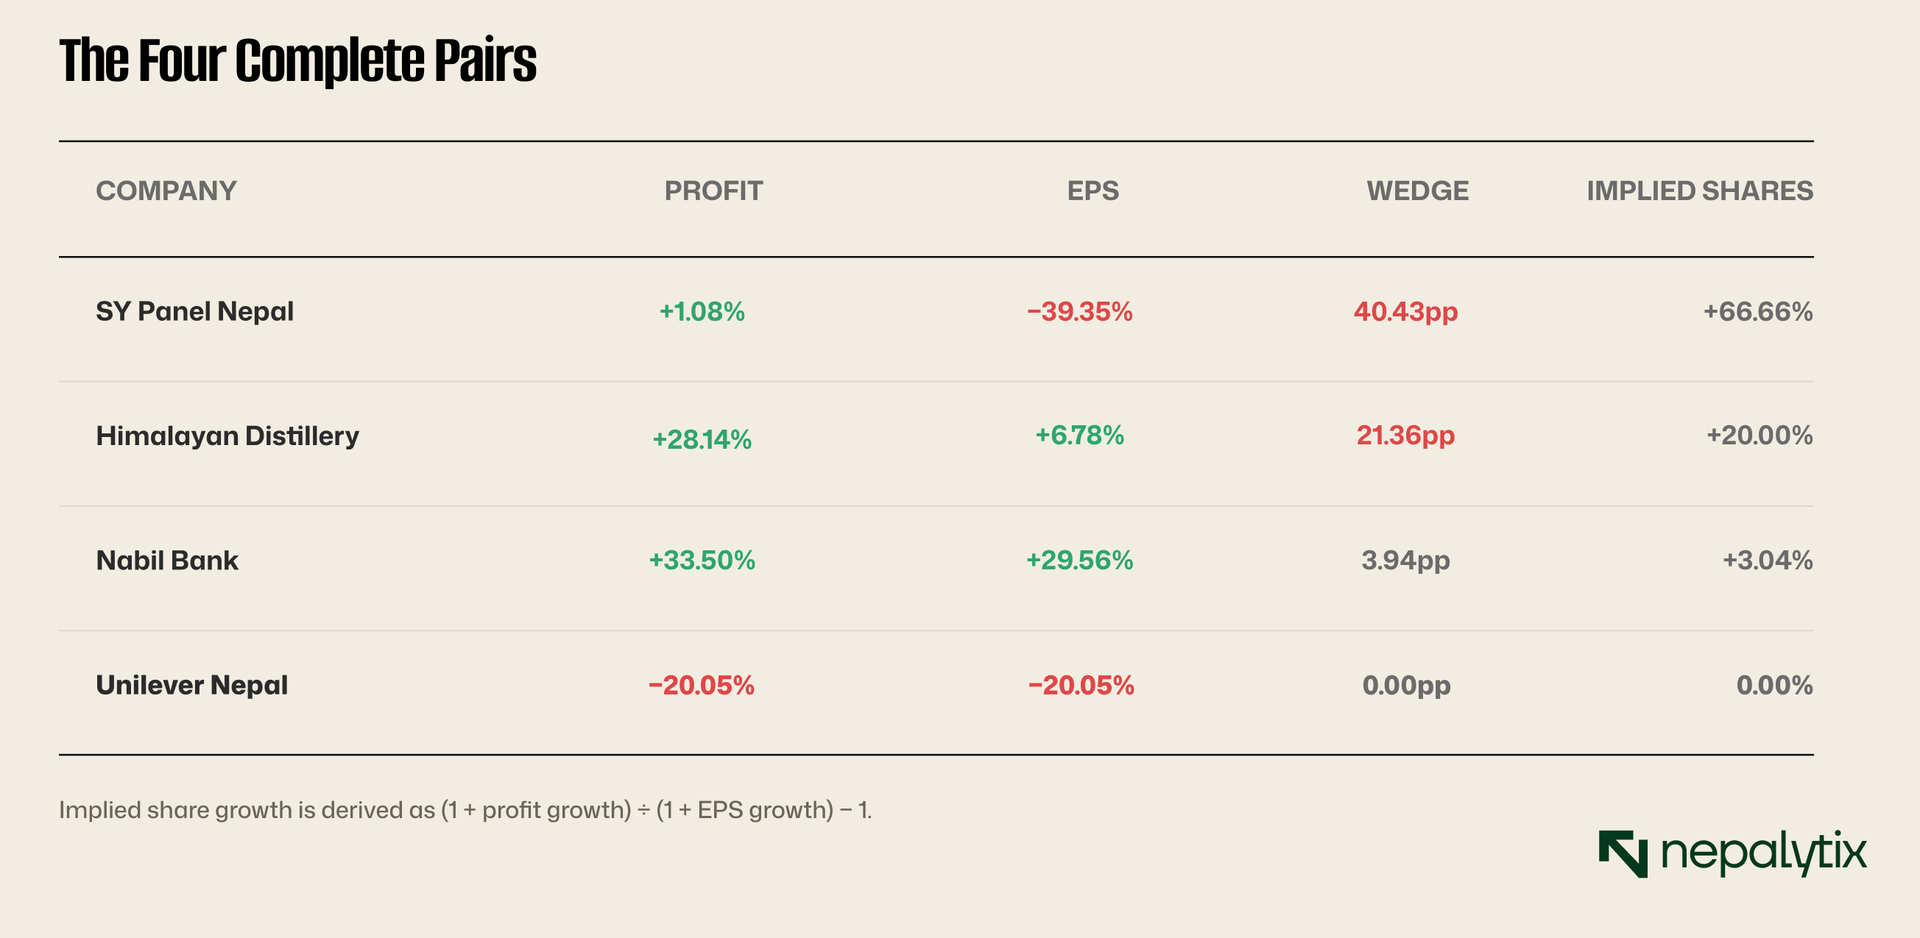
Unilever is the control. Its paid-up capital was maintained at Rs 9.21 crore, no new shares were issued, and EPS moved by exactly the same 20.05% as profit from Rs 2,141.80 to Rs 1,712.27.
That is what the relationship looks like when the denominator holds still. Every other case in the table is a departure from it, and the size of the departure is the size of the issuance.
The derivation reproduces the filing
The relationship inverts. Given profit growth and EPS growth, share growth follows with no other input.
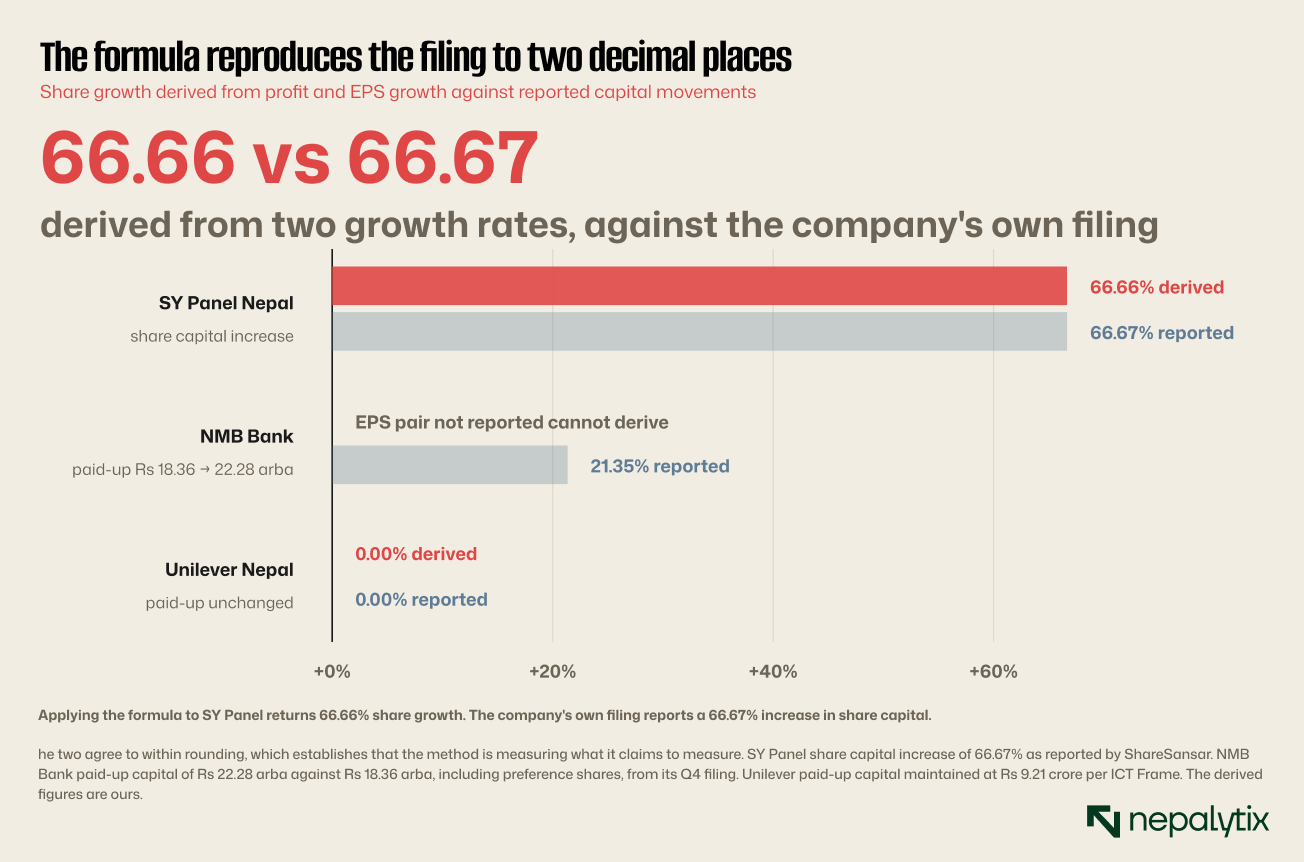
This matters more than it might appear. It means a reader confronted with a filing that reports only profit growth and an EPS level which is most of them can recover the missing piece if they can find last year's EPS.
It also means the wedge is not an interpretation. It is an identity and it holds regardless of what the company says about why the capital changed, or whether it says anything at all.
Where the method breaks
Two caveats before leaning on it.
The derivation assumes both growth rates are computed on the same basis for the same period. Nabil's case does not quite satisfy that: its Rs 28.36 is unaudited and the Rs 21.89 prior figure is audited. The implied 3.04% is therefore indicative rather than exact and the true share growth may differ.
It also assumes EPS is calculated on a weighted average share count which is standard practice. Where a company computes EPS on closing shares instead and Nepali practice is not uniform, a mid-year issuance will produce a different answer from the one the formula returns.
Neither problem affects the direction. Both affect the second decimal place and readers should treat derived figures as accurate to a percentage point rather than to a basis point.
The general rule, in one table
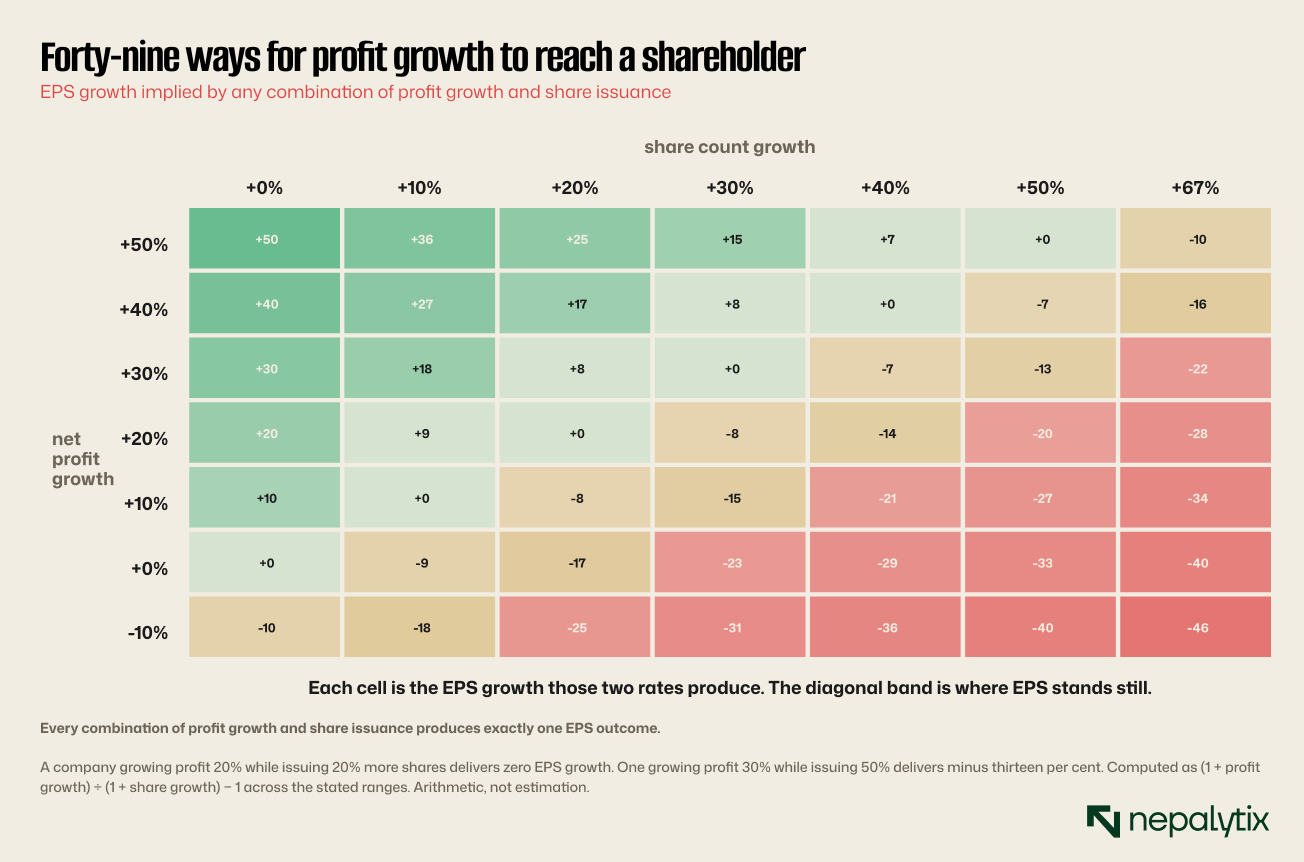
Read down the diagonal band where the cells sit near zero. That is the line at which issuance exactly consumes profit growth, and it is closer than most reporting implies: a company issuing a 20% bonus needs 20% profit growth simply to keep its shareholders where they were.
Nepali bonus ratios of 10 to 20 per cent are routine. Profit growth of 20% is not. Of the twelve filings in our sample, seven cleared 20% profit growth and five did not.
Two thirds of the market reports only the numerator
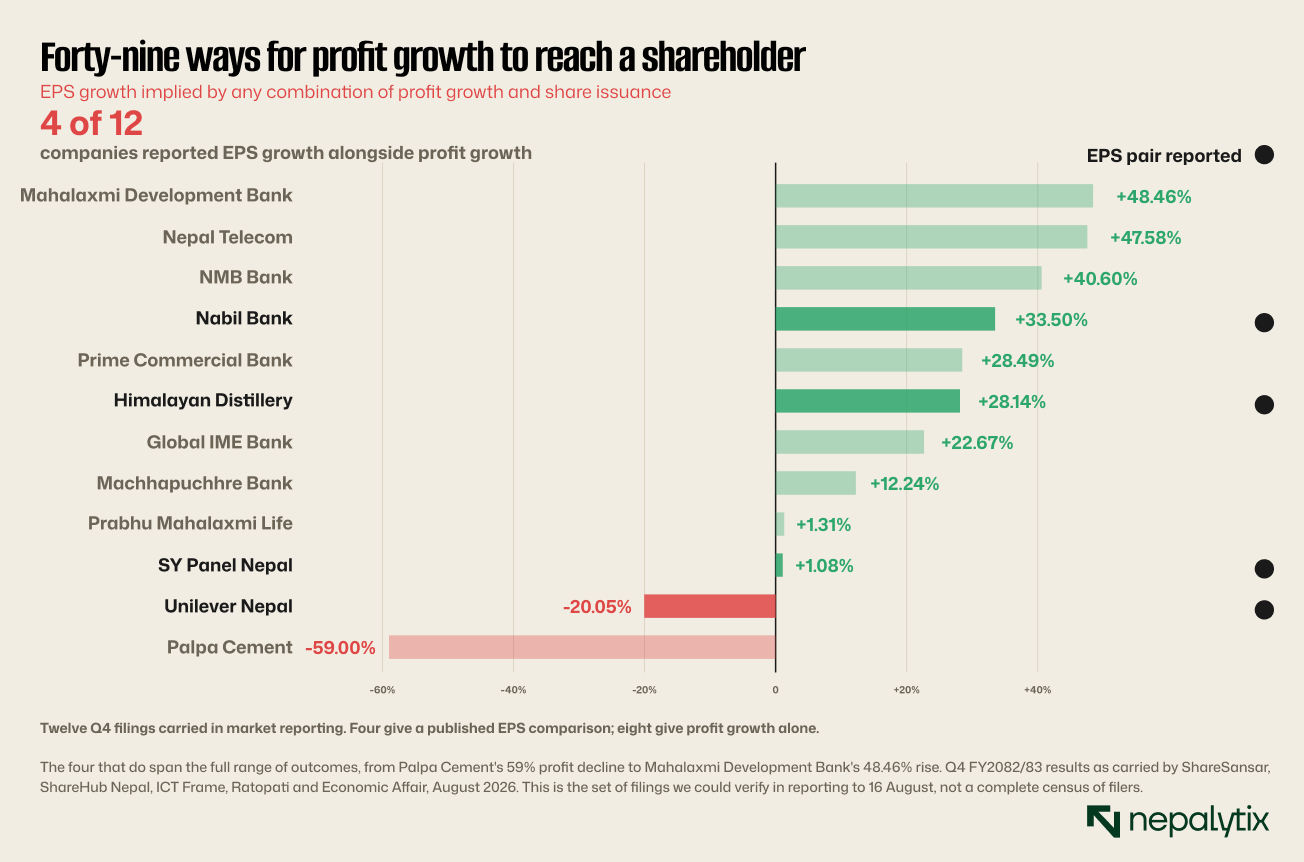
Several companies publish an EPS level without a prior-year comparison. NMB Bank reported EPS of Rs 19.53 on profit growth of 40.60%; Nepal Telecom reported Rs 49.25 on growth of 47.58%; Mahalaxmi Development Bank reported Rs 13.96 on growth of 48.46%. In each case the level is there and the change is not.
That is enough to make the headline and not enough to compute the wedge which is precisely the gap this piece is about.
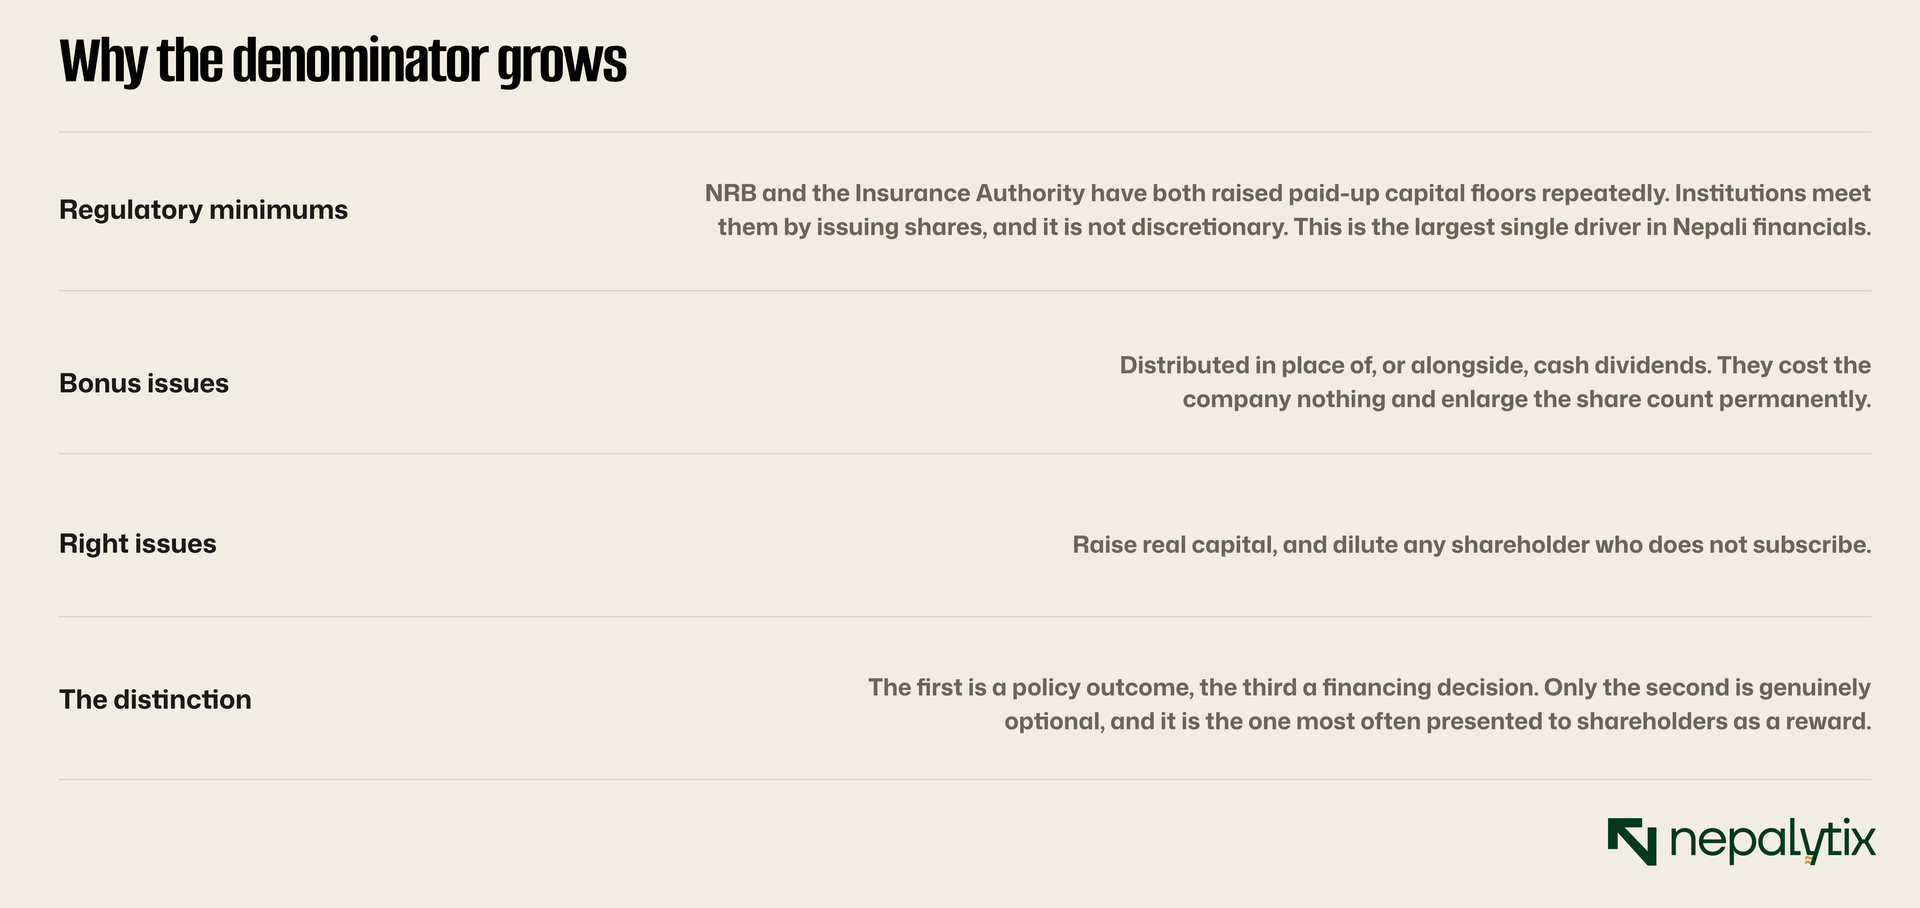
What the eight silent filings imply
It is worth being careful about what can and cannot be concluded from the companies that report only profit growth.
The absence of an EPS comparison does not mean dilution occurred. Several of the eight may have unchanged share counts, in which case their EPS growth equals their profit growth and there is nothing to disclose.
But two of them are known to have raised capital. NMB Bank's paid-up capital, including preference shares, rose from Rs 18.36 arba to Rs 22.28 arba, an increase of 21.35%. Against profit growth of 40.60% that implies EPS growth in the region of 16%, well short of the headline.
The point is not that companies are concealing something. It is that a reader cannot tell the difference between a company that did not dilute and a company that did without publishing the comparison, and the two produce very different outcomes from the same headline.
A bonus share is a subdivision, not a distribution
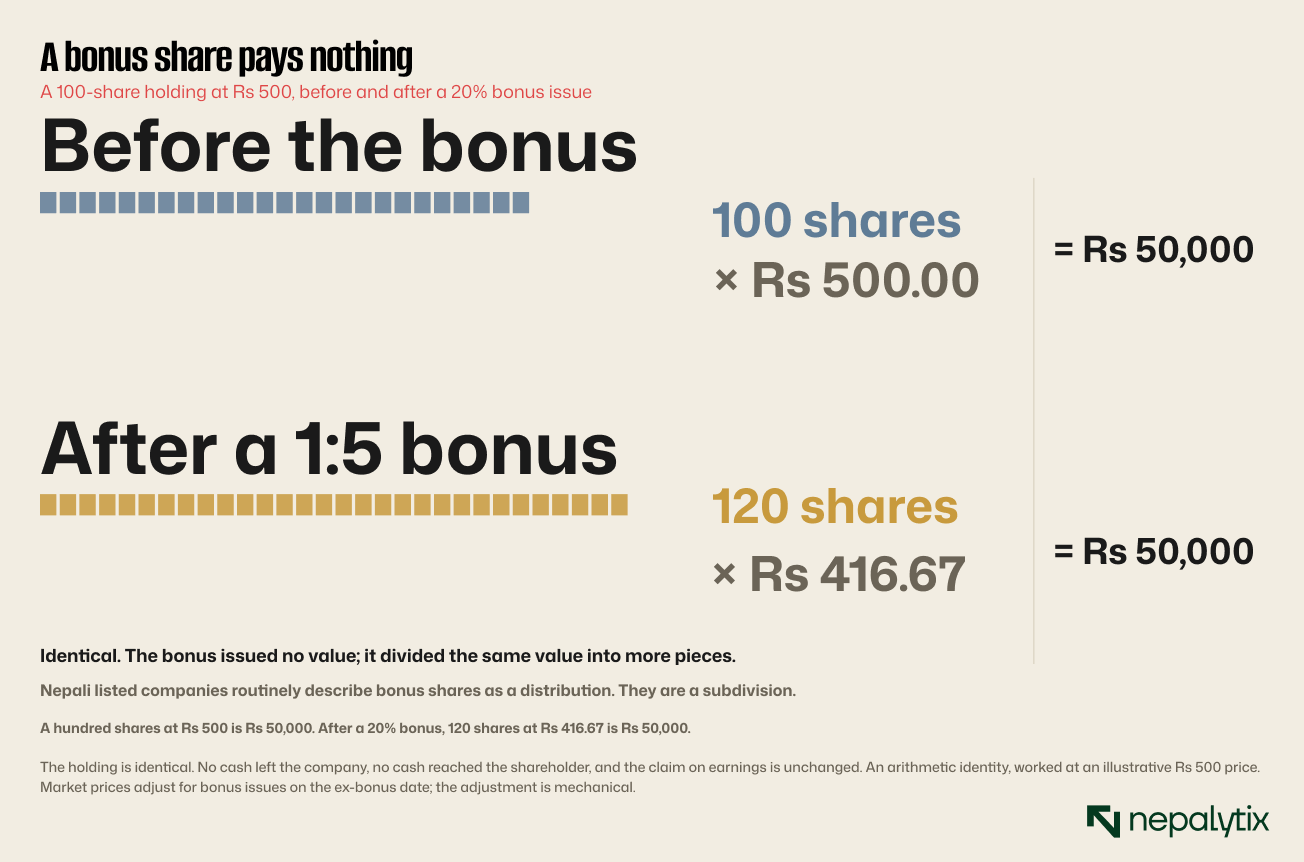
The reason this needs saying is that Nepali market coverage routinely reports a bonus declaration as a positive event on the same footing as a cash dividend.
A cash dividend transfers value from the company to the shareholder. A bonus issue transfers nothing. It divides the same equity into more certificates and lowers the price per certificate correspondingly.
Where a bonus does carry information, it is indirect: a company willing to capitalise reserves is signalling confidence, and a larger share count improves liquidity in a thinly traded stock. Both are real. Neither is income.
What repeated issuance does over time
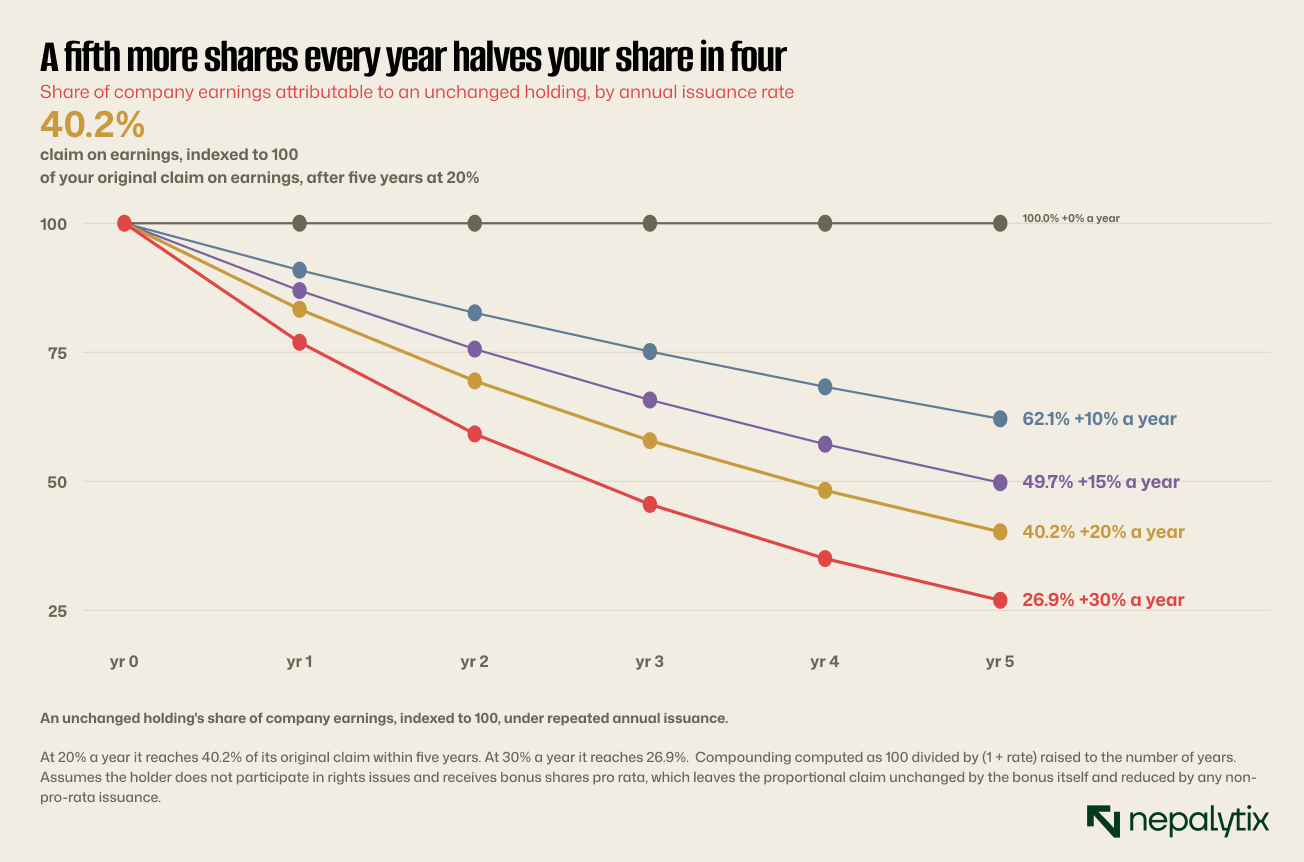
One clarification because it matters and it cuts against the alarm the chart might otherwise create.
A shareholder who receives bonus shares pro rata is not diluted by them. Their percentage of the company is unchanged; only the unit of measurement moved. The compounding shown above applies to issuance that is not pro rata, rights issues the holder does not take up, preference issues, and shares issued to new investors.
What the bonus does do is make the reported EPS series discontinuous. A company that has issued bonus shares in four of the last five years has an EPS history that cannot be read as a trend without restating it, and Nepali companies rarely publish the restatement.
What we are watching
1 | The EPS pair, in every remaining Q4 filing. Four of twelve is a small base. If the ratio holds as the rest of the season lands, the disclosure gap is systemic rather than incidental. |
2 | AGM bonus declarations through Bhadra and Ashoj. Each one sets next year's denominator. The ratio declared now determines how much profit growth FY2083/84 needs to deliver flat EPS. |
3 | Restated EPS series. Any company publishing a bonus-adjusted multi-year EPS history is doing something almost nobody here does, and it is worth noting who. |
4 | Insurance sector capital requirements. Life and non-life have both been through mandated increases. Prabhu Mahalaxmi's rising profit and falling EPS is the visible edge of that. |
5 | The gap between distributable profit and reported EPS. Nabil showed Rs 28.36 of EPS against Rs 19.10 distributable per share. Dilution is one wedge; statutory appropriation is another, and they compound. |
None of this is an argument against issuing shares. Regulatory minimums are not optional, rights issues fund real growth, and a company that needs capital should raise it.
It is an argument about what gets reported. Profit growth is a company statistic. EPS growth is a shareholder statistic. Nepali filings lead with the first, and this quarter, at one company, the two differed by forty percentage points and pointed in opposite directions.
Disclaimer
This report has been prepared by Nepalytix for informational and educational purposes only and does not constitute investment advice, an offer, or a solicitation to buy or sell any securities.
The information contained in this report is based on sources believed to be reliable; however, Nepalytix does not guarantee its accuracy, completeness, or timeliness. Opinions, estimates, and projections expressed herein are those of the authors as of the date of publication and are subject to change without notice.
Investing in securities involves risks, including the possible loss of principal. Past performance is not indicative of future results. Readers are advised to conduct their own independent research and consult with a qualified financial advisor before making any investment decisions.
Nepalytix and its contributors may hold positions in the securities discussed in this report at the time of publication or thereafter.
Neither Nepalytix nor any of its affiliates accept any liability for any loss arising from the use of this report or its contents.