The numbers behind Nepal's good news week
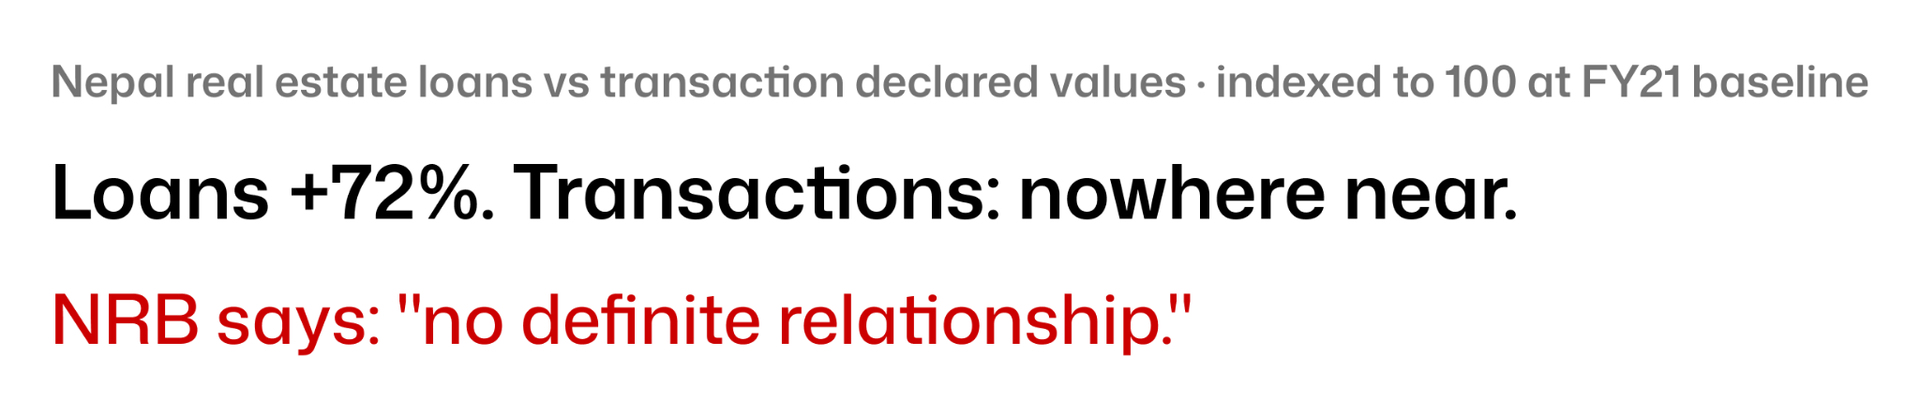
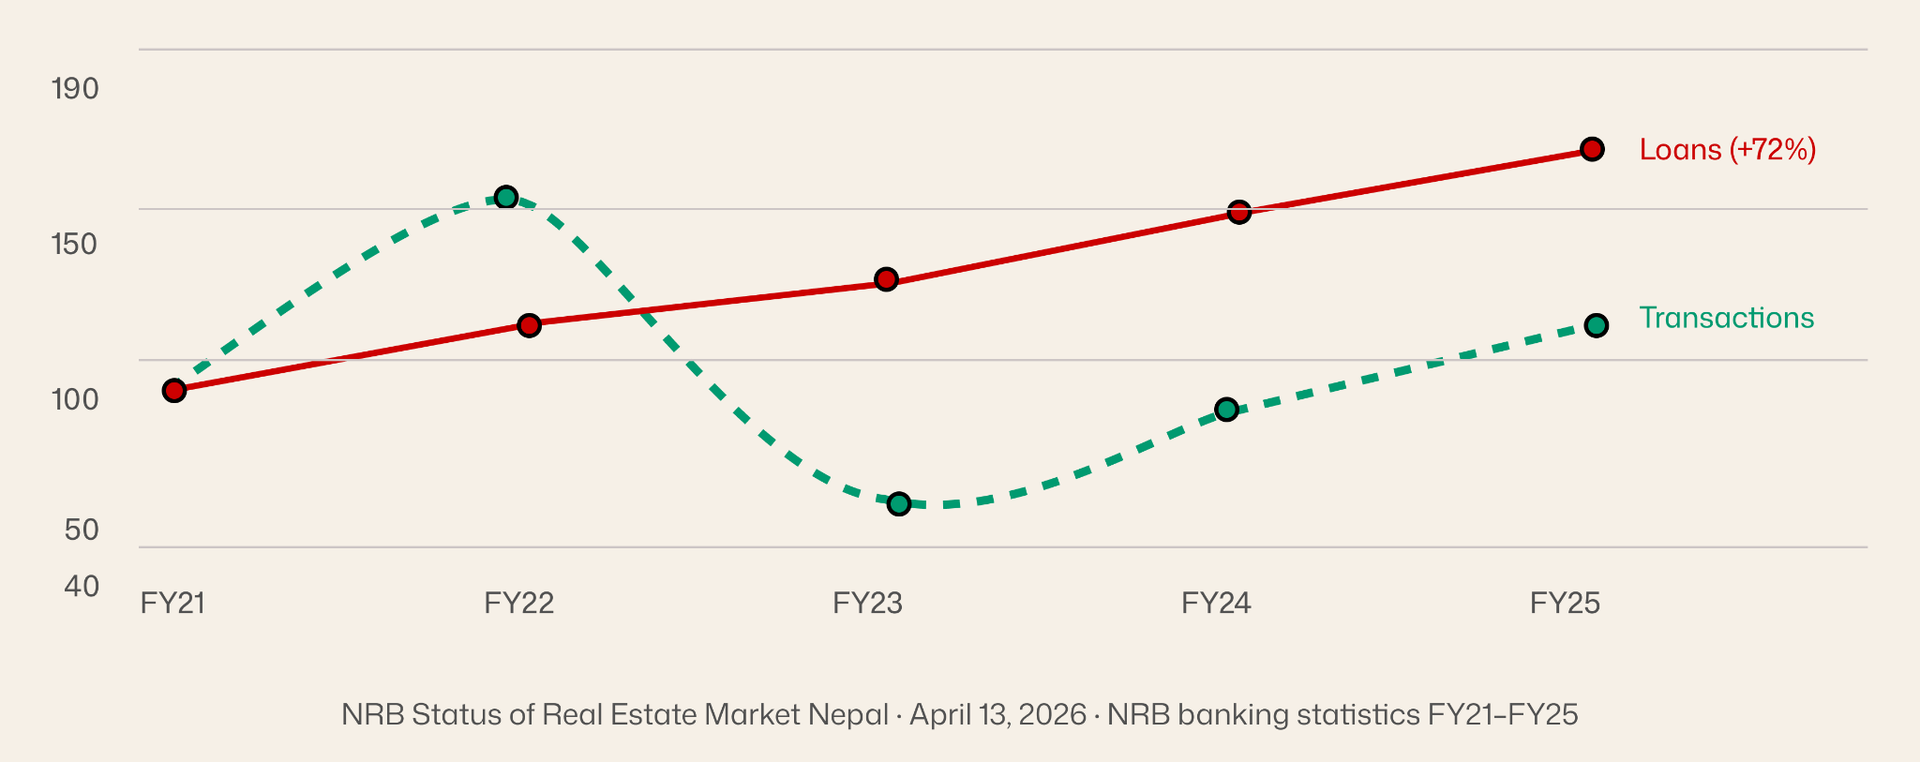
The headlines look fine. Real estate is bouncing back, trekking season is running, and the government has a mandate to build. But the NRB's own data shows loans growing 72% with no matching rise in actual transactions.

1.The NRB just published Nepal's first-ever real estate market report. Credit is booming. Transactions aren’t.
Nepal's central bank has never published systematic real estate data before this week. On April 13, the NRB released its inaugural quarterly real estate market report tracking transaction volumes, declared values, and loan data from FY2022/23 through FY2024/25. It will now publish this quarterly.
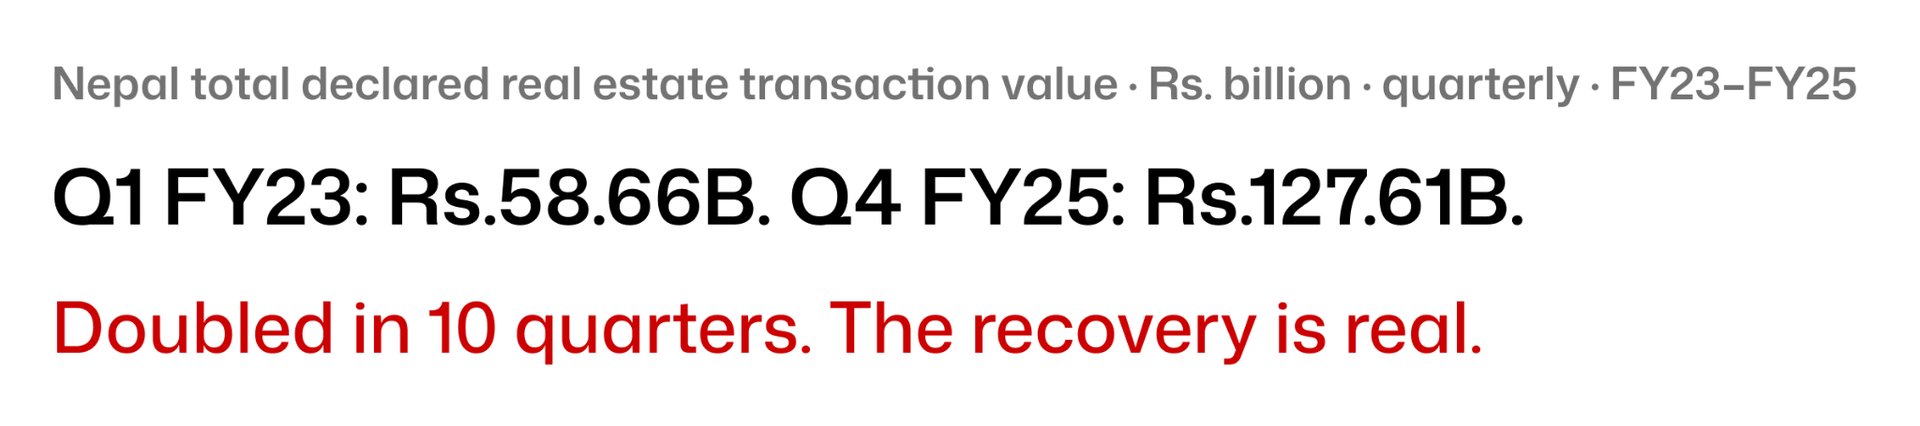
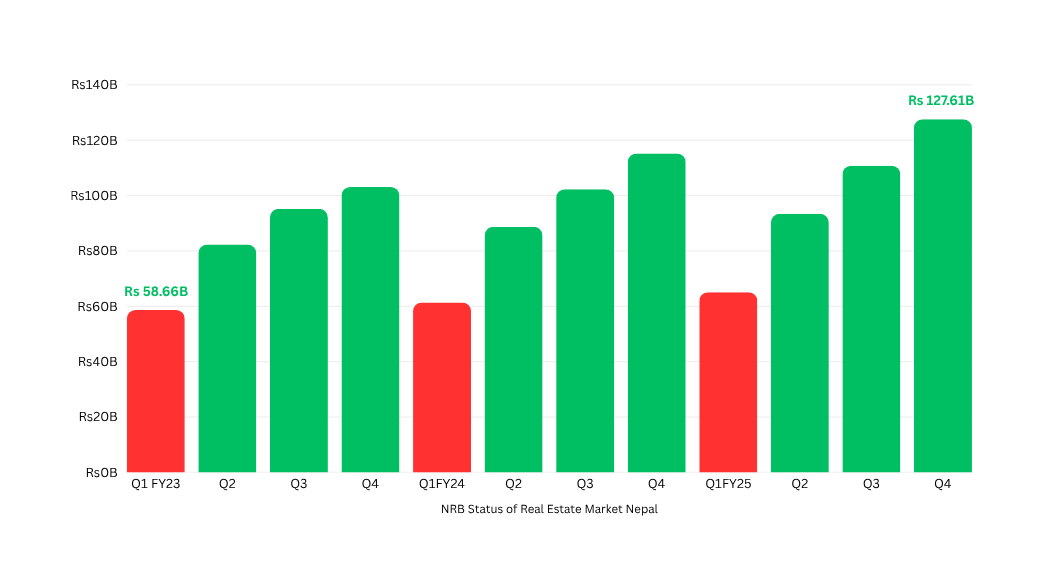
The headline finding sounds optimistic: the market is recovering. Transaction values more than doubled from Rs.58.66 billion in Q1 FY23 to Rs.127.61 billion in Q4 FY25. Government revenue from real estate bounced from Rs.8.2 billion at the trough back toward Rs.15 billion. Loan growth over five years: 72.41%.
But the NRB buried a more interesting finding in the report: credit growth and transaction activity are decoupled. Loans grew 72.41% over five years. That did not consistently translate into higher declared transaction values or land prices. The central bank says explicitly: "no definite relationship." Nepal has been lending aggressively into real estate without a proportionate increase in actual market activity. The loans went somewhere, they just did not go where the transactions were.
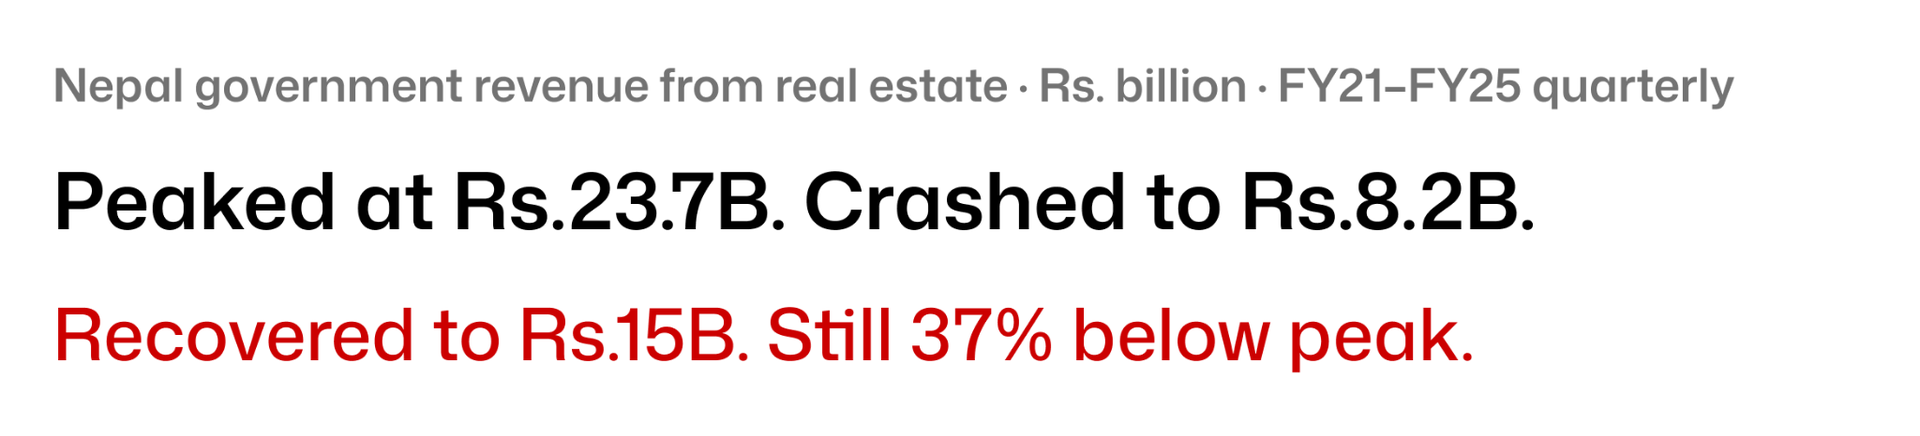
The 2022/23 crash was not noise. It was the cooperative sector collapse, the interest rate spike, and the land-splitting ban landing simultaneously. The recovery since is real but the market that generated Rs.23.7B in a single quarter has not returned.
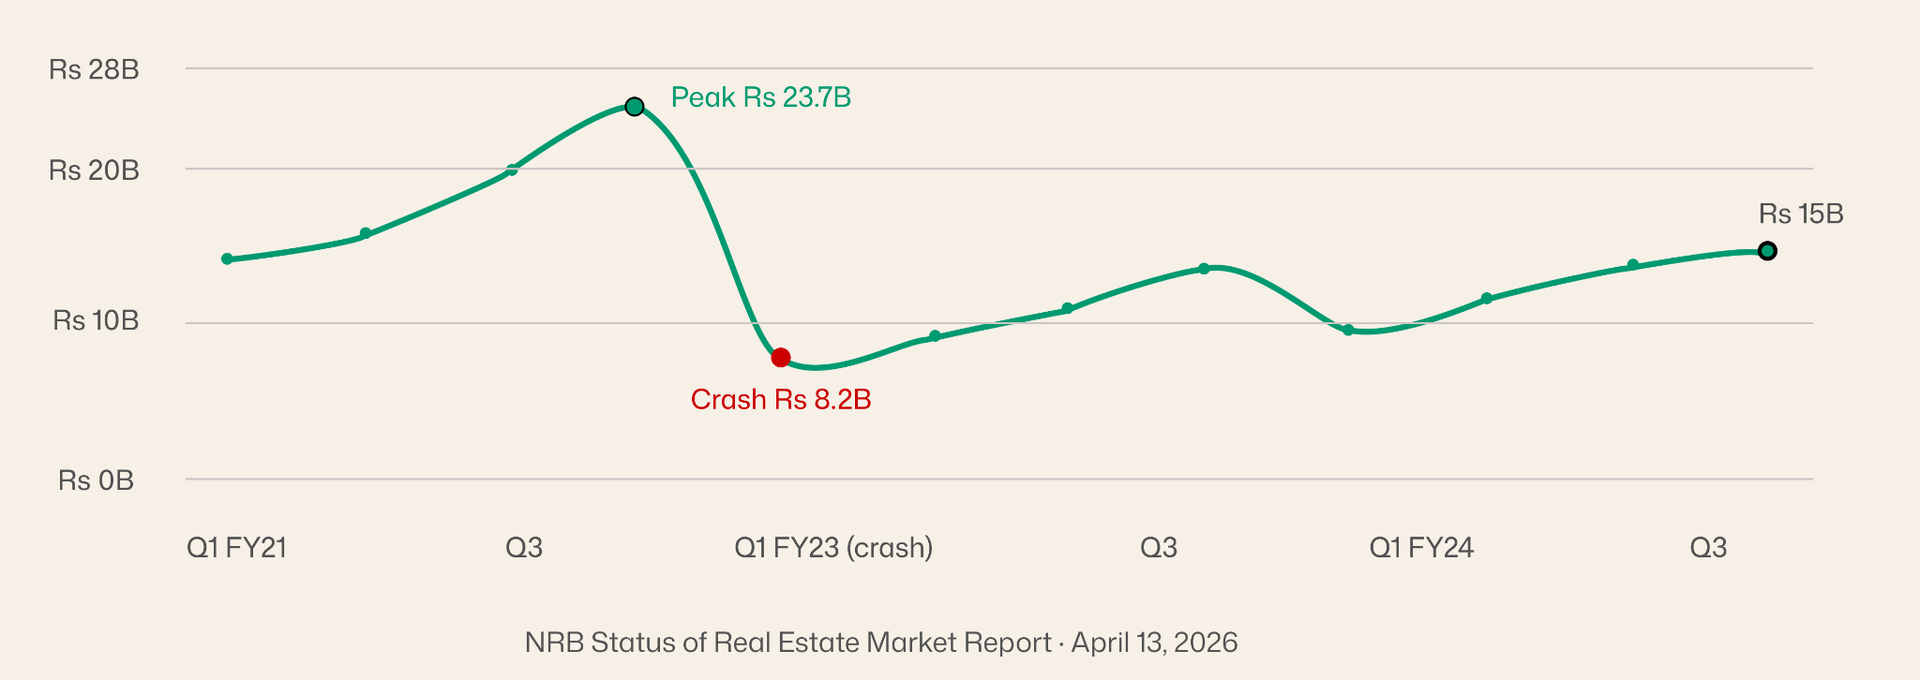
The recovery to Rs.15 billion is real, but the line asking to be examined is not the absolute level, it is the slope. Transaction value went from Rs.58.66 billion in Q1 FY23 to Rs.127.61 billion in Q4 FY25. That is a clean doubling in under three years. Government revenue did not double alongside it. That gap means declared values are rising faster than government revenue is capturing which in Nepal usually means underreporting is back. When the market was depressed, buyers declared closer to actual value because they were cautious. As confidence returned, the gap between declared price and actual price widened again.
The regional split is where the NRB report gets genuinely interesting. Madhesh Province leads in transaction volume and physical area. Bagmati leads in declared value, by a large margin. Metro areas account for just 4.1% of all transactions nationwide but 13% of all declared value.

Metro areas are 4.1% of transactions but 13% of total declared value, land in Kathmandu valley costs roughly 3× the national average per transaction. Karnali and Sudurpashchim barely register, confirming that Nepal's property market is essentially two different markets operating under the same country.
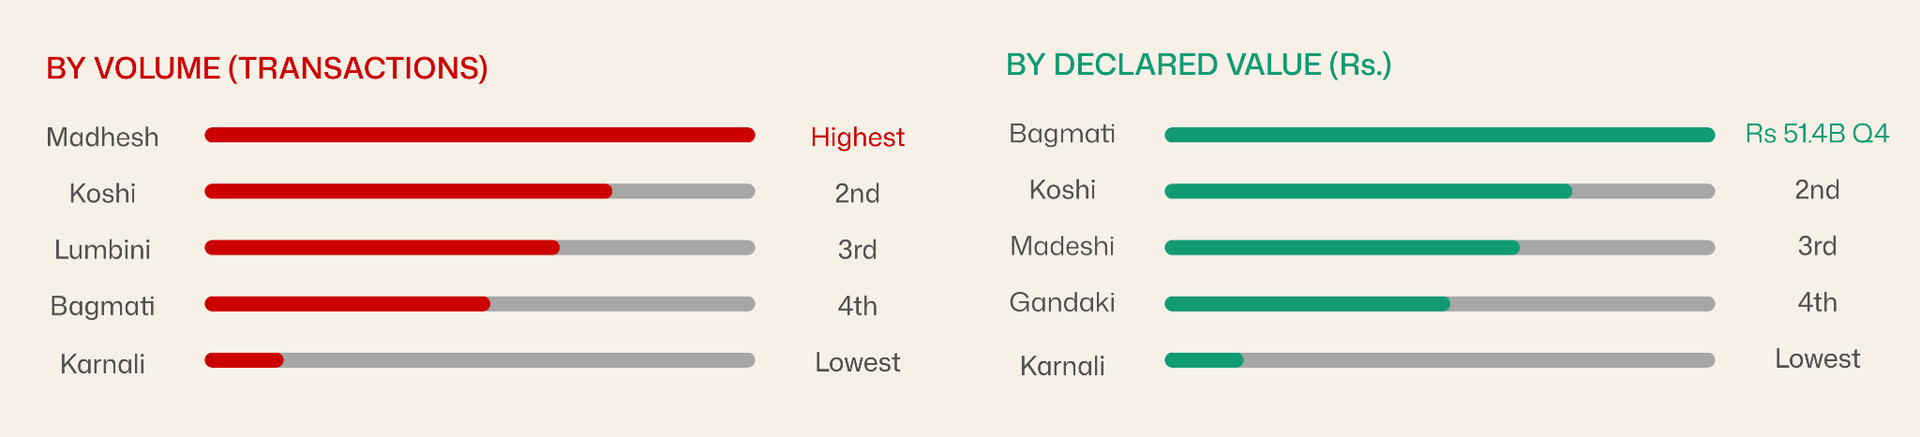
Metro effect: 4.1% of transactions → 13% of total declared value. One metro plot in Kathmandu is worth roughly 10 non-metro plots combined. The national "recovery" in real estate is concentrated in one valley.
The NRB's explicit finding that loan growth and transaction values are decoupled is the alarm buried in an otherwise optimistic-sounding report. Between FY21 and FY25, real estate loans grew 72.41%. Transaction values did not grow proportionally. The question this raises is: where did the extra credit go? The most likely answer is that it went into land held rather than land traded, parcels purchased on credit and sitting idle, waiting for prices to rise further. That is not productive economic activity. It is collateral accumulation. And it means Nepal's banking system has Rs.275.96 billion in real estate loans outstanding against assets whose declared values may not reflect what those assets would actually fetch in a stressed sale.
This is the NRB saying, carefully, that Nepal's banks have been lending into real estate without a corresponding rise in actual market activity. Loans grew 72% from FY21 to FY25. Declared transaction values, while recovering, have not kept pace. The gap is collateral you cannot easily liquidate.
The NRB is publishing this data quarterly going forward. The timing is significant: the first report lands in a week when real estate transactions hit a three-year high and NRB simultaneously has Rs.2 trillion sitting idle in the banking system with 4.4% credit growth. The implication of the report does not state explicitly: if that idle liquidity starts moving into real estate, the only asset class with momentum, loan growth and transaction decoupling could widen further. Nepal has done this cycle before. It ended in 2022/23 with a crash to Rs.8.2 billion revenue. The difference this time is that the NRB will have data to see it coming quarterly rather than discovering the damage in hindsight.
The seasonal pattern is unmistakable: Q1 always weakest, Q3–Q4 always strongest. But the trend line running through those peaks is definitively up. The question is whether this is genuine economic activity or credit-fuelled price inflation in a market with thin actual turnover.
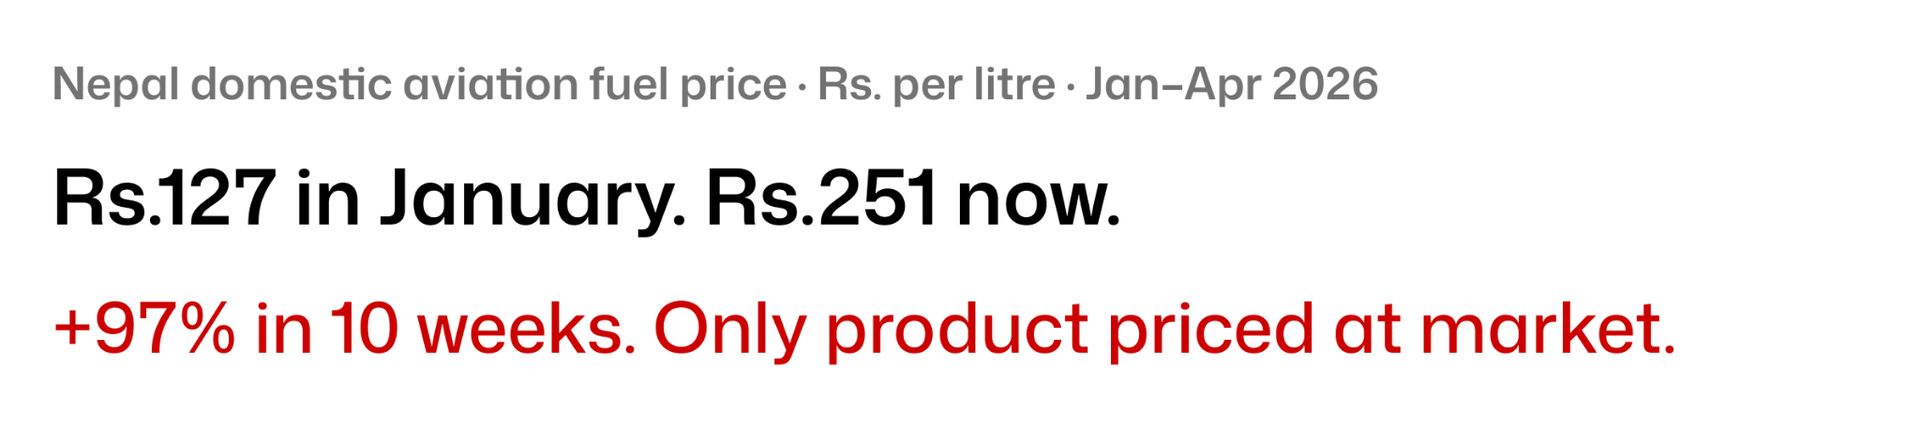
2.Nepal's domestic airfares just jumped up to Rs.5,480 per route. It's the worst possible week for it to happen
Aviation fuel in Nepal went from Rs.127 to Rs.251 per litre in six weeks, a 97% increase. That is not a rounding error. The Civil Aviation Authority adjusted domestic fares on every route the moment NOC raised aviation fuel prices. Kathmandu to Dhangadhi: Rs.11,090, up Rs.5,480. Mountain flights: up Rs.4,225.
This happened during the second week of Baisakh, which is peak trekking season. March through May is when Nepal earns roughly 35-40% of its annual tourism revenue. International flights were already being disrupted by Gulf-route instability. Aviation fuel nearly doubled is the domestic layer on top of that.

The NOC doubled aviation fuel because it was the one product where market pricing was politically possible. All fares from CAAN/AOAN published schedule effective April 1, 2026. "Before" fares back-calculated from confirmed surcharge increases. Upper-limit fares are 50–60% higher than lower limits shown here.
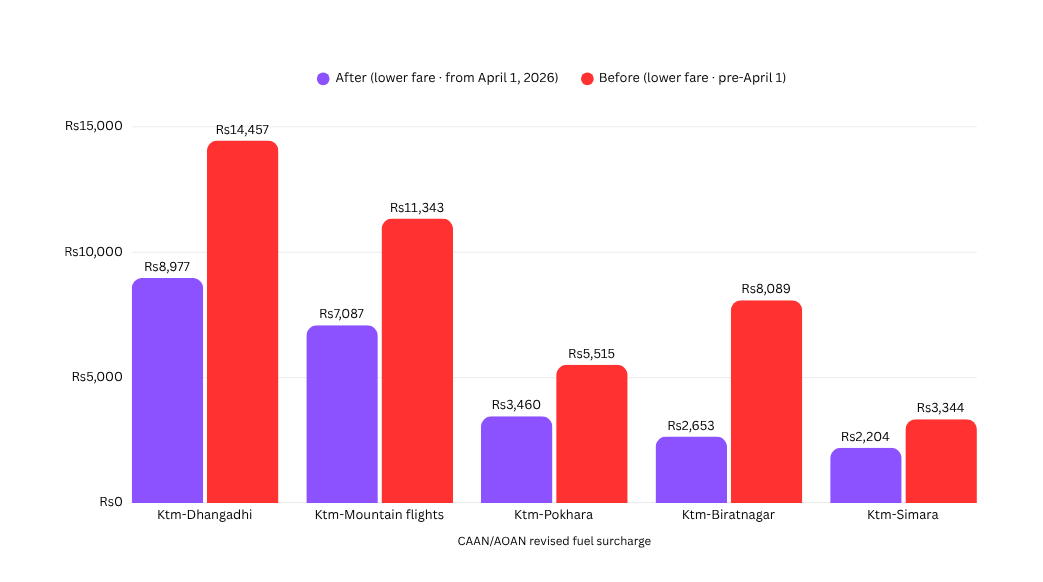
The Lukla number is the one that matters for international tourist spending. Lukla is the gateway to Everest Base Camp, Nepal's single most iconic trekking destination and a significant driver of high-spend international arrivals. Flights there went from roughly Rs.7,400 to Rs.13,200. For a foreign trekker that is approximately USD 70, annoying but not trip-cancelling. For the local operators, guides, and porters whose entire annual income is concentrated in this ten-week window, a demand shock that reduces arrivals by even 5-10% is the difference between a good year and a bad one.
March 2026 saw 120,516 tourist arrivals, a healthy number given the disruption. April and May data are not yet available. But the fare hike landed on April 2, right as the spring season hit its peak. The question is whether international visitors who had already booked absorbed the higher fares, or whether the Gulf-route disruption to their connecting flights and the domestic fare hike together pushed enough people to cancel or postpone.
Every other fuel, diesel, petrol, LPG, the NOC absorbs the loss rather than passing it to consumers. Aviation fuel is the exception. The NOC raised it to near cost-recovery, which means airlines absorb zero subsidy and consumers see the full crude price spike in their ticket prices.
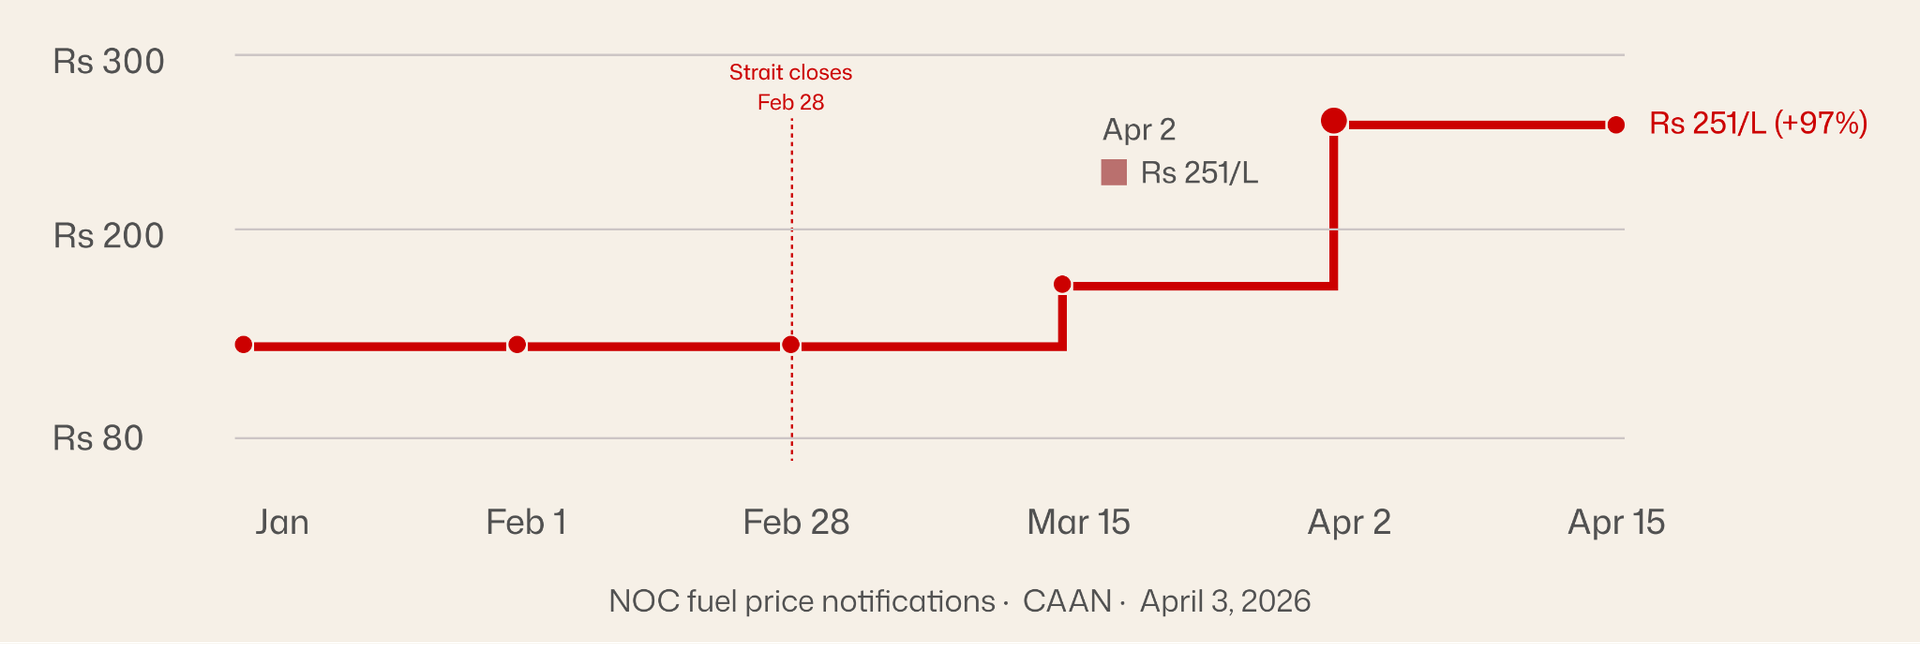
The stepped chart is the right format here. Aviation fuel did not drift up, it jumped in discrete increments on specific dates. The first jump was absorbing part of the NOC loss on March 15. The second, larger jump on April 2 was the government deciding aviation was the sector that could bear full market pricing. Both jumps happened while the spring trekking season was either approaching or running.
Tourism's seasonal concentration is what makes this timing brutal.

Nepal's tourism is not spread evenly. Spring (Mar–May) and autumn (Oct–Nov) account for roughly 60% of annual arrivals, spring alone is 30%+. A demand shock during these 10 weeks does not just affect this month's revenue. It sets the GDP trajectory for the quarter. March 2026 came in at 120,516 arrivals. April and May data will tell the full story.
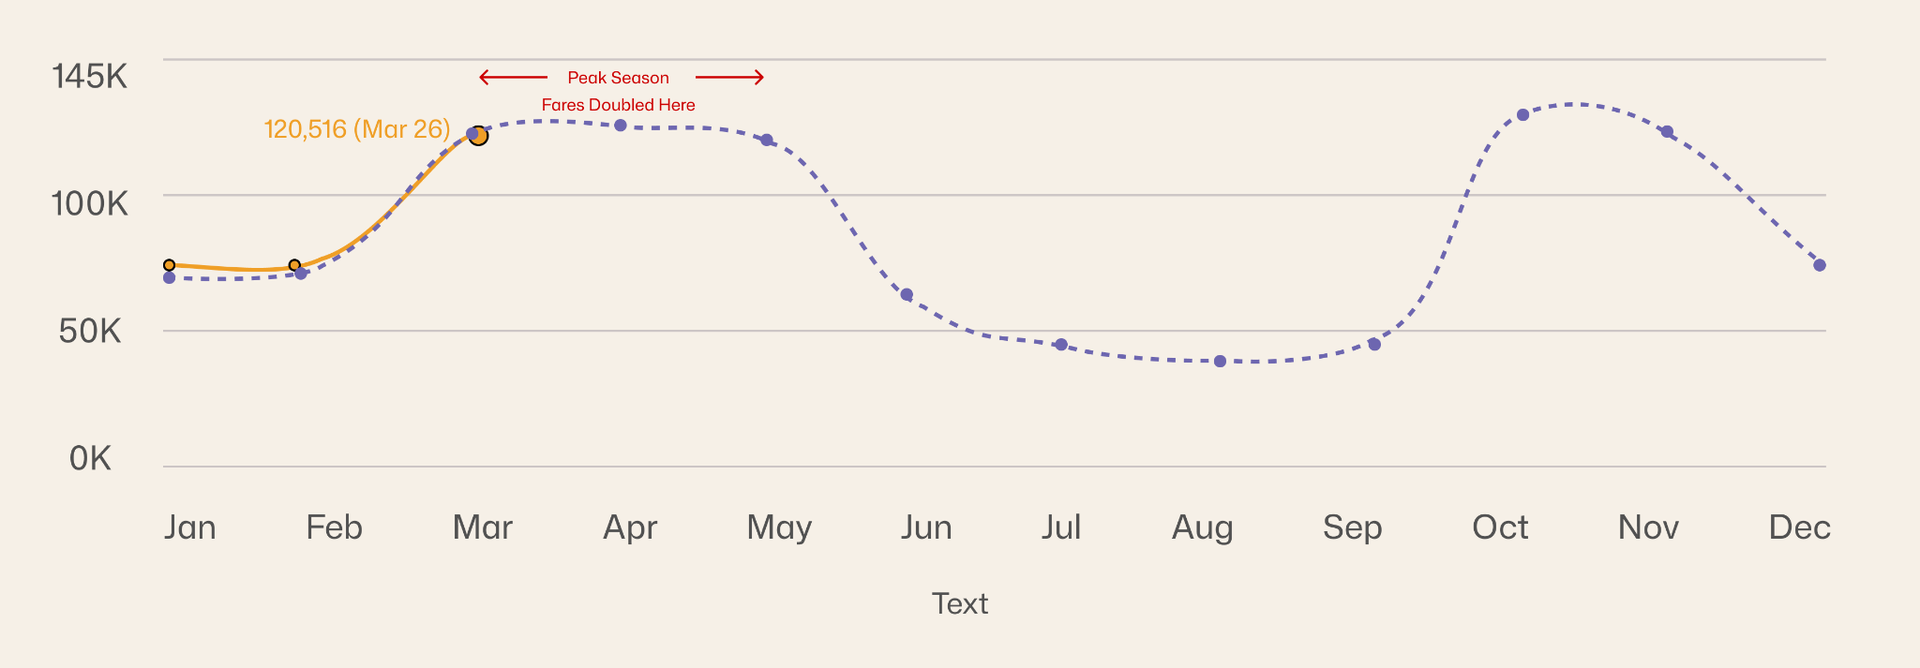
March 2026 came in at 120,516, roughly in line with March 2025. That sounds fine. But the fare hike landed on April 2. The demand shock from doubled aviation fuel prices has not yet shown up in the arrivals data because April data isn't published. When it is, probably in six weeks, it will tell whether the trekking season survived the double hit of Gulf-route disruption and domestic fare doubling, or whether Nepal's most valuable ten weeks of the year took a measurable hit.
3. Nine months in. 23% spent. That’s the story.
This is not a normal year of underperformance. This is the year Nepal's new majority government, the first clean mandate in over a decade, said reconstruction and infrastructure investment would drive the recovery that the World Bank is projecting at 2.3% GDP growth. The FCGO released the 9-month data this week. Rs.96.19 billion spent of Rs.407 billion allocated. That is 23.58%.
The prior year at the same point: 29.2%. Nepal is not just executing below the historical norm. It is executing below last year, a year that itself ended with a capital budget sprint that produced mediocre outcomes.
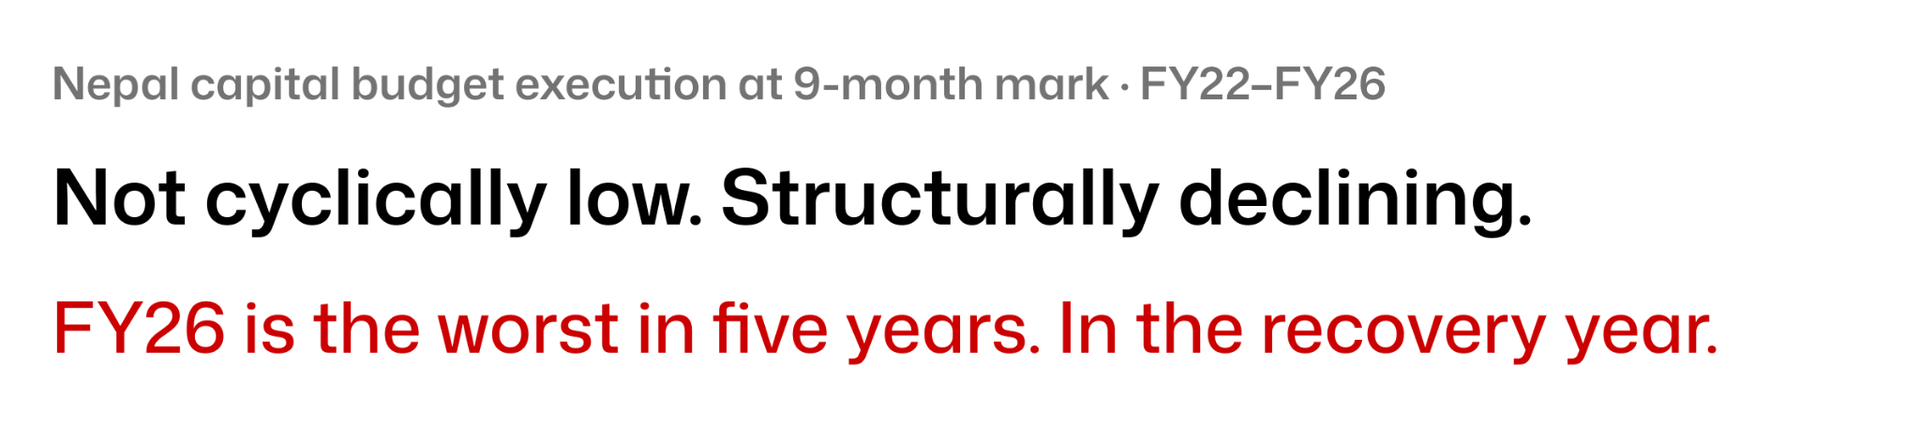
The trend line through these points is going down, not sideways. Nepal is not just consistently behind, it is falling further behind each year. FY26 was supposed to be the year reconstruction spending kicked in. Instead it set a five-year low at the 9-month mark.
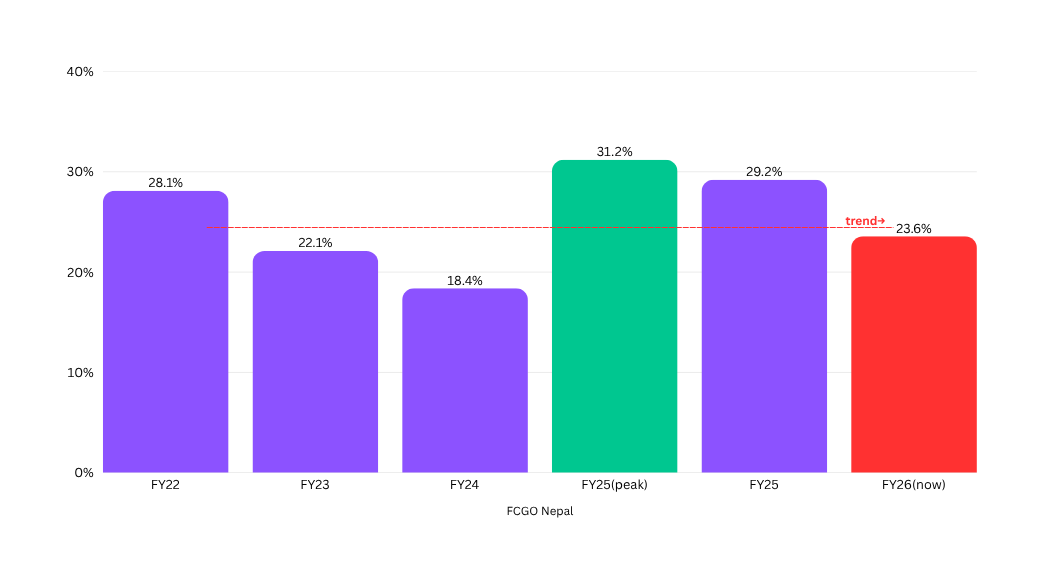
The trend line is the point. This is not a bad year on top of a stable baseline. The baseline itself is declining. Nepal has been executing less of its capital budget at the 9-month mark every year. The FY25 reading of 29.2% was itself below FY22's 28.1%. FY26 at 23.58% is another leg down. The recovery of the World Bank models assumes reconstruction spending driving FY27 growth but reconstruction requires contracts awarded now, projects tendered now, works started now. If the year ends at 23.58%, the pipeline entering FY27 is thinner than any year before it.
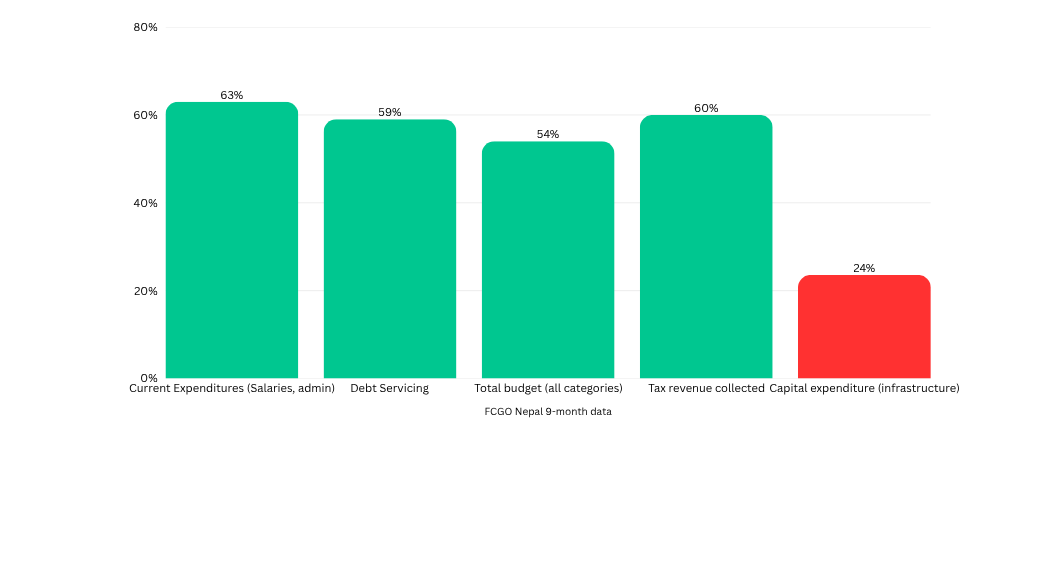
The gap between how the government spends different categories of money makes the capital story even more stark. Salaries and current expenditure are tracking fine. Only infrastructure is lagging by a structural margin.
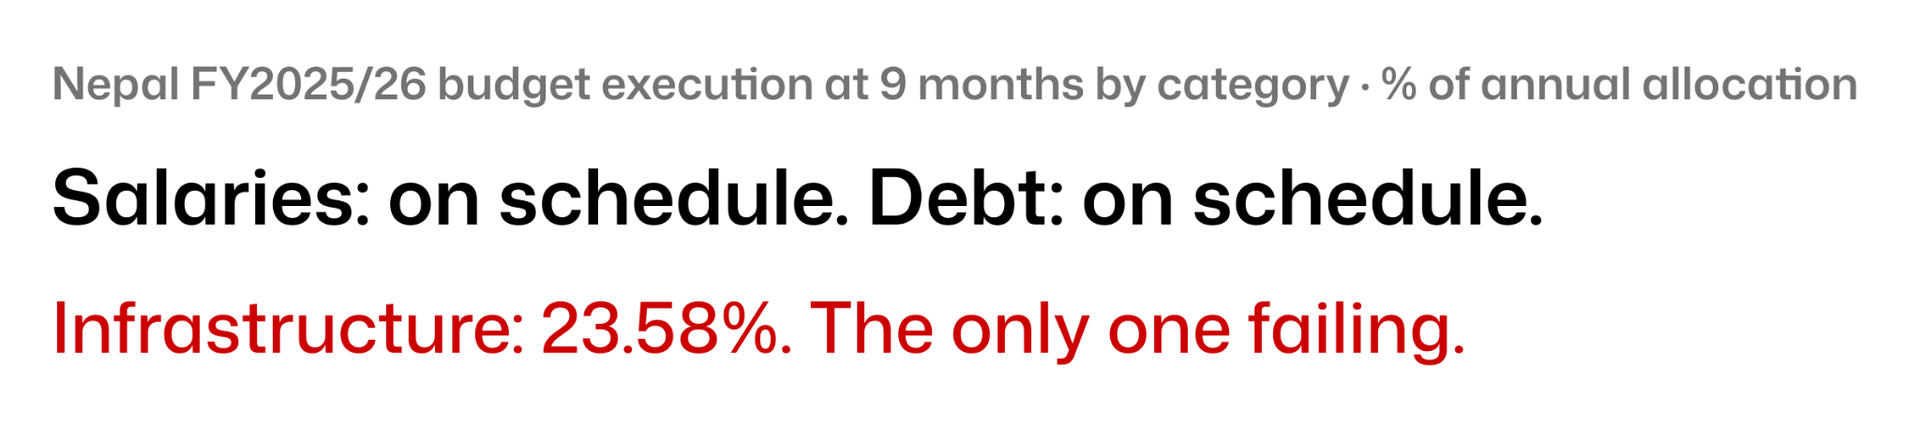
This is what selective underspending looks like. The government pays its staff, services its debt, and collects its revenue, all tracking 55–65% in 9 months. Only the category that builds physical things is catastrophically behind. The capital budget is not underspent because the money is not there. It is underspent because nothing is being built.
Now comes the math question the chart raises but doesn't answer: what does Nepal actually need to spend in the remaining three months to reach any meaningful execution rate?
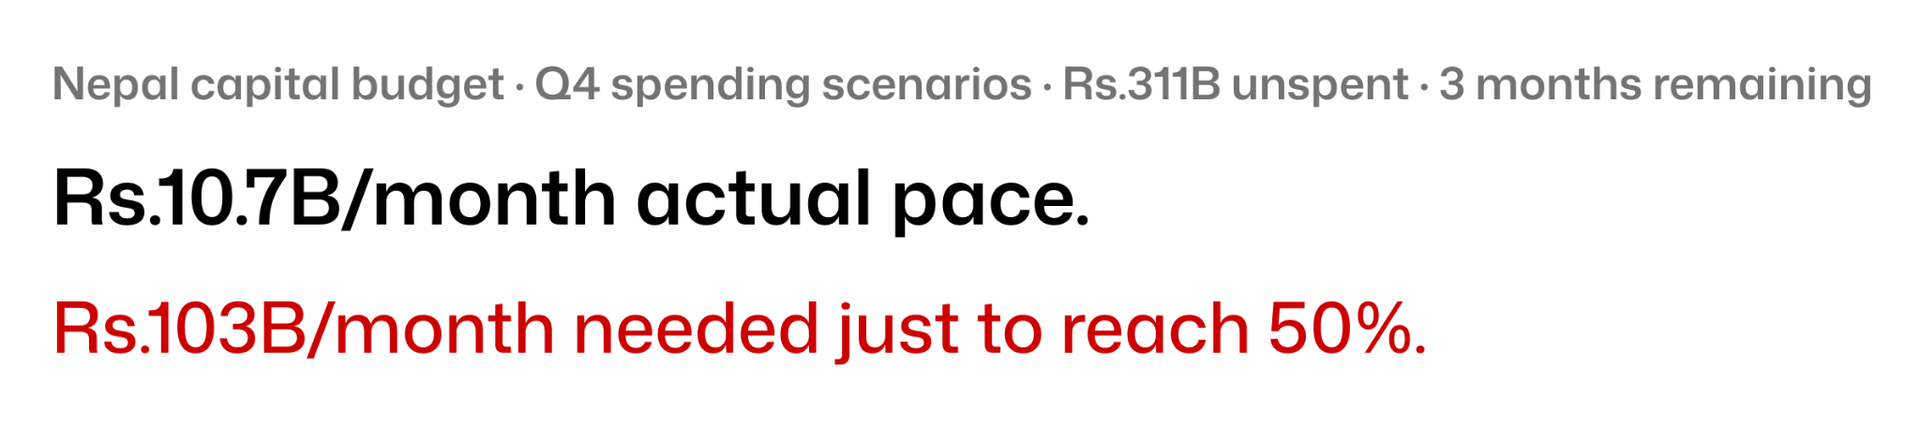
The first 9 months averaged Rs.10.7 billion per month. To reach any respectable full-year execution rate, Q4 needs to run at a pace Nepal has never historically achieved and this year, construction is at 15–20% capacity.
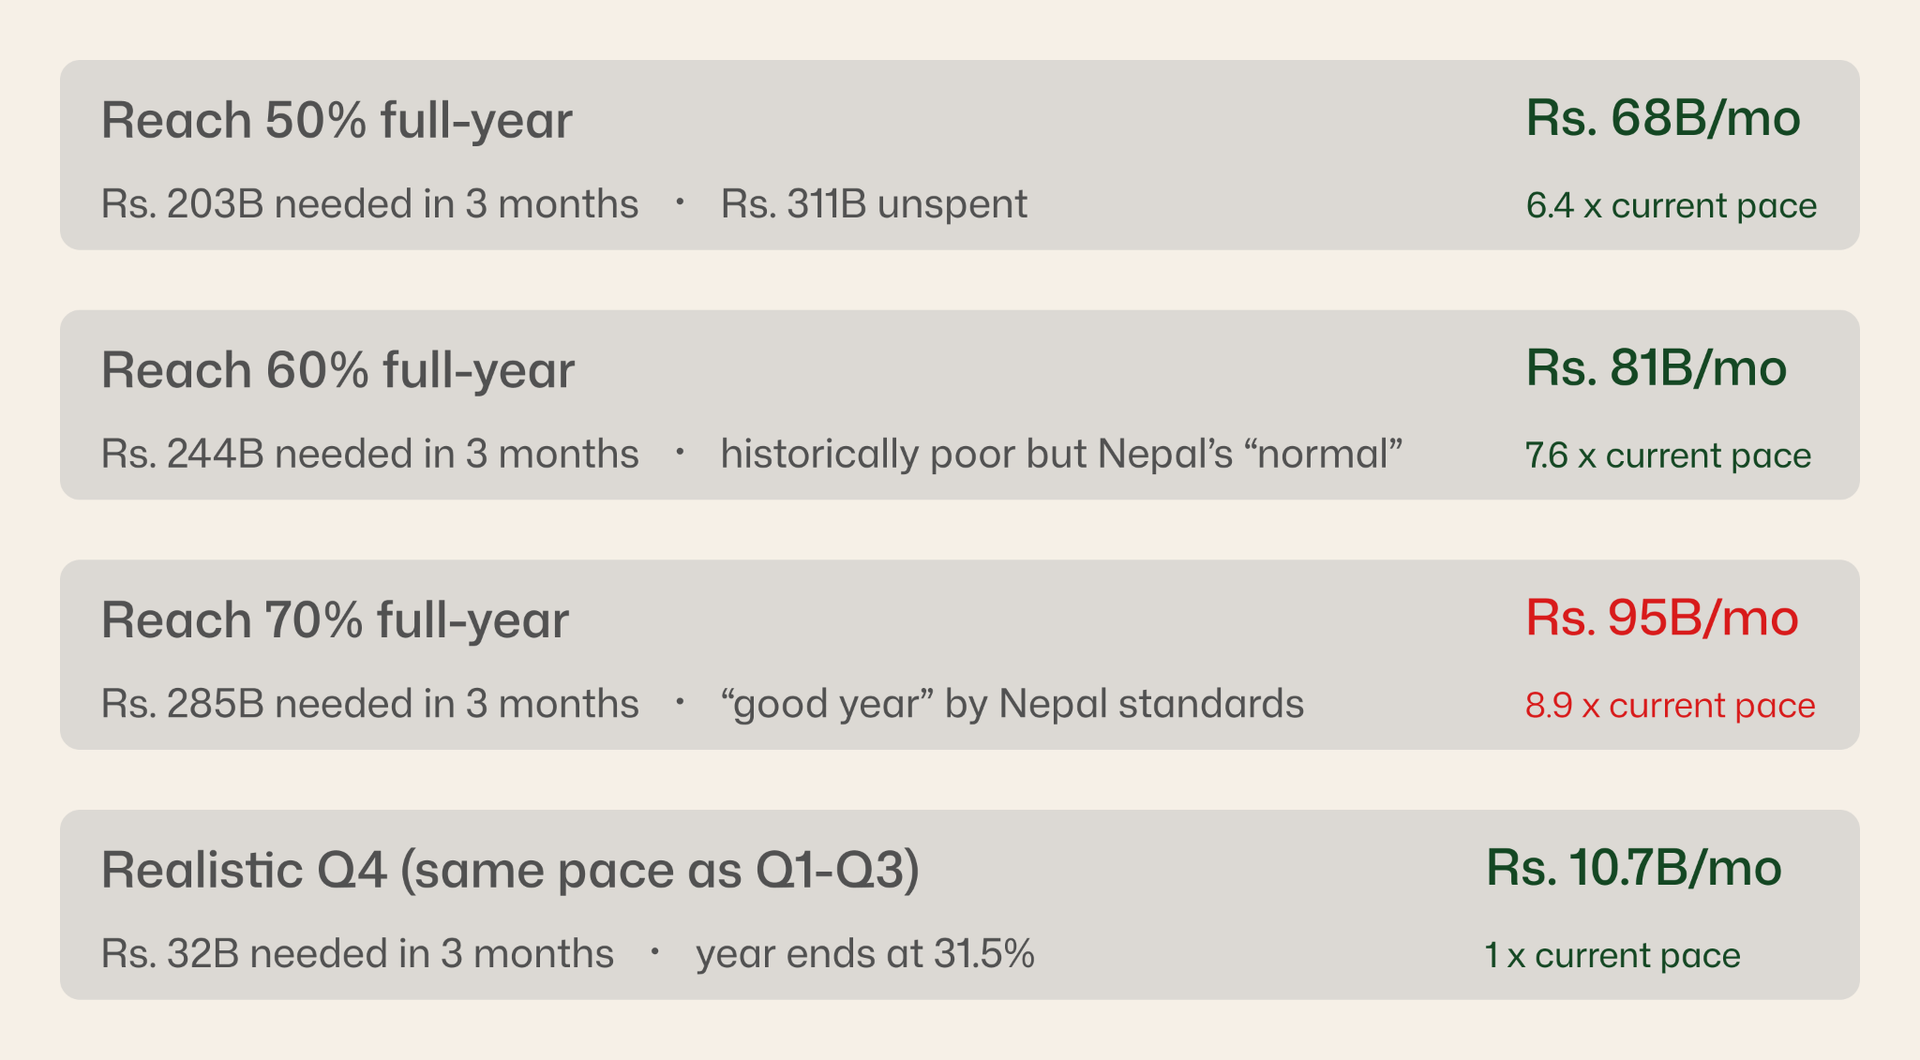
Even reaching a historically mediocre 60% execution rate requires spending 7.6× the current monthly pace for three consecutive months during the monsoon. Nepal's typical monsoon sprint pushes execution to 50–60% by year end but this year, with construction at 15–20% capacity and contractors refusing to work at current material prices, the sprint is impaired before it starts.
And the problem is not just national. It goes all the way down to the provinces where, if anything, it is worse.
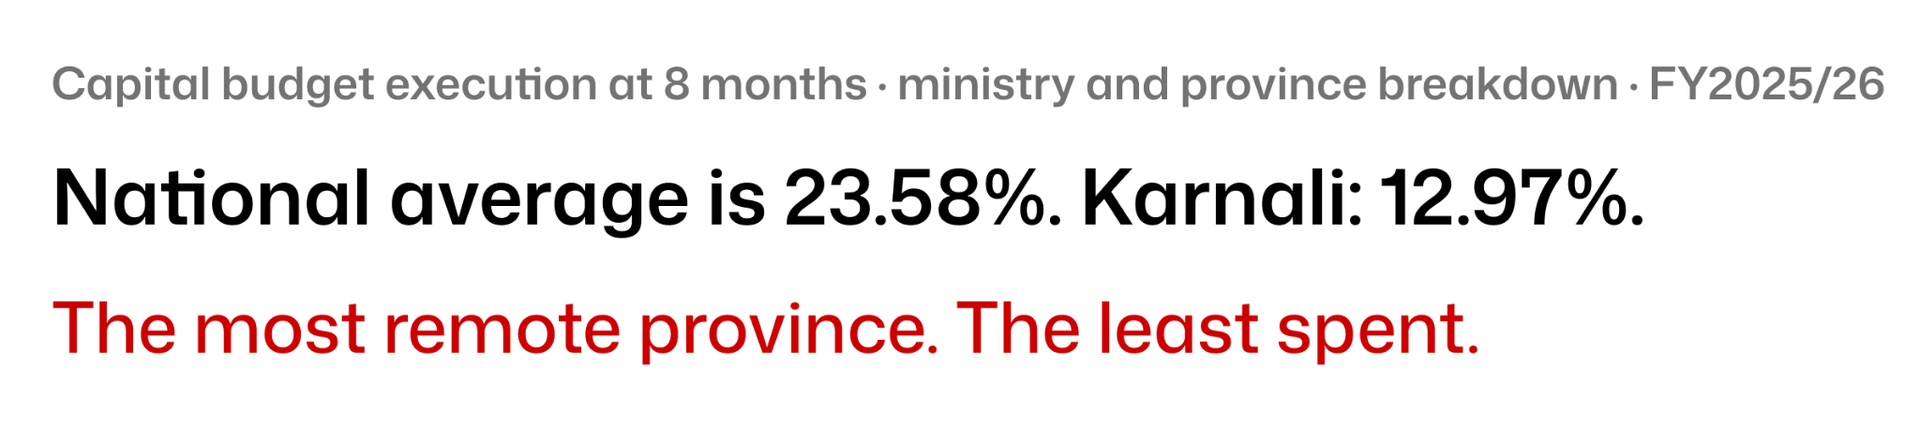
The national number flatters what is happening at the provincial and ministry level. The Ministry of Physical Infrastructure responsible for building Nepal's roads, bridges, and water systems has spent 15% in 8 months. Karnali's Industry and Tourism ministry: 3%. These are the institutions most responsible for closing Nepal's infrastructure gap.
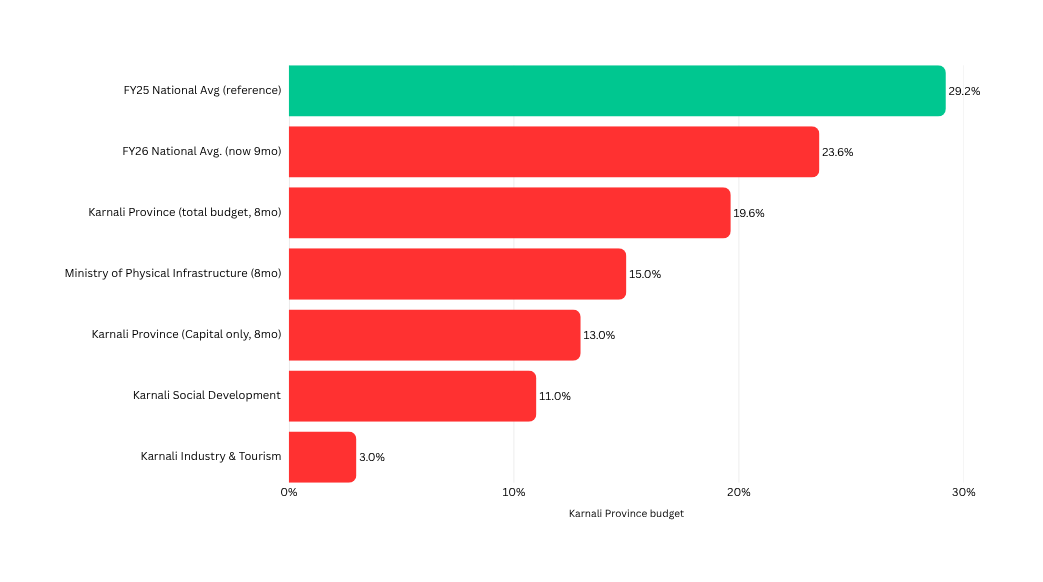
Karnali Industry and Tourism at 3%. This is a province that has barely any industry and depends almost entirely on government spending to build the roads and bridges that make it connected to the rest of the country. The ministry responsible for that work has spent 3% of its annual budget for 8 months. In a year when the fuel crisis has halted construction everywhere, and when Rs.311 billion sits on paper waiting for contractors who cannot work at current material prices, these numbers at the provincial level are not surprising. They are the logical endpoint of a broken system running into an external shock.