The World's Most Expensive Coca-Cola Bottler?
Bottlers Nepal Limited (BNL) is trading at a premium valuation despite reporting its first audited loss in five years, declining revenues, and three consecutive years without dividends
A Coca-Cola franchise trading at over 4x book value and 97x its best recent quarterly earnings, while the underlying business just posted its first audited loss in five years. The valuation has detached from the fundamentals.
Our View
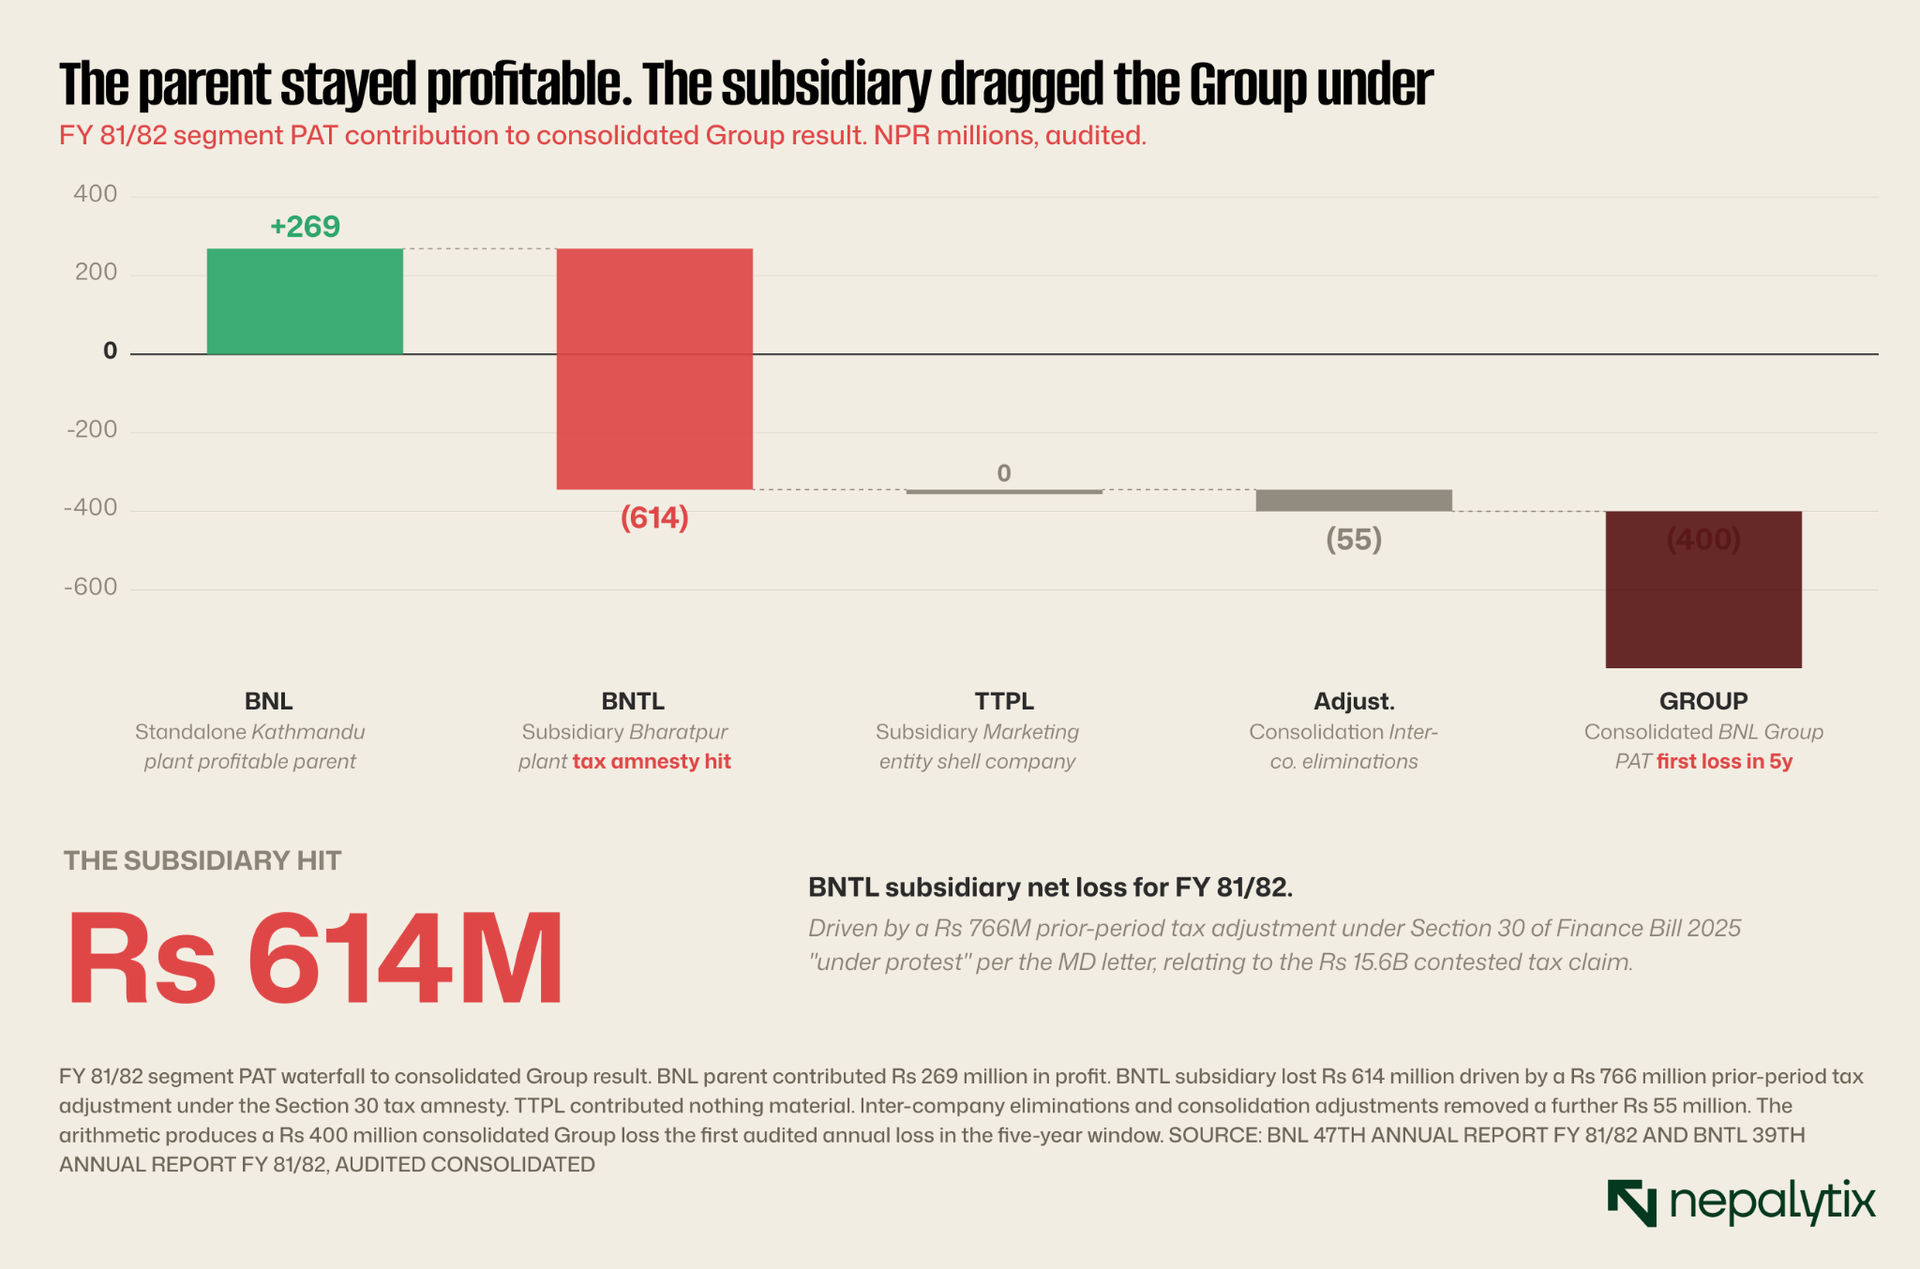
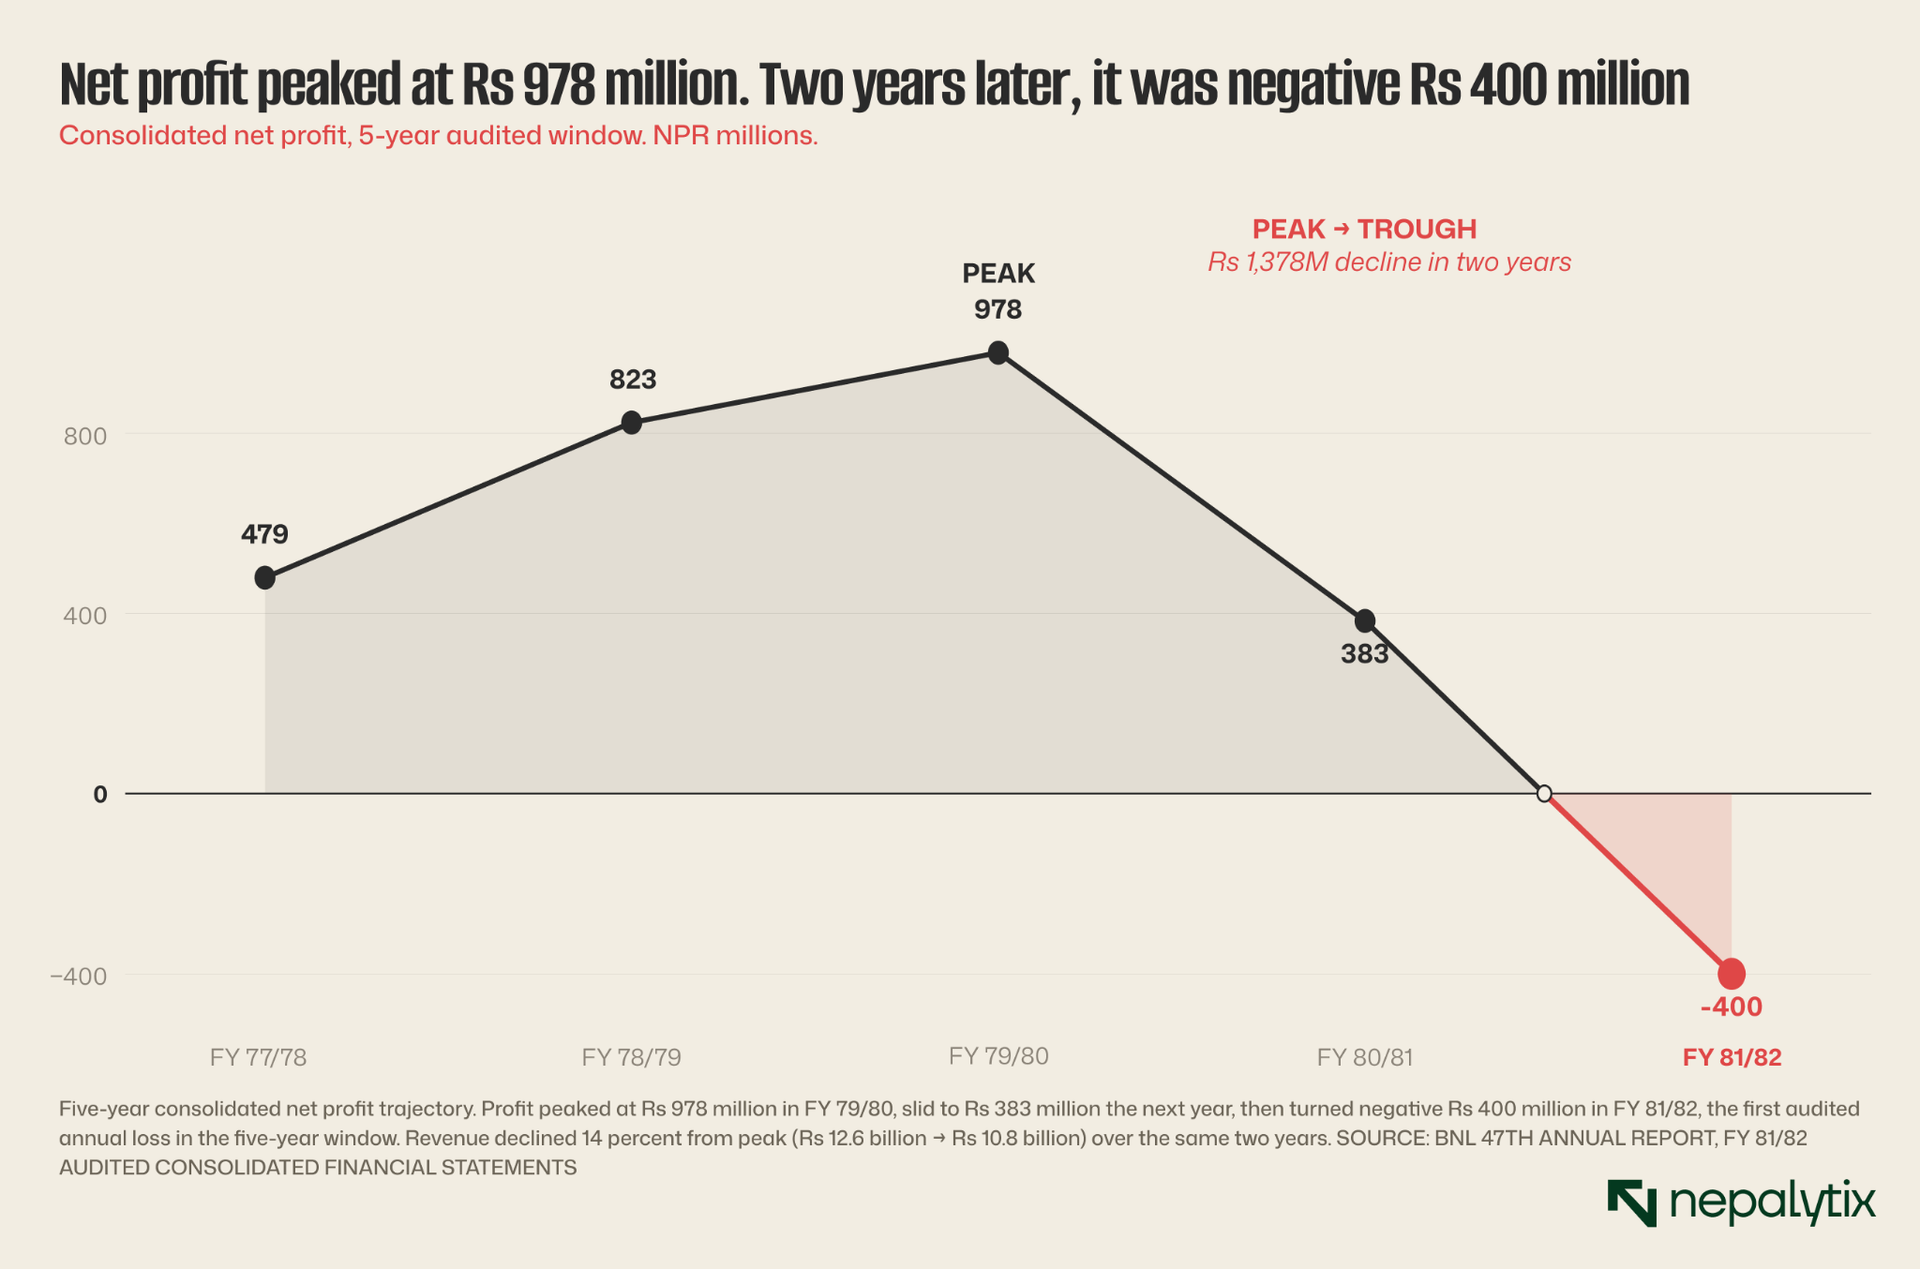
Bottlers Nepal Limited's audited FY 2081/82 consolidated financials show the first annual net loss in the five-year window Rs 400 million, driven by a Rs 766 million prior-period tax adjustment under the Section 30 tax amnesty in Finance Bill 2025. Revenue declined for the second consecutive year. EBITDA margin compressed from 17.9 percent to 15.1 percent. ROE turned negative at minus 6.4 percent. The board has declared no dividend, the third consecutive year of zero distribution; the last cash dividend (20 percent for FY 78/79) was paid in December 2022. Despite the operating deterioration, the stock has re-rated 7.6x from Rs 2,312 (FY 79/80 close) to Rs 14,742 (May 2026), pricing in a recovery that the operating data does not yet support. At 4.6x book value and 97x trailing-quarter annualised earnings, against a global Coca-Cola bottler peer median of 15x, BNL is the most expensive listed Coca-Cola system bottler in the world on a P/E basis. Coverage initiated with caution. The valuation gap implies asymmetric downside risk. A DCF anchored to primary-source 9-month FY 82/83 earnings (Q1+Q2+Q3 net profit Rs 220 million, annualised to Rs 293 million) supports an intrinsic value range of Rs 828-1,513 per share — 90-94 percent below the current market price. The bull-case scenario, assuming a full earnings recovery to Rs 600-700 annualised EPS and a 25x premium multiple, supports a price range of Rs 15,000-17,500 — modest upside at best. The risk-reward is skewed sharply against new long positions.
What BNL actually owns and why it is not enough
Bottlers Nepal Limited is the sole authorised bottler and distributor of The Coca-Cola Company's products in Nepal, a position the group has held since local production began in 1979. The group structure runs through three entities: BNL itself (incorporated 1979, plant in Balaju, Kathmandu), its approximately 91-percent-owned subsidiary Bottlers Nepal (Terai) Limited (BNTL, incorporated 1987, plant in Bharatpur), and the wholly-owned Troika Traders Private Limited (TTPL), which functions as a marketing and distribution subsidiary. Together these three entities operating under the brand portfolio of Coca-Cola, Sprite, Fanta, Coke Zero, Fanta Lemon, Sprite Zero, and Kinley constitute the entire authorised Coca-Cola system in Nepal.
The Group's majority shareholder is Coca-Cola Southwest Asia Holdings Limited (formerly Coca-Cola SABCO Asia Limited), the regional holding entity through which TCCC's anchor-bottler system operates in the Indian subcontinent. Per ICRA Nepal's July 2025 rating note, Coca-Cola Southwest Asia Holdings holds approximately 76 percent of BNL's equity, with Gorkha Brewery Private Limited holding 22 percent and the residual two percent held by public shareholders. This is the structure within which the public float trades. BNL is therefore a controlled minority float, not a widely-held public company.
The franchise itself is genuinely defensible. There is no second authorised Coca-Cola bottler in Nepal. The two production plants together represent the entirety of legitimate Coca-Cola production in the country. The brand portfolio is managed and curated by TCCC globally, and the relationship has been continuous since 1979 — nearly five decades of operating history. Recent product launches (Fanta Lemon in March 2025, Coke Zero Returnable Glass Bottle expansion, the "Drink N Win" consumer promotion) demonstrate that the parent system is still investing operationally in the Nepal market. The strategic position is intact. The problem is not strategic; it is financial.
Revenue contraction, margin compression, and the first audited loss
The Group's consolidated revenue peaked at Rs 12.62 billion in FY 2079/80 (mid-2023). Since then, two consecutive annual revenue declines: FY 80/81 fell 11 percent to Rs 11.23 billion, and FY 81/82 fell a further 4 percent to Rs 10.79 billion. The cumulative two-year decline is 14.5 percent. Over the same period, regional consumer-goods peers (Varun Beverages, Coca-Cola HBC) grew revenue at mid-to-high single digits annually. The BNL trajectory is materially worse than industry comparators.
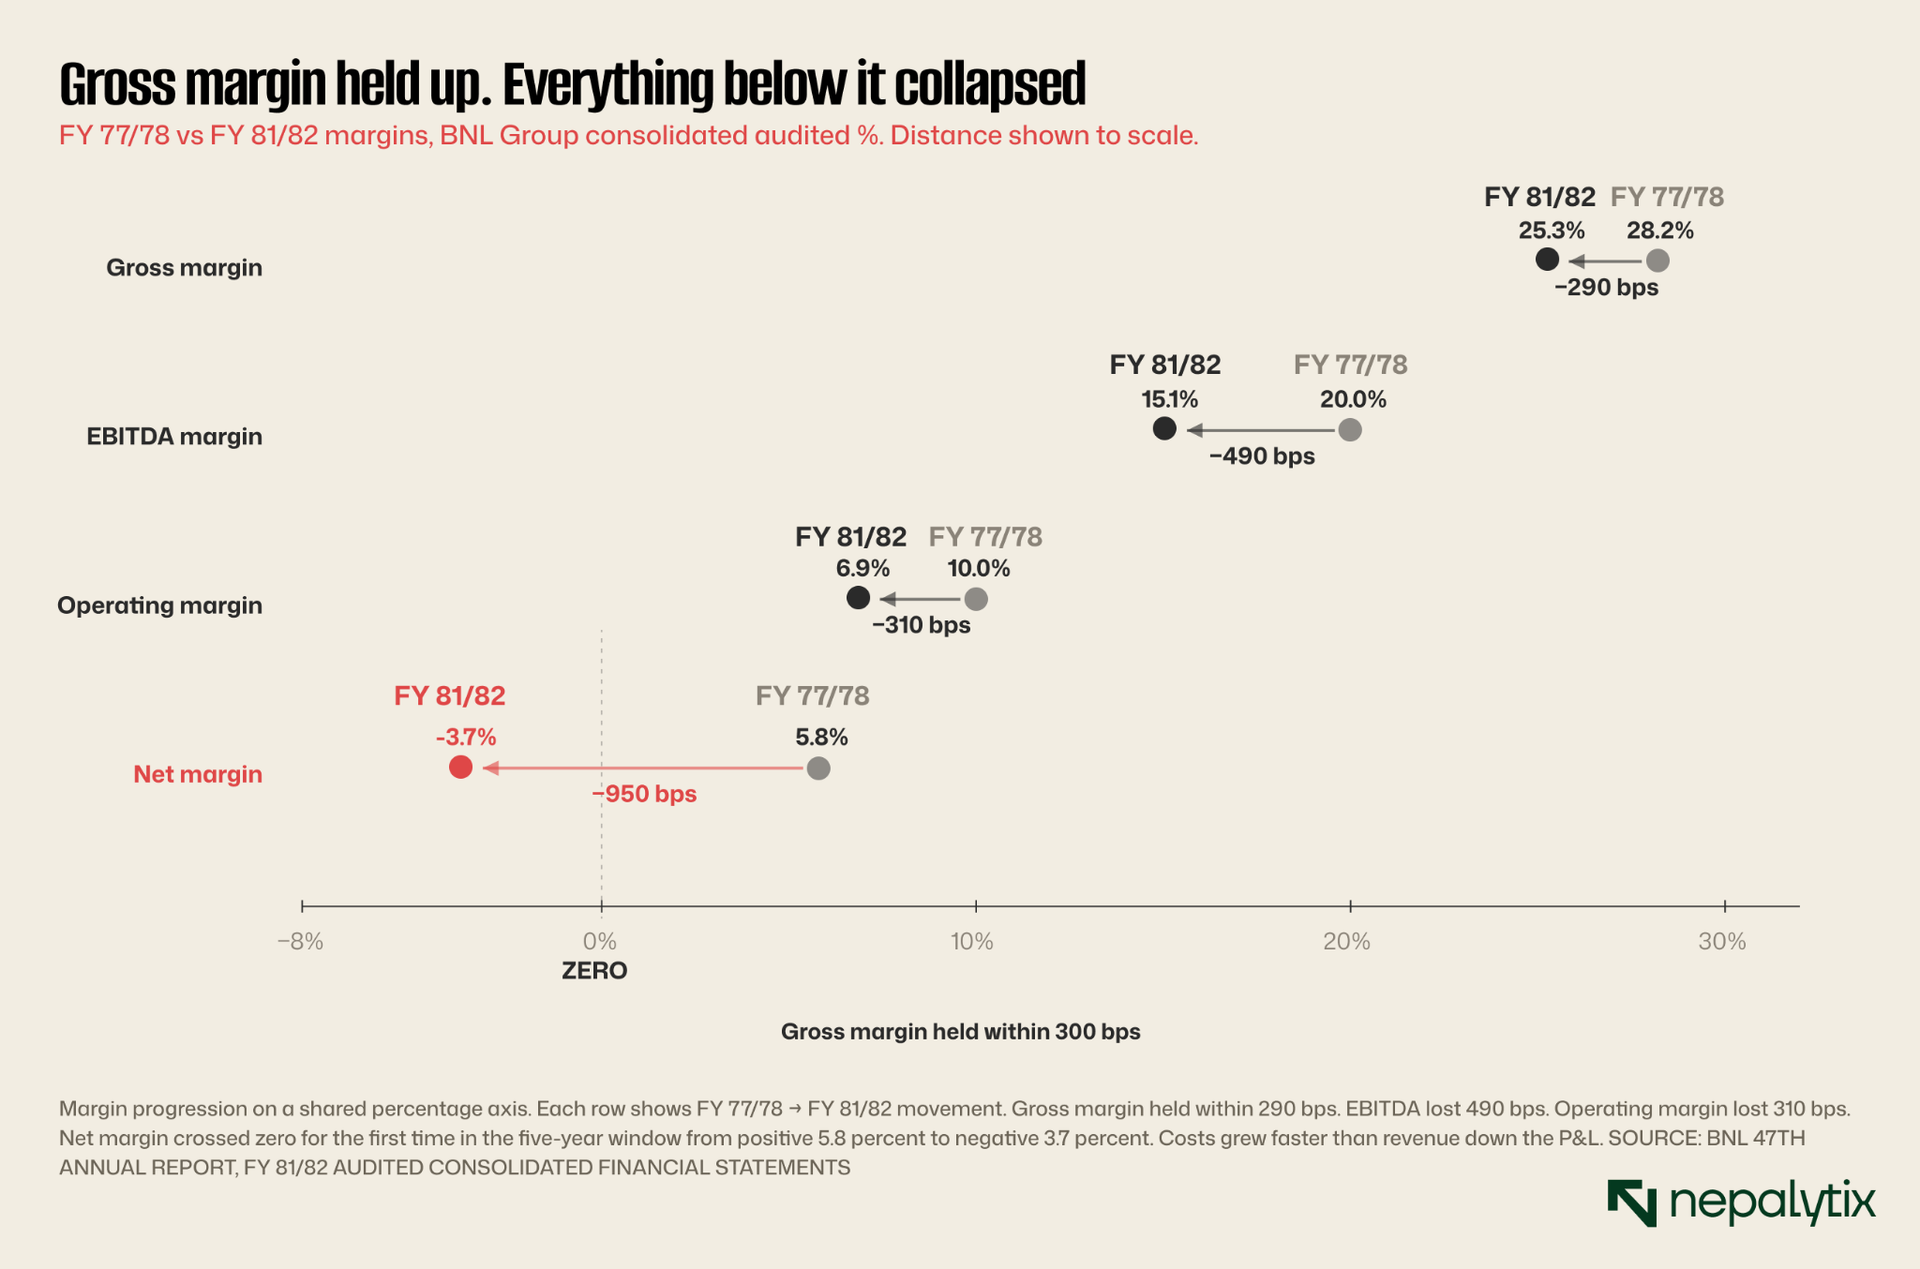
The margin compression is more concerning than the revenue decline. Gross margin fell from 28.2 percent (FY 77/78) to 25.3 percent (FY 81/82) a 290 basis point contraction. EBITDA margin compressed from 20.0 percent to 15.1 percent, a 490 basis point decline. Operating margin fell sharply, from 10.0 percent to 6.9 percent, a 310 basis point compression. Net margin turned negative for the first time. The cost structure has reset higher and pricing power has eroded — a combination consistent with the disclosed seven-percentage-point market share loss (from 61 percent to 54 percent over the nine months of FY 81/82, per Bajarko Chirfar July 2025 coverage).
The Managing Director's commentary in the FY 81/82 annual report explicitly attributes the operating challenges to: "outward migration of youth, lower relative affordability of products driven by higher input costs leading to higher consumer pricing. Unpredictable weather is another challenge that impacts the growth of our business." The disclosed driver of the loss is more specific: "profit after tax declined vs prior year as we availed tax amnesty via section 30 of Finance Bill 2025 albeit under protest for subsidiary BNTL." The Rs 766 million prior-period tax adjustment (verified from the consolidated P&L vertical analysis) flows directly from this decision.
The Rs 15.6 billion tax overhang
The single most material item on BNL Group's contingent liability list is not in the audited financials at face value it is in ICRA Nepal's July 2025 surveillance note, which discloses: "The company has witnessed further increase in its sizeable, contested tax liabilities to ~NPR 15.6 billion (at the group level) related to the majority ownership change in 2014." This refers to capital gains tax claims arising from the 2014 transaction in which Coca-Cola SABCO (now Coca-Cola Southwest Asia Holdings) consolidated its position in BNL.
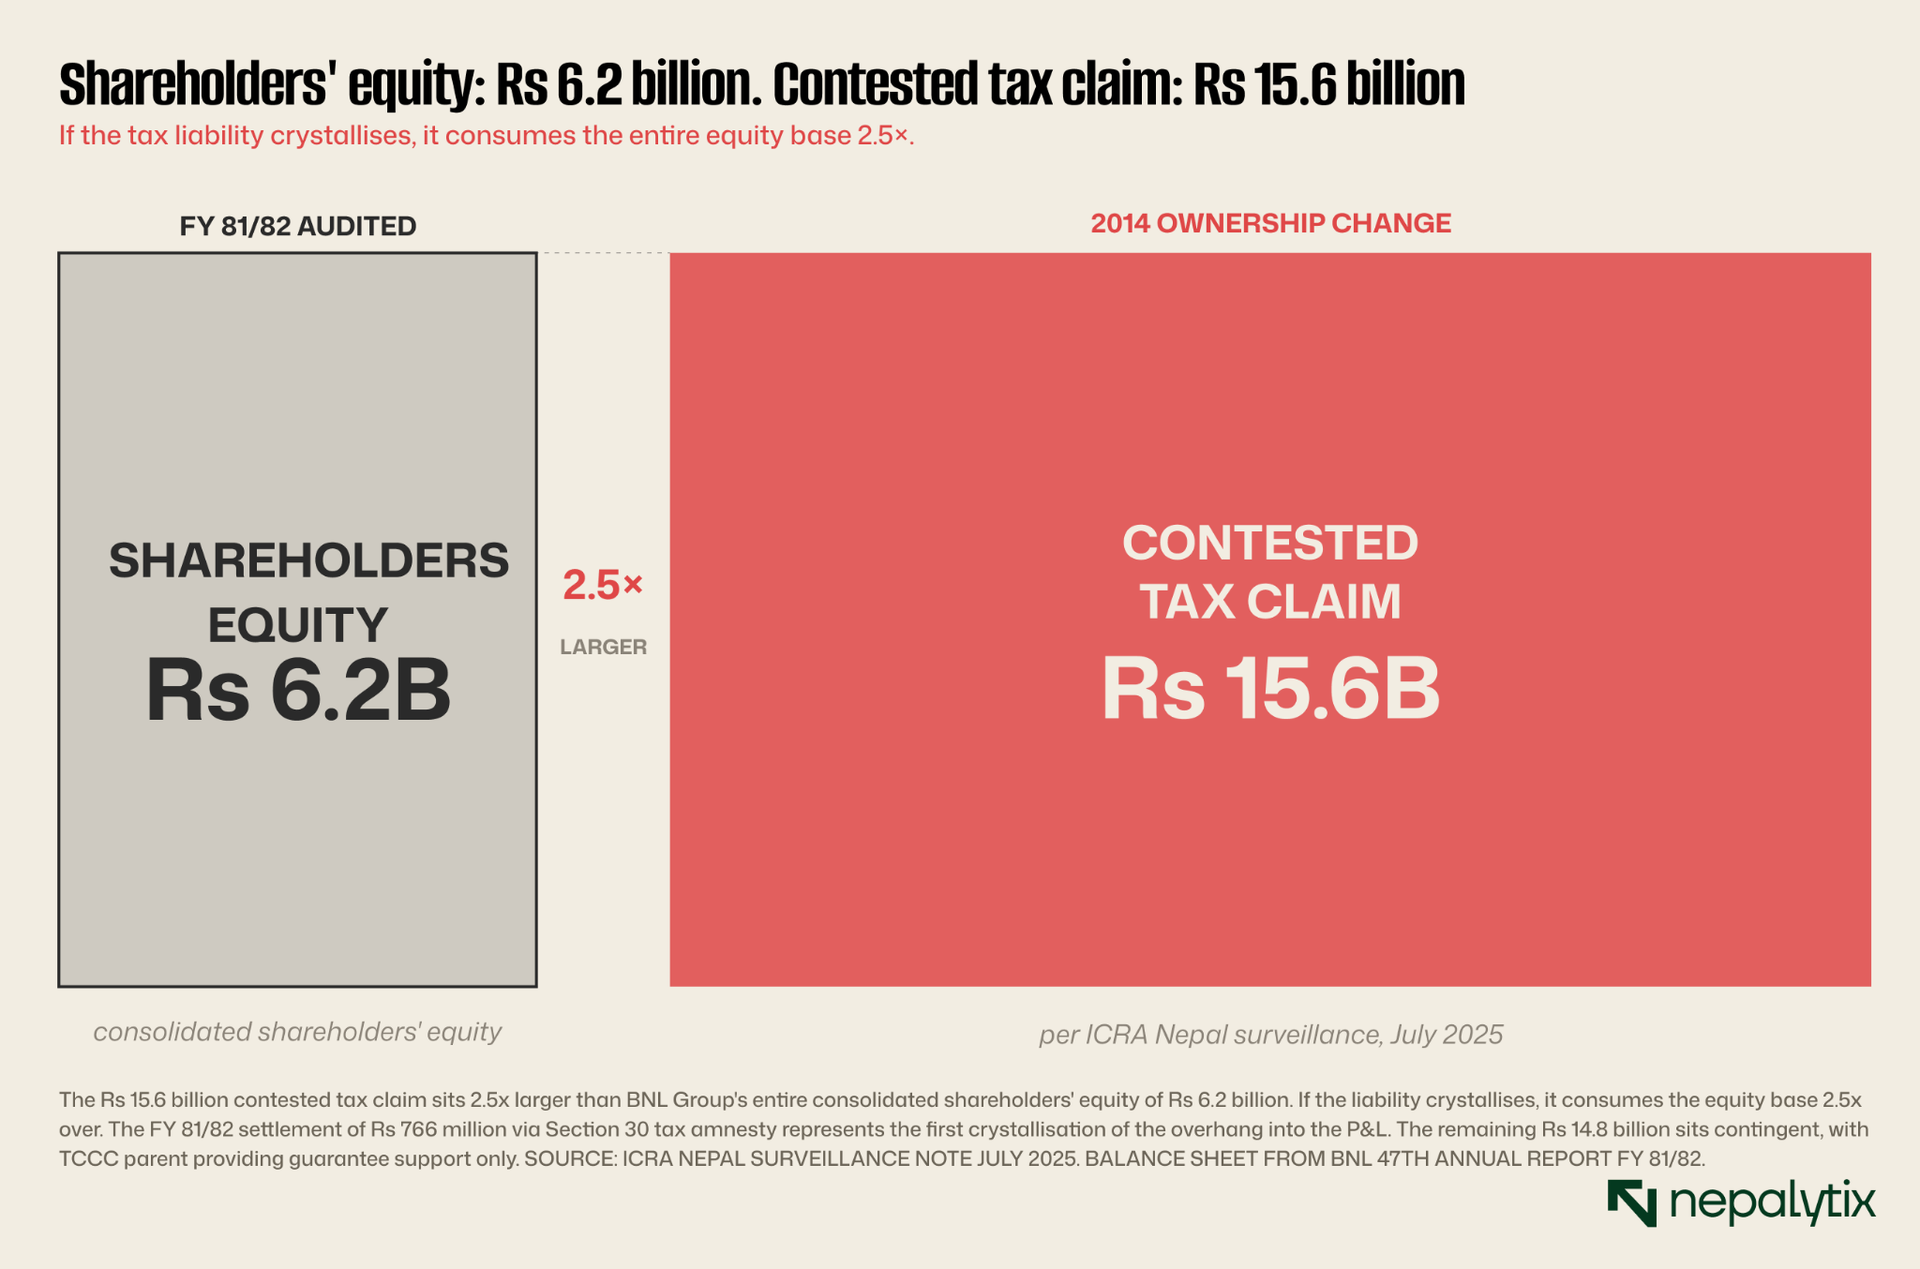
ICRA Nepal's analytical framing: "While the company is contesting the claims made by the tax authorities, the overall tax claim remains significantly higher vis-à-vis the company's net worth or annual operating profits. Hence, any major crystallization of these liabilities and funding of the same through incremental debt in the company's balance sheet, would pressurize its liquidity and financial profile. The TCCC Group has only provided guarantee support so far, which has led to a sharp rise in debt levels, in order to fund the deposit to contest these claims."
The FY 81/82 tax amnesty settlement at BNTL represents the first material crystallisation of this overhang. The Rs 766 million prior-period tax expense in the consolidated P&L is the income-statement impact. If additional portions of the Rs 15.6 billion liability crystallise through similar amnesty settlements, court adverse decisions, or regulatory pressure, the corresponding income statement impact could be a multiple of FY 81/82's. There is no provision for this in the audited balance sheet. The contingent liability sits off-balance-sheet, with TCCC parent guarantees providing the only liquidity support.
The tax overhang is not modeled in standard frameworks
Any equity research framework that values BNL on standard P/E or DCF multiples without explicit consideration of the contested tax liability is omitting the most material single risk factor in the company's financial profile. The Rs 15.6 billion exposure exceeds shareholders' equity by 2.5x. Crystallisation scenarios materially below the headline figure can still wipe out the equity buffer.
The FY 81/82 settlement at BNTL was explicitly "under protest" per the MD's annual report letter, meaning the company has not conceded the underlying tax position even while paying the amnesty amount. This is a strategic capital decision to retire the contestation cost, not an admission of tax liability. But the cash and P&L impact is real, and the precedent now exists for similar settlements on the remaining contested amounts.
The price-earnings disconnect
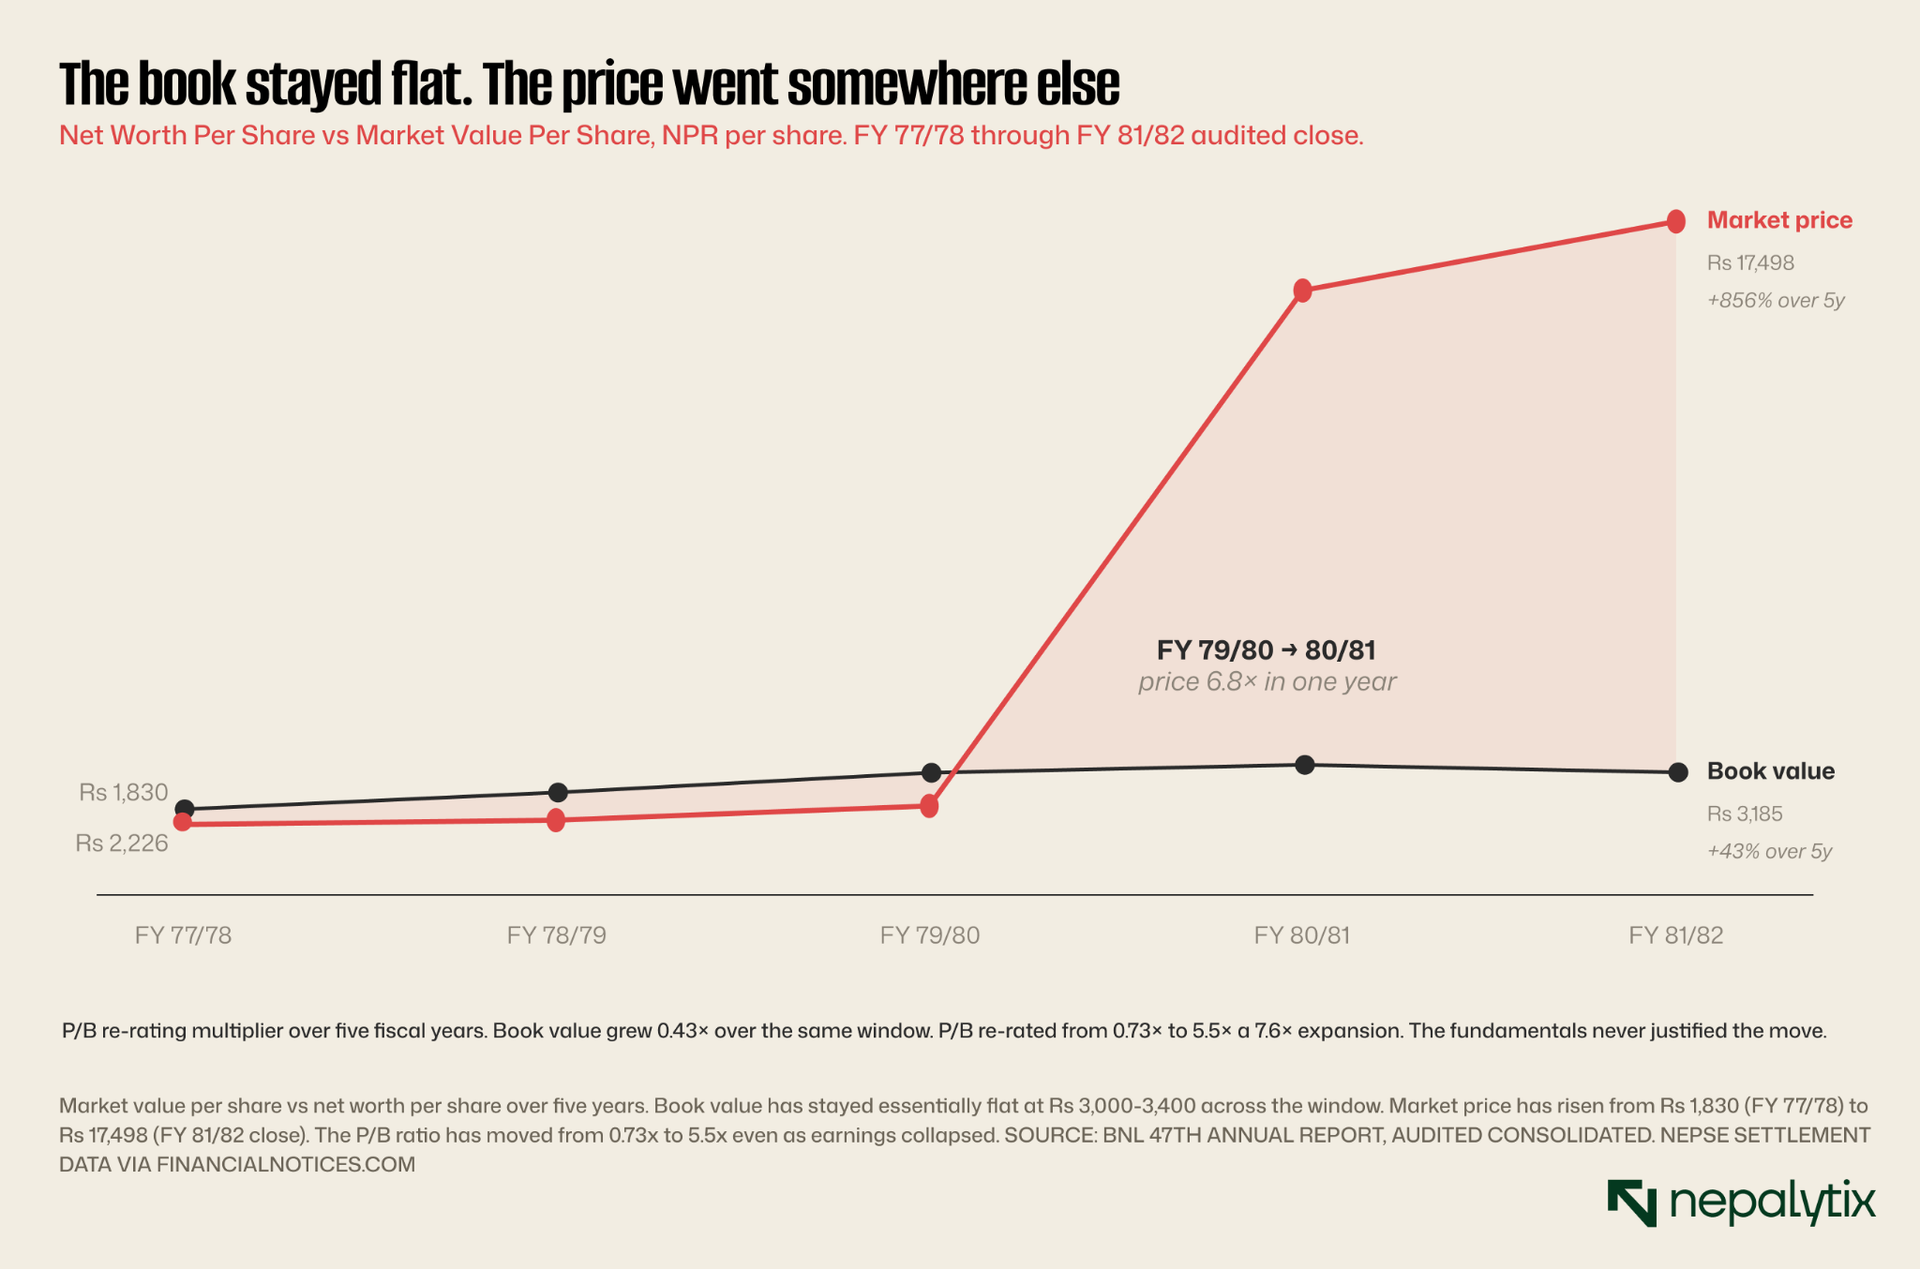
The most striking feature of BNL as a listed equity is not its operating trajectory but the contrast between that trajectory and the market price. At FY 79/80 fiscal close (mid-July 2023), the stock traded at Rs 2,312 a multiple of 4.9x trailing earnings and 0.73x book value. By the end of FY 81/82 (mid-July 2025), with consolidated PAT now negative and the dividend suspended for three years, the stock had reached Rs 17,498, an increase of 7.6x in two fiscal years. Current price (May 18, 2026) of Rs 14,742 represents some retracement from that peak but still leaves the stock at 6.4x the FY 79/80 close.
What does the market think it is pricing? The most charitable interpretation is a future earnings recovery that has not yet shown up consistently in the audited statements. The three FY 82/83 quarterly filings pulled directly from bnl.com.np shows a recovering but highly volatile trajectory: Q1 net profit Rs 322 million (EPS Rs 152 quarterly), driven per the MD letter by "increased productivity and cost efficiency"; Q2 standalone net loss Rs 290 million (driving H1 YTD EPS down to Rs 10 from Q1's Rs 152), attributed by the MD to the Bada Dashain festival timing shifting to Q1 plus Gen Z protests disrupting Q2 trading; Q3 net profit Rs 189 million (Q3 standalone EPS Rs 100), reflecting cost-saving measures and pricing actions. The 9-month YTD net profit is Rs 220 million. If Q4 tracks the YTD run-rate, the full-year FY 82/83 PAT will be approximately Rs 293 million, a recovery from the FY 81/82 loss, but still 70 percent below the FY 79/80 peak.
Three consecutive years of zero distribution
BNL's last cash dividend was 20 percent for FY 78/79, announced December 25, 2022. Since then: FY 79/80 no dividend, FY 80/81 no dividend, board decision November 20, 2024 communicated to NEPSE December 17, 2024 triggering NEPSE's trading suspension for delayed disclosure. FY 81/82 no dividend, board decision November 26, 2025 with the explicit statement from the chairperson's letter: "After careful consideration, the Board has decided not to declare a dividend this year. This decision enables us to reinvest in capacity expansion, digital transformation, and sustainable initiatives."
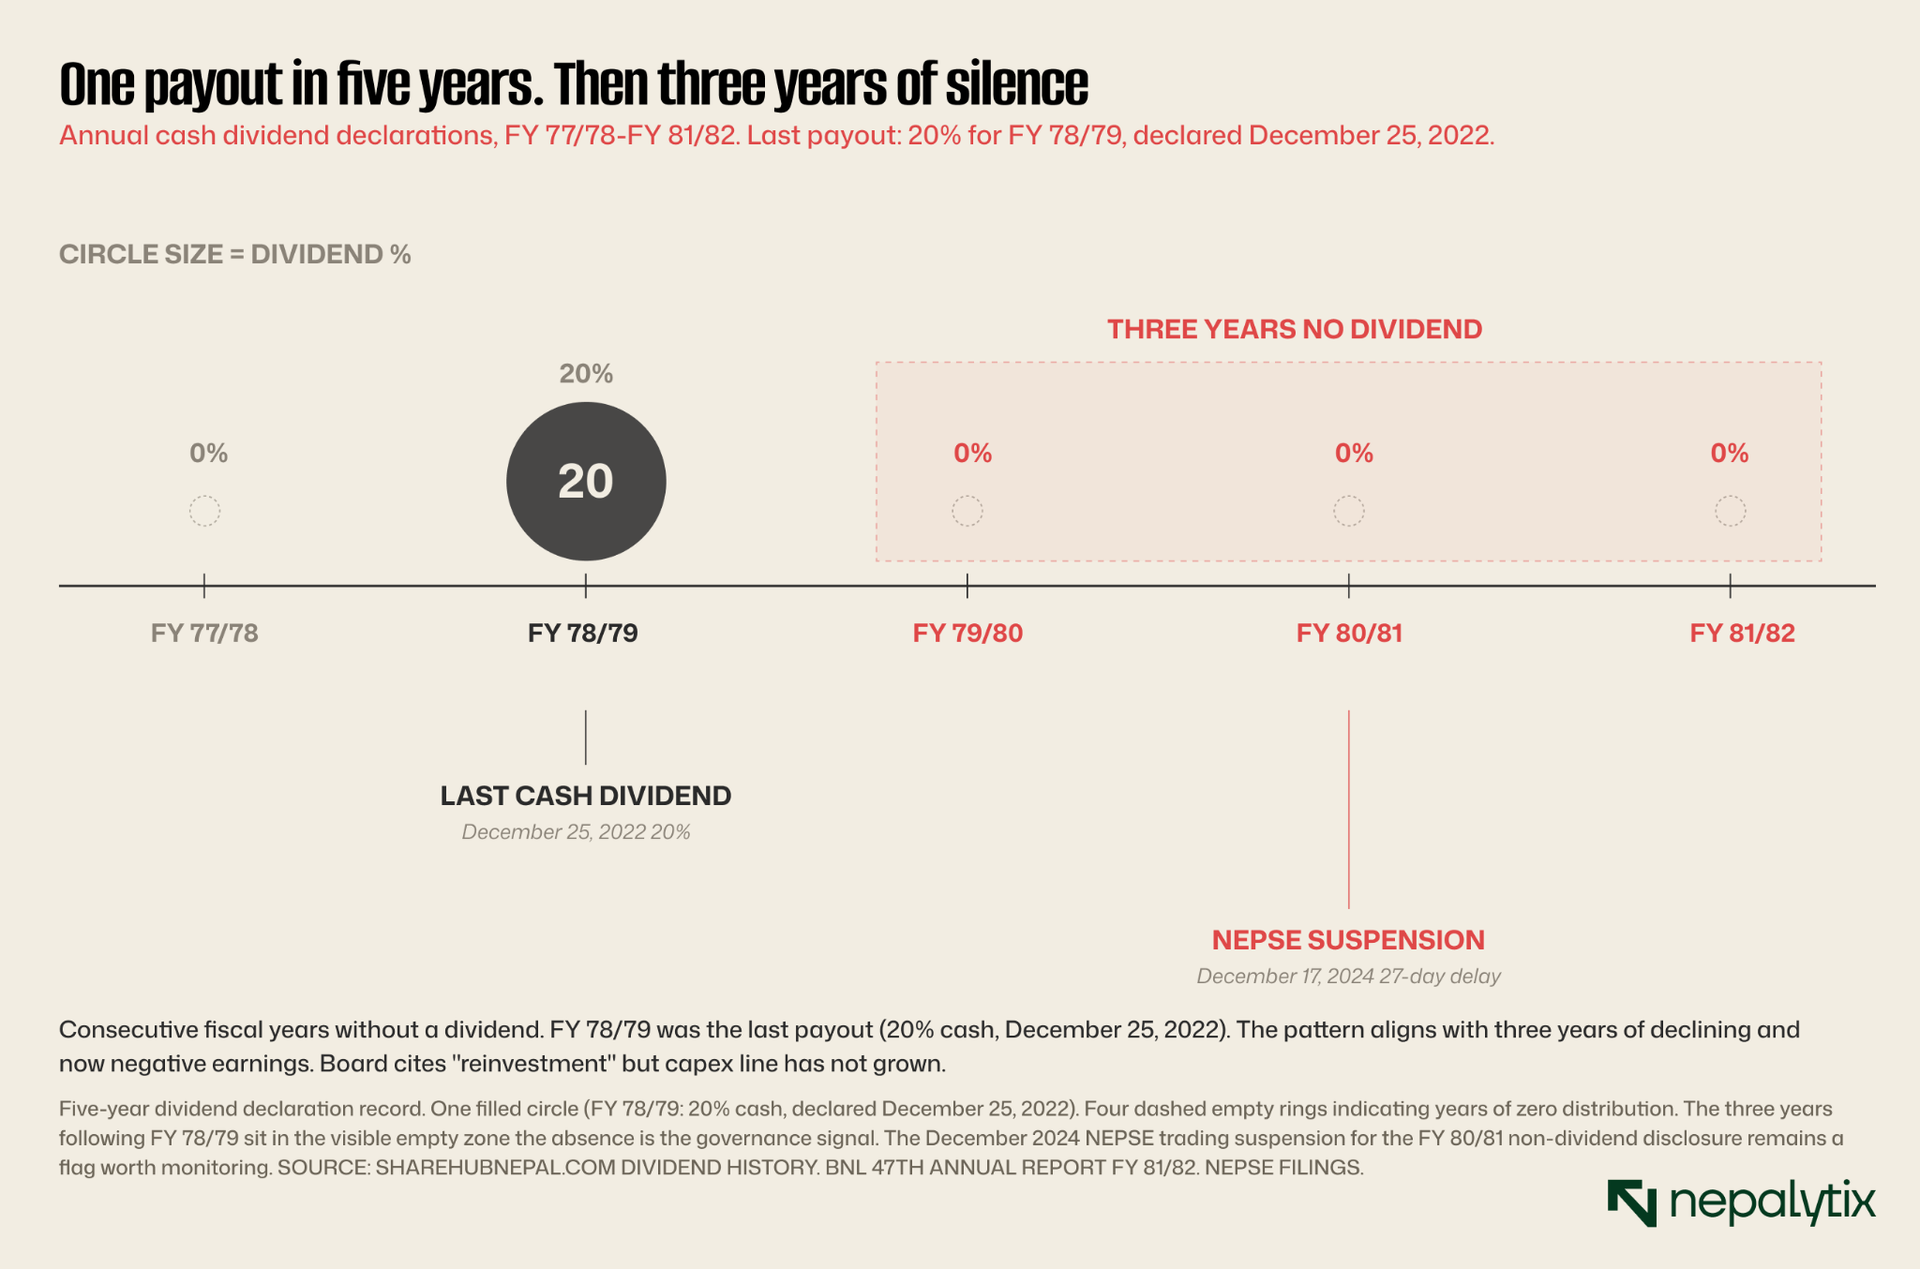
The framing of "reinvestment" is corporate-communications standard but should be tested against the audited capital allocation. The capex line in the P&L did not increase materially in FY 81/82. Total assets actually declined by Rs 1.4 billion (Rs 14.77B to Rs 13.37B), driven primarily by inventory reduction. Cash and cash equivalents fell from Rs 65 million to Rs 45 million. The narrative of capital being deployed for growth investments is not strongly supported by the audited deployment data.
The more probable interpretation: the board is conserving distributable surplus against the tax overhang and the operating contraction. This is reasonable risk management. But it is also a clear signal to minority shareholders that the company's near-term cash priorities are defensive rather than offensive. For a stock trading at 5x book and 97x earnings, that priority structure is not consistent with the implied valuation.
Working capital and balance sheet quality: The cash that isn't flowing
The balance sheet structure has deteriorated alongside the P&L. Inventory grew from Rs 1.59 billion (FY 77/78) to Rs 3.62 billion (FY 80/81), an 128 percent increase. Supplier advances — primarily for sugar and concentrate purchases surged from Rs 825 million to Rs 2.86 billion in FY 79/80 and have remained elevated at Rs 2.39 billion in FY 81/82. Trade payables grew from Rs 688 million to Rs 1.52 billion, providing partial offset. Net effect: working capital absorbed approximately Rs 1.5-2 billion of cumulative operating cash flow over the four-year window.
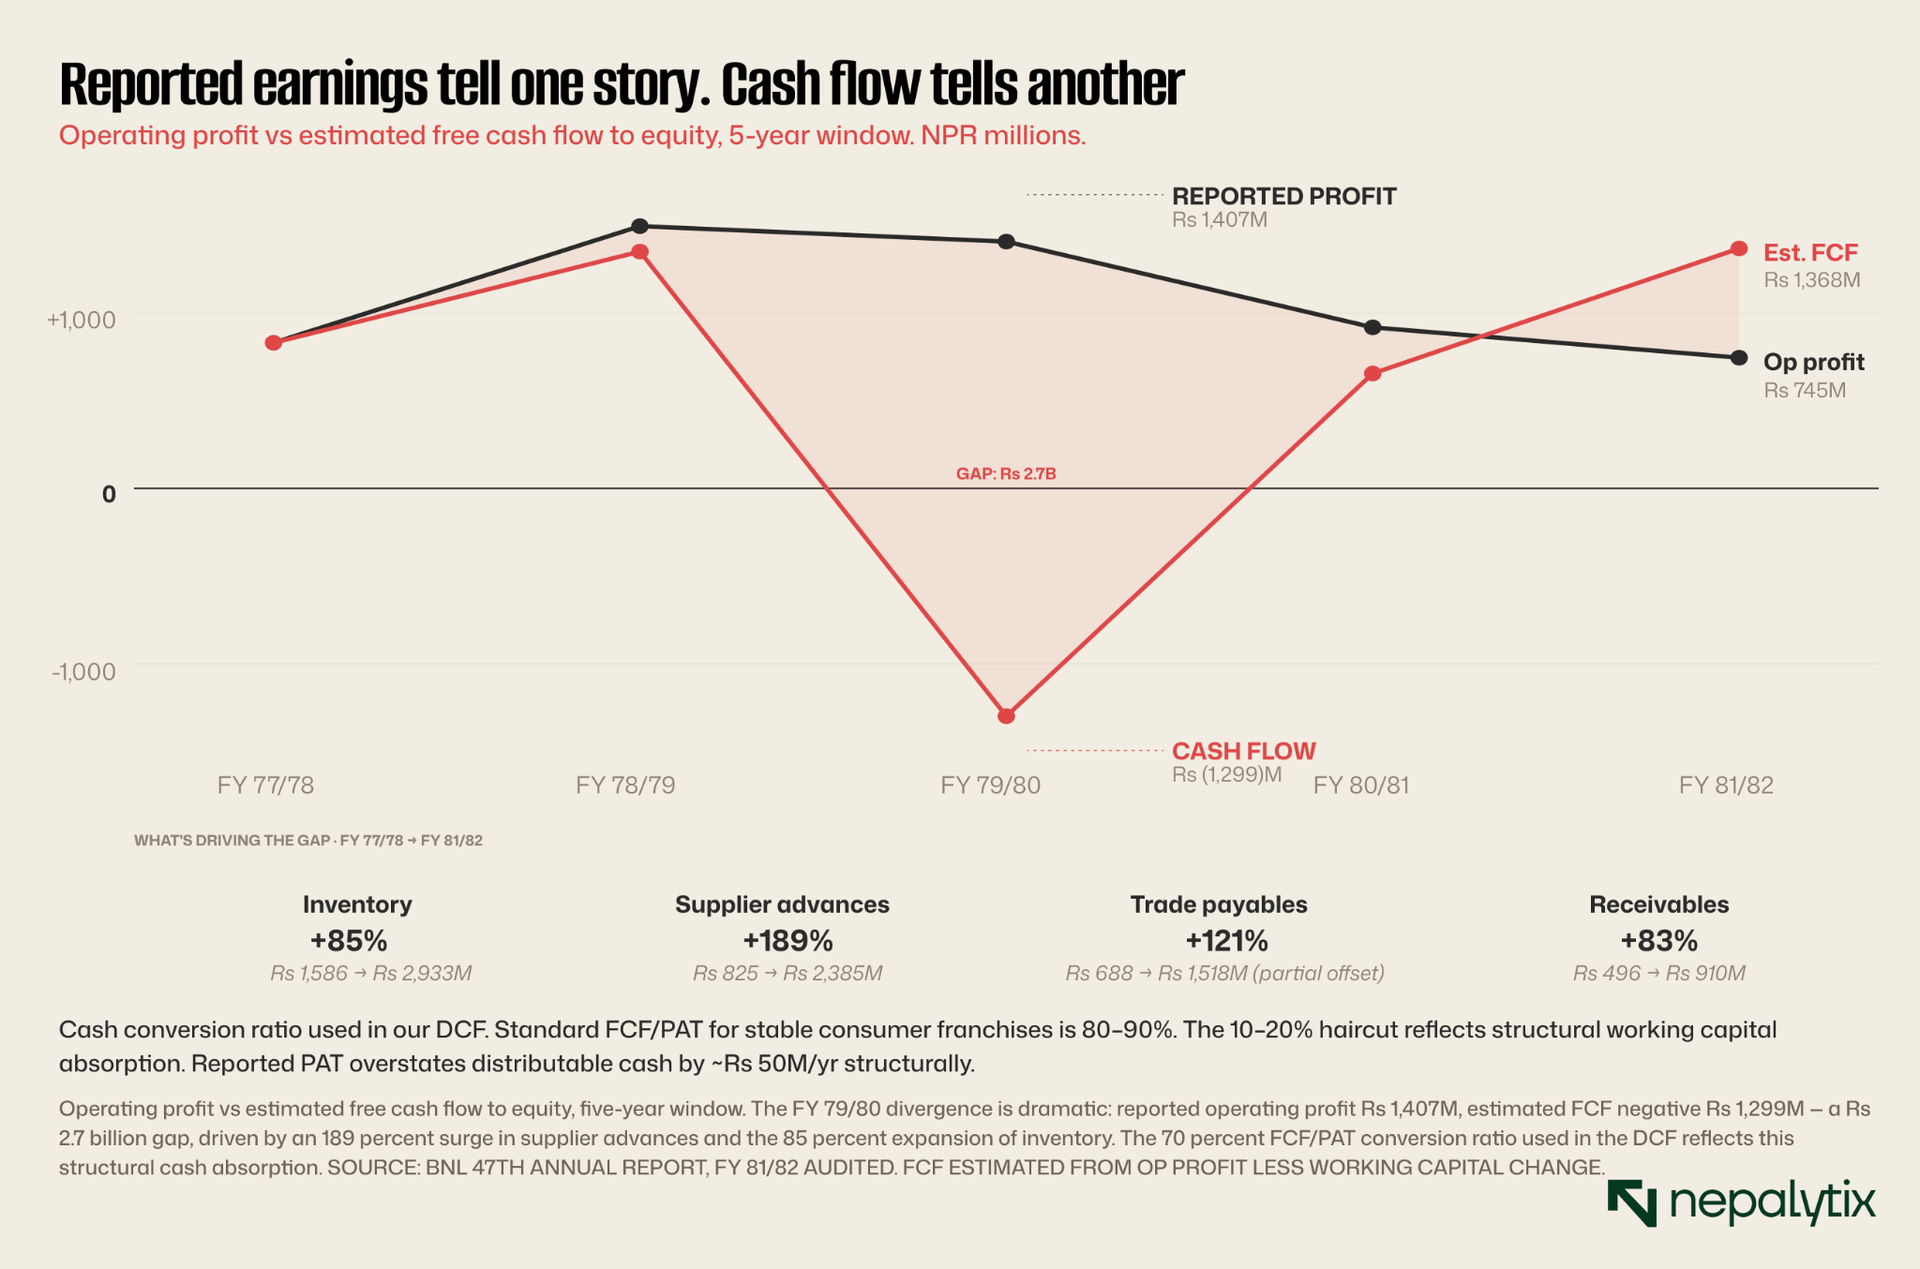
What is driving the elevated supplier advances? The most likely explanation is the dollar-linked nature of input procurement combined with NPR volatility. Sugar imports are denominated in USD-equivalent prices. Concentrate is procured from TCCC's regional operations at TCCC-set pricing. ICRA notes that the Group's forex exposure is "largely unhedged" meaning the working capital absorption is partly a hedging proxy: paying suppliers earlier in NPR to lock in costs against feared further NPR weakness. This is a rational response to currency uncertainty but it represents a real cash drag.
The implication for valuation: free cash flow to equity is materially below reported net income, even before adjusting for the loss-making year. Standard DCF frameworks that apply 80-90 percent FCF/PAT conversion ratios over-state intrinsic value if working capital absorption is structural rather than cyclical. The conversion ratio assumption used in this note's DCF reflects this concern.
How BNL compares to the global Coca-Cola system
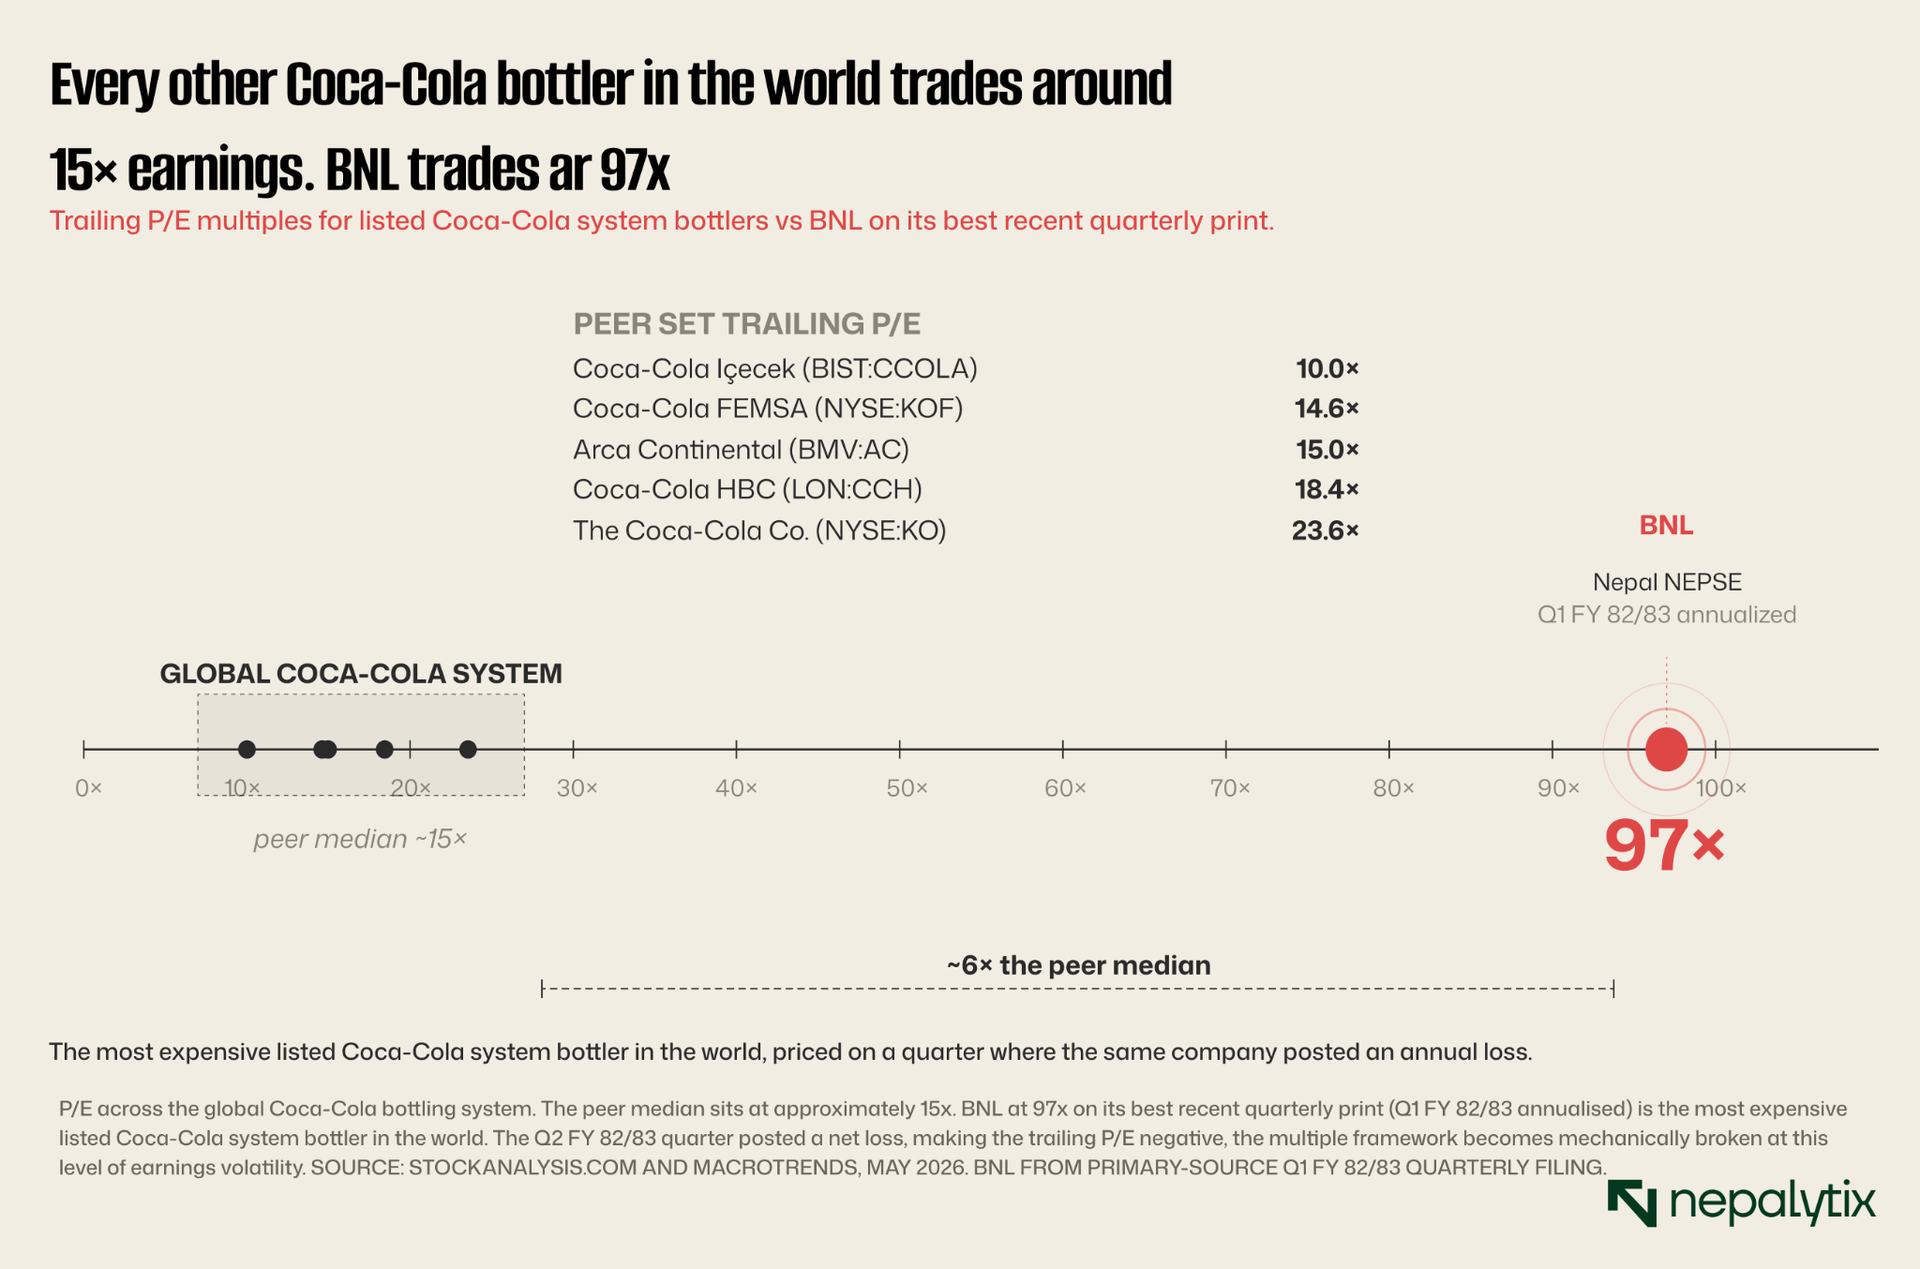
The Coca-Cola Company operates worldwide through approximately 250 independent bottlers, of which roughly a dozen are publicly listed. The major listed bottlers Coca-Cola HBC (LON:CCH, Europe/Africa), Arca Continental (BMV:AC, Mexico/USA/Andean Latin America), Coca-Cola FEMSA (NYSE:KOF, Mexico/Latin America), Coca-Cola Içecek (BIST:CCOLA, Turkey/Central Asia), and Coca-Cola Europacific Partners (LON:CCEP, Europe/Asia-Pacific) provide the most relevant valuation anchors for BNL.
Verified P/E multiples as of May 2026: Coca-Cola HBC trades at 18.4x (StockAnalysis.com TTM). Arca Continental at 15.0x (StockAnalysis.com TTM). Coca-Cola FEMSA at 14.6x (Macrotrends). Coca-Cola Içecek historically trades in the 9-12x range. The Coca-Cola Company itself (NYSE:KO), the parent of the entire system, trades at 23.6x. The peer median is approximately 15x. BNL at 97x on its most recent quarterly print is approximately 6.5x the peer median.
The size differential is real and accounts for some premium. BNL's revenue at Rs 10.79 billion translates to approximately USD 80 million versus Arca's USD 12 billion and FEMSA's USD 14.5 billion. Smaller listed entities can trade at higher multiples than larger peers when they have superior unit economics or growth rates. BNL has neither. Its margin profile (15.1 percent EBITDA, 6.9 percent operating) sits below the peer median; its growth has been negative for two consecutive years. The size premium argument does not hold.
Valuation: discounted cash flow
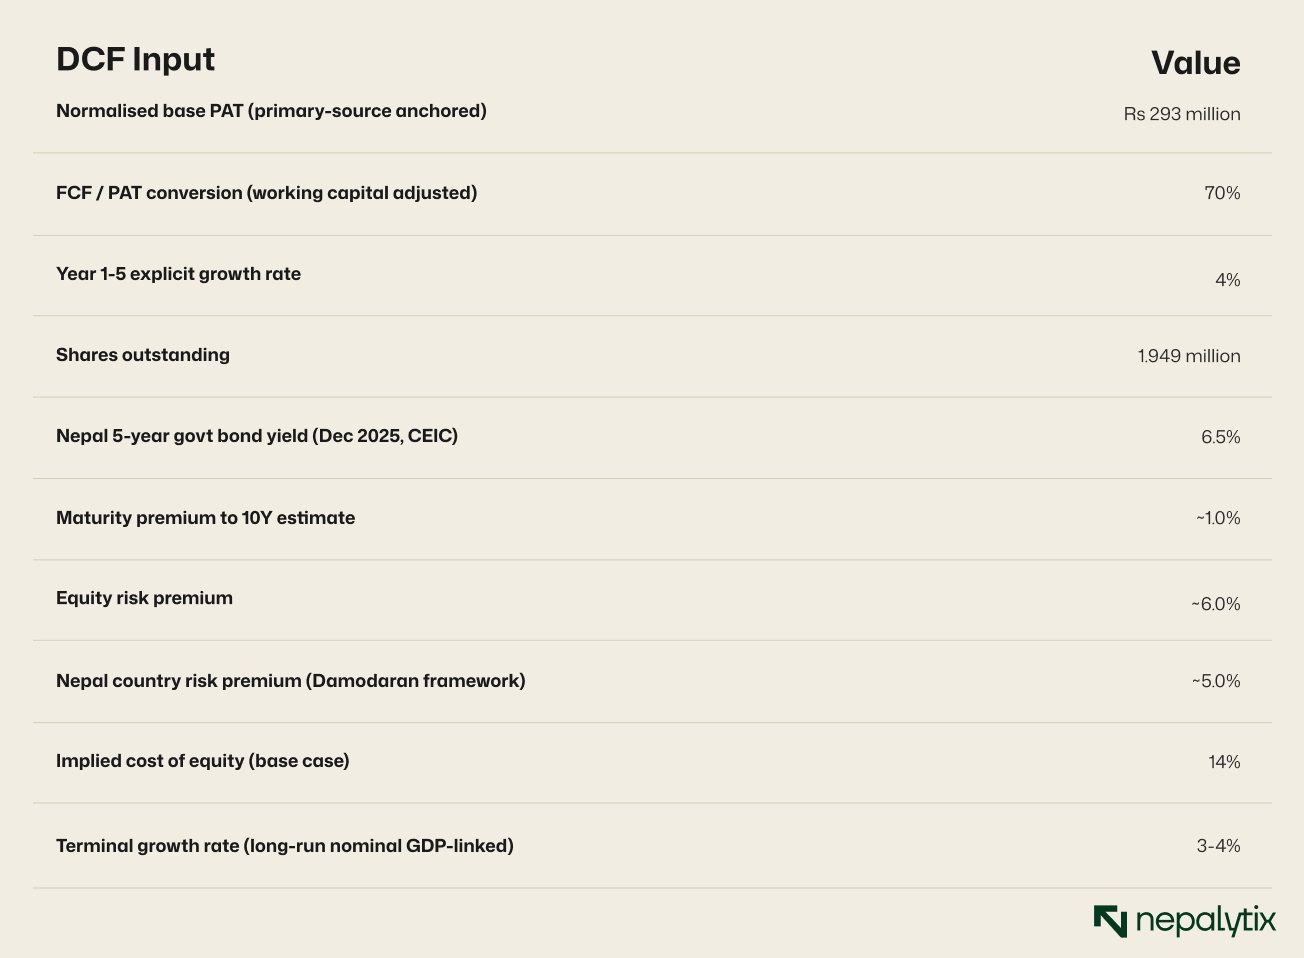
Building intrinsic value from first principles. The peer-multiple framework establishes that BNL is dramatically expensive on relative terms. The DCF establishes whether the absolute level is justifiable on first-principles cash-flow generation. The exercise requires explicit assumptions on three inputs: the base-year cash flow, the cost of equity, and the terminal growth rate.
The base-year cash flow assumption is the most consequential. FY 81/82 audited PAT was minus Rs 400 million; that is not a viable DCF base. The primary-source quarterly filings for FY 82/83 pulled directly from bnl.com.np show a volatile but improving trajectory: Q1 net profit Rs 322 million (EPS Rs 152, MD letter cites "increased productivity and cost efficiency"); Q2 net loss Rs 290 million (MD cites Bada Dashain timing shift to Q1, Gen Z protests, slow consumer spending); Q3 net profit Rs 189 million recovery (MD letter cites "cost-saving measures and innovating with new product offerings"). The 9-month YTD net profit is Rs 220 million, which annualises to Rs 293 million for full FY 82/83 assuming Q4 tracks the YTD run-rate. This Rs 293 million serves as the DCF base.
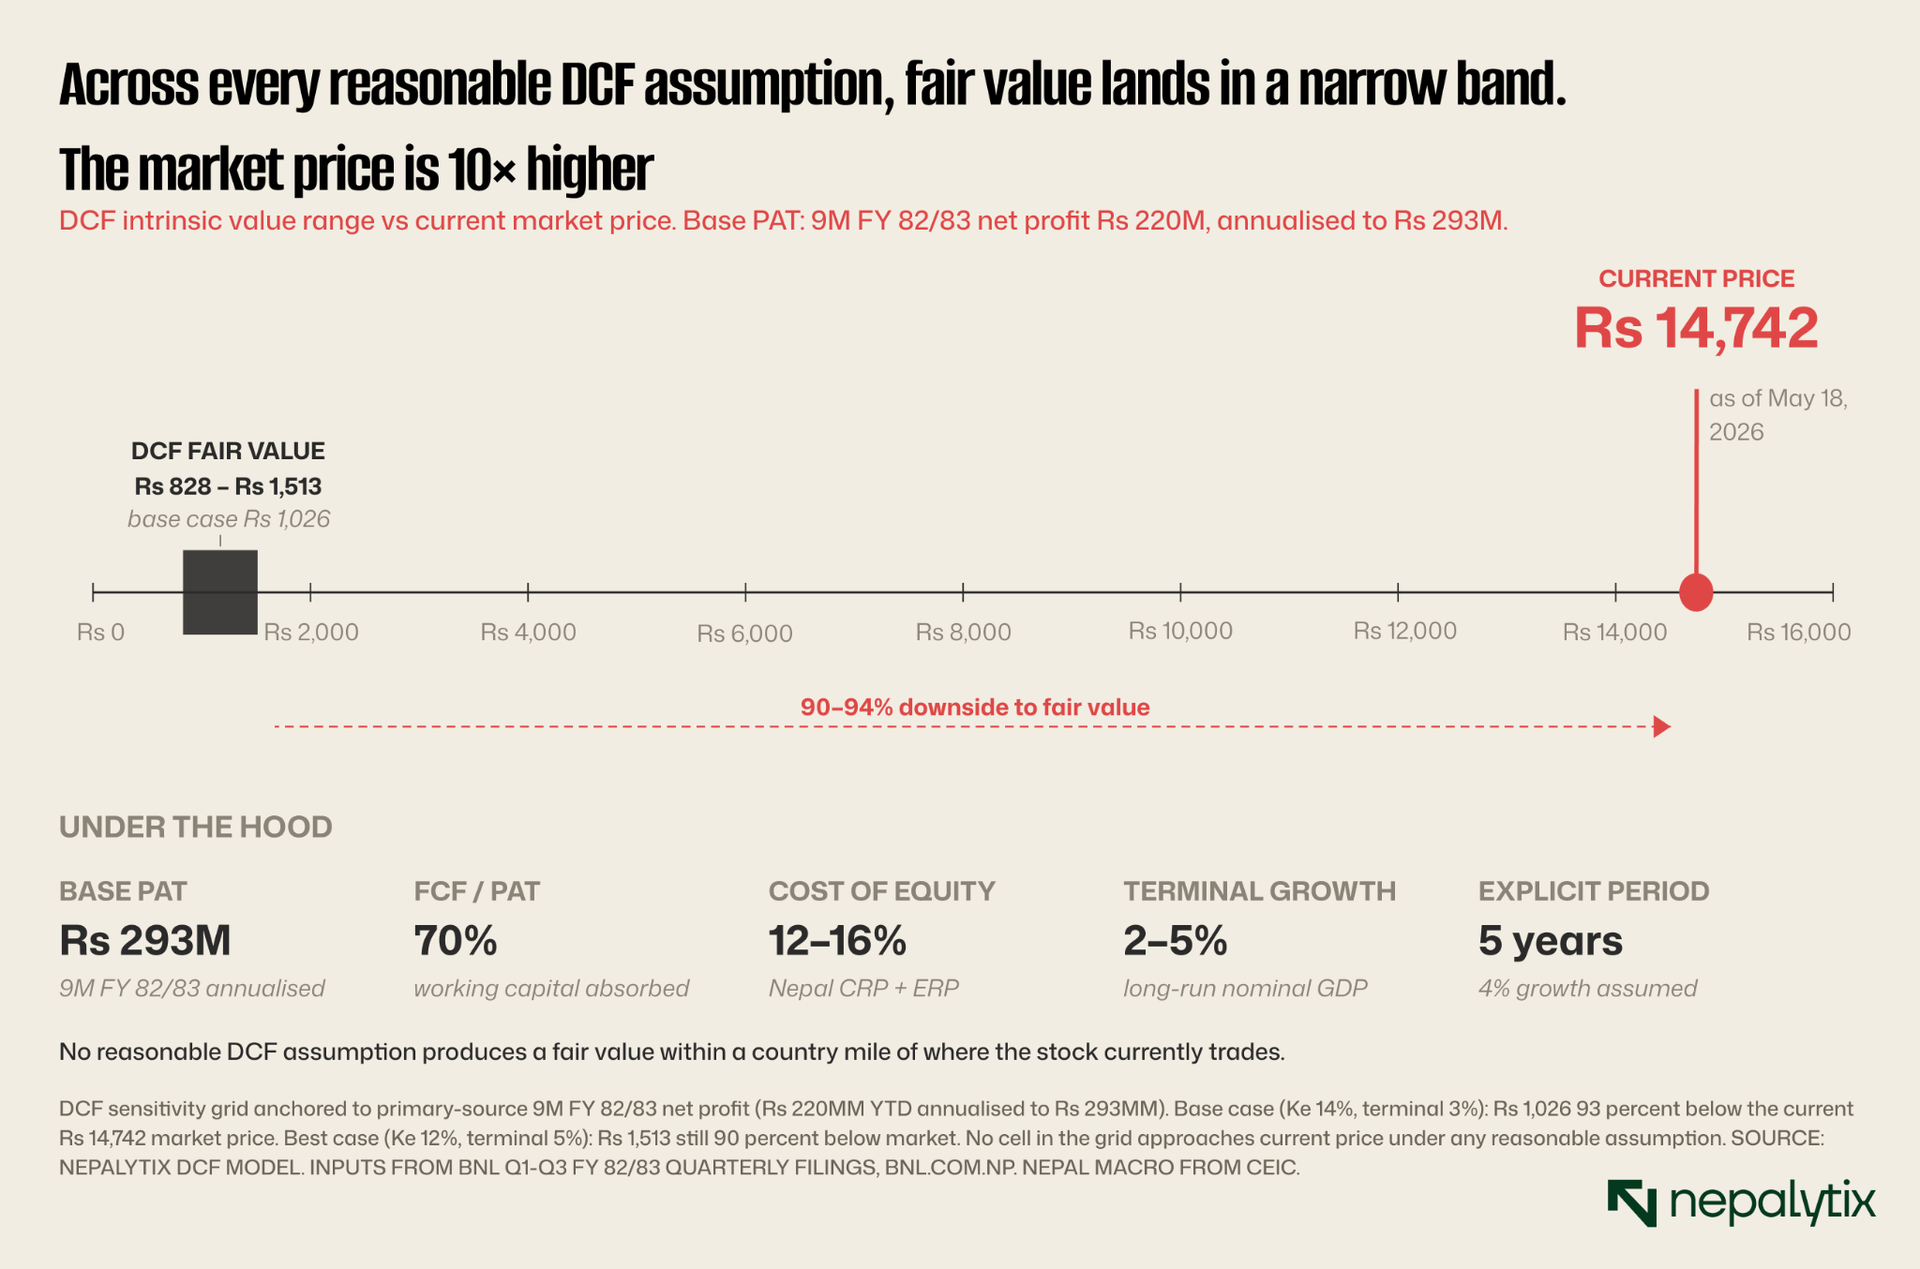
The DCF output is unambiguous: at no point in the sensitivity grid does the intrinsic value approach the current market price. The closest cell (cost of equity 12 percent, terminal growth 5 percent both aggressive assumptions for a frontier-market consumer franchise with declining earnings) produces Rs 1,513 per share. The base case (Ke 14%, terminal 3%) is Rs 1,026. The worst-case cell (Ke 16%, terminal 2%) sits at Rs 828. Every cell of the grid implies 90 percent or greater downside from current market price. The implication: either the model's base-year cash flow assumption is materially too low, or the market price is materially too high.
The case that the base assumption is too low requires expecting BNL to return to its FY 79/80 peak earnings of Rs 978 million PAT, sustainably. Applying the same DCF framework to that base PAT (a 3.3x scale-up from Rs 293MM) produces an intrinsic value of approximately Rs 3,400 per share in the base case still 77 percent below current market. To justify the current price on a DCF basis, the model would need to assume sustained PAT of approximately Rs 4.2 billion annually over four times the FY 79/80 peak. There is no precedent in BNL's history that supports this assumption, and the operating trajectory of the past two years runs in the opposite direction.
Scenarios and implied price ranges
The scenario analysis below anchors to the current market price of Rs 14,742 and tests three paths over the next 12-18 months. Each scenario combines an explicit FY 82/83 EPS estimate with an implied fair multiple range.
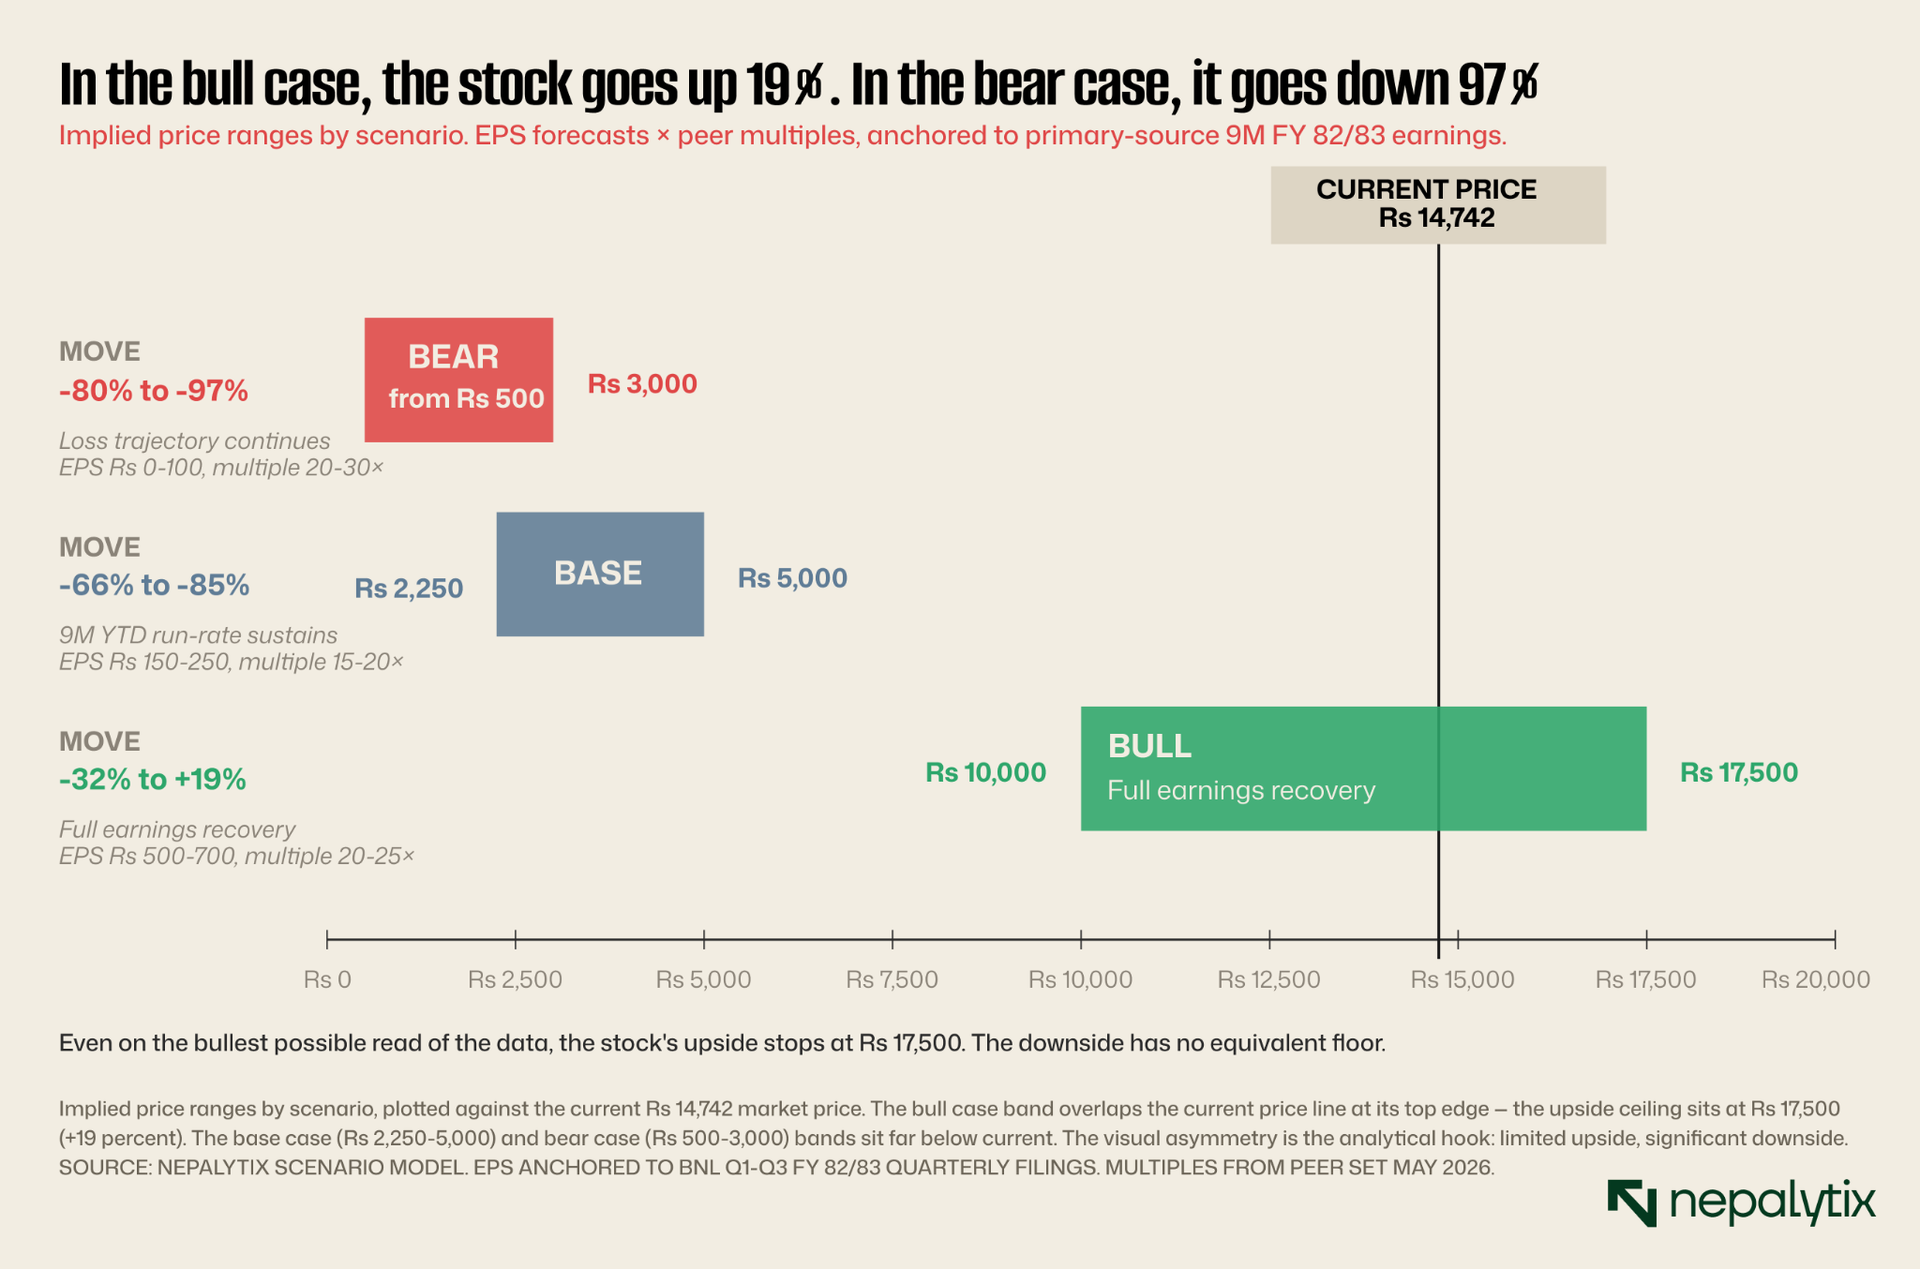
The base case assumes BNL achieves a trajectory consistent with the YTD 9-month run-rate (Rs 220 million YTD, annualised Rs 293 million) and re-rates toward the peer median of 15-20x. At Rs 150-250 annualised EPS (Rs 293 million ÷ 1.949 million shares = Rs 150 per share annualised; with modest upside to Rs 250 on full-year results), an implied price range of Rs 2,250-Rs 5,000 emerges, representing 66 to 85 percent downside from current.
The bear case assumes the FY 81/82 loss pattern persists, the tax overhang produces additional crystallisations, and earnings fail to recover meaningfully. Implied price range Rs 500-Rs 3,000, representing 80 to 97 percent downside.
The bull case assumes a full recovery to FY 79/80 peak earnings (Rs 500-700 EPS), with sustained margin expansion and tax-overhang resolution, justifying a premium multiple of 20-25x. Implied price range Rs 10,000-Rs 17,500. This is the only scenario that includes flat-to-modest upside from current levels — and it requires multiple consecutive favourable outcomes.
Catalysts that will resolve or extend the disconnect
The 12-18 month catalyst calendar centres on three potential resolution events. First, the Q4 FY 82/83 quarterly disclosure (expected July-August 2026) and the FY 82/83 full-year audited results. The three quarters released so far have established a volatile but recovering trajectory: Q1 profit Rs 322MM, Q2 loss Rs 290MM, Q3 profit Rs 189MM. A Q4 net profit above Rs 100MM would confirm the YTD run-rate; a Q4 loss would meaningfully degrade the FY 82/83 figure and shift the DCF base lower.
Second, the FY 82/83 audited annual report, expected publication October-December 2026. This will be the first full-year audited print after the FY 81/82 loss, and will resolve whether the tax amnesty was a one-time settlement or whether additional settlements are being pursued at the BNTL or BNL parent level. The dividend declaration (or non-declaration) with the FY 82/83 results will be the clearest signal of the board's capital allocation posture.
Third, any disclosure related to the Rs 15.6 billion contested tax liability. If additional crystallisations occur either through further amnesty settlements, adverse court decisions, or balance-sheet provisioning the impact on the equity value will be direct and material. Conversely, a favourable resolution of any portion of the contested liability would remove a major overhang.
This note will be updated as these catalysts produce data. The coverage view stated at the top of this note that the current valuation has detached from the operating fundamentals and that risk-reward is sharply asymmetric to the downside is contingent on the data continuing to support that thesis. A meaningful change in any of the three catalyst categories above will trigger a view revision.