What Nepal Rastra Bank’s Real Estate Data Actually Reveals: A Market That Recovered, But Not as You Think
Nepal’s property market has hit record transaction levels- but revenue remains far below its peak.

What Nepal Rastra Bank (NRB) Real Estate data actually shows
Transactions just printed a record. Revenue is still half what it was at the peak. The gap tells you more about the last five years than any number on its own.
What Nepal Rastra Bank (NRB) Real Estate data actually shows
Transactions just printed a record. Revenue is still half what it was at the peak. The gap tells you more about the last five years than any number on its own.
Every quarter, Nepal's 135 Land Revenue Offices quietly process hundreds of thousands of property deeds. The data sits in DOLMA's servers. It rarely gets read as a time series. Nepal Rastra Bank just did the work and the picture that emerges is not the one most market commentary has been telling.
Three things happened in FY 2081/82 Q4 that need to be held together to make sense of each:
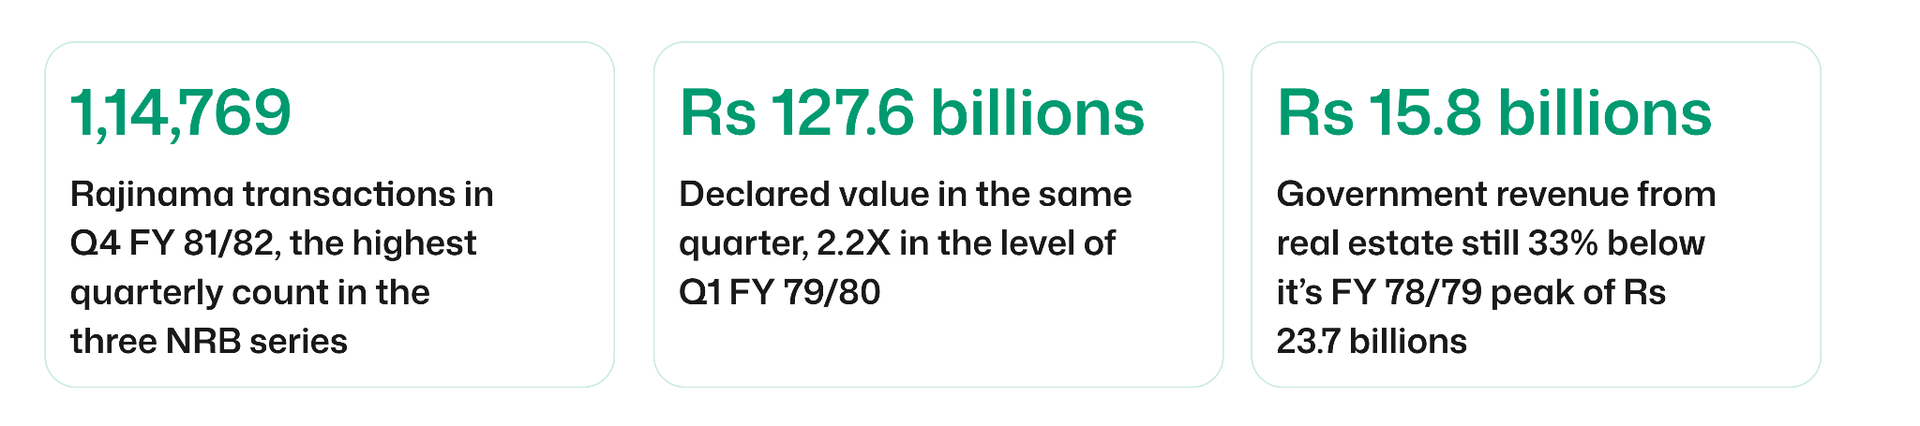
On a surface, a boom. Read more carefully and it's the market that has found a floor, regained its record and still hasn’t delivered the fiscal windfall the last boom did. That’s not a contradiction, it’s the signal. Below the structural read.
1. The Cycle
A market back to its peak
Three quarters of data tells the story cleanly. The FY 79/80 trough, the FY 80/81 stabilisation and the FY 81/82 push back to new highs. The seasonal pattern, monsoon slowdown in Q1, peak in Q4, is so consistent across the series that any serious analysis of Nepal’s property market should be done year on year, not quarter-on quarter.
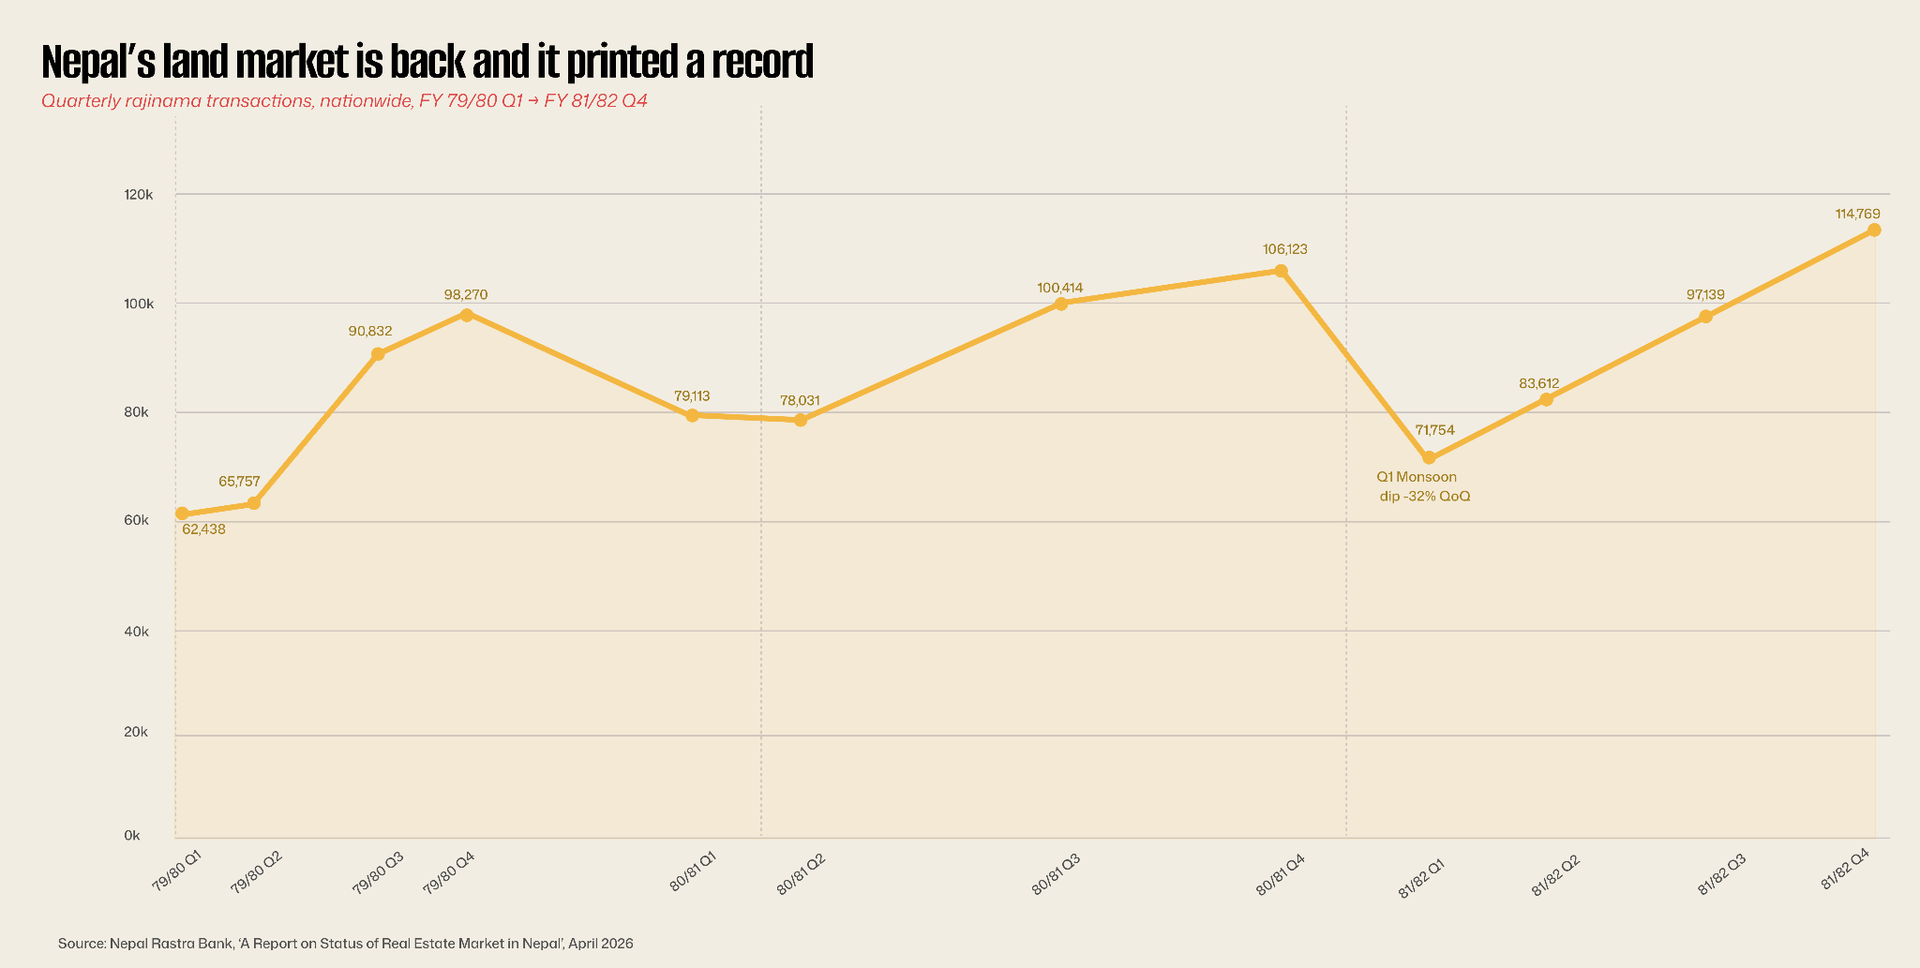
The return to form. After the FY 80/81 mid-year wobble, rajinama volumes have climbed five quarters in a row, discounting the predictable Q1 monsoon dip.
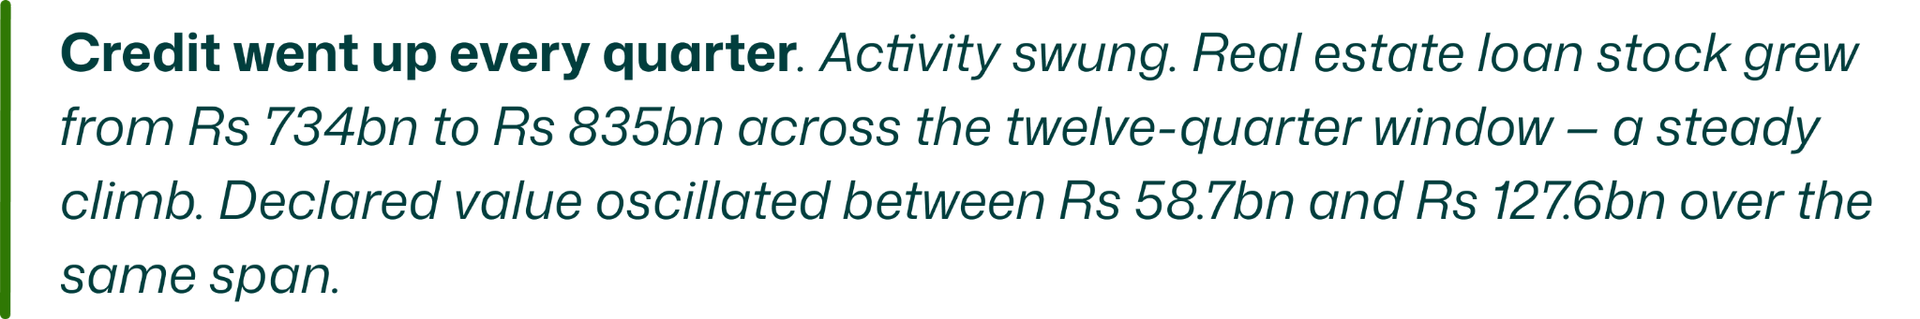
The value series confirms the read. Declared value at Land Revenue Offices rose from Rs 58.7bn in Q1 FY 79/80 to Rs 127.6bn in Q4 FY 81/82, a 117% rise over twelve quarters. Not all of that is real-estate appreciation; some of it is recovery from a genuinely depressed base. But the trajectory is unambiguous.
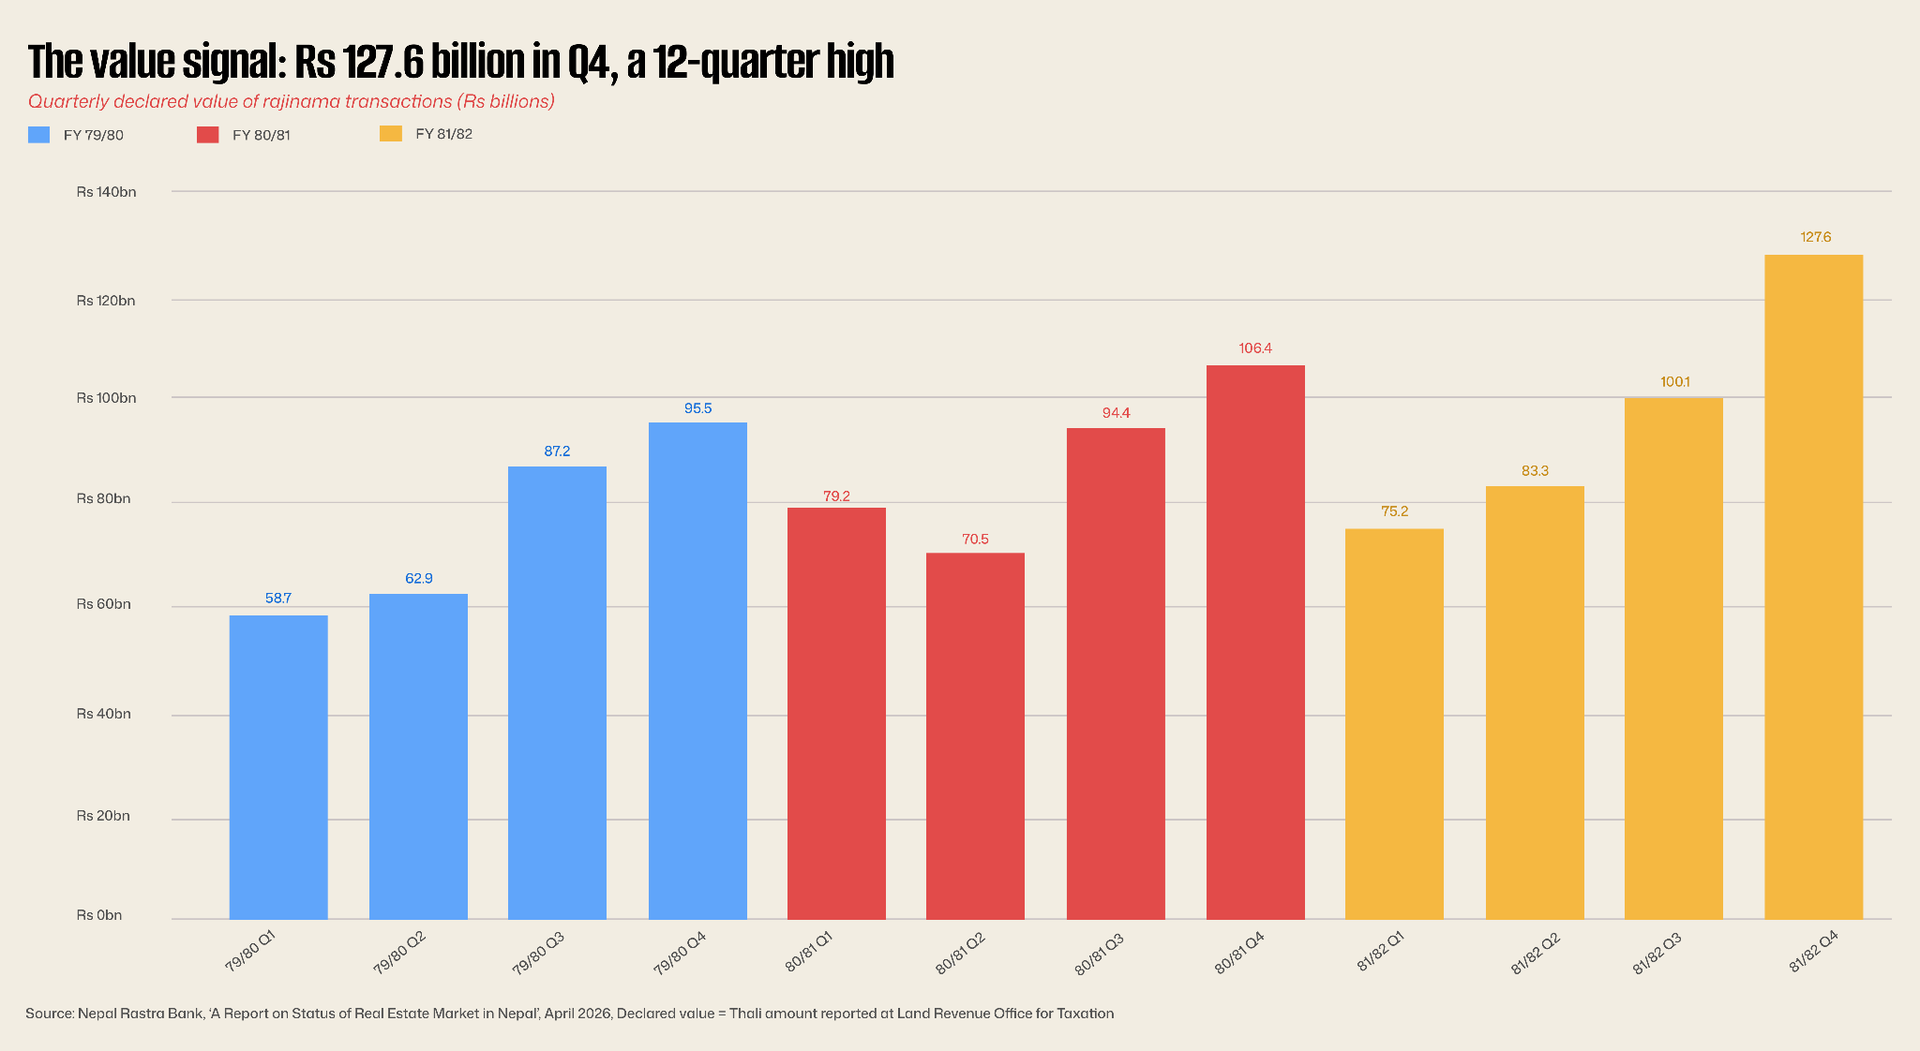

The more interesting question is what Nepal is paying for. The area transacted grew more slowly than declared value. The gap is the price signal, land isn't just changing hands faster, it's changing hands at a higher implied price per square metre.
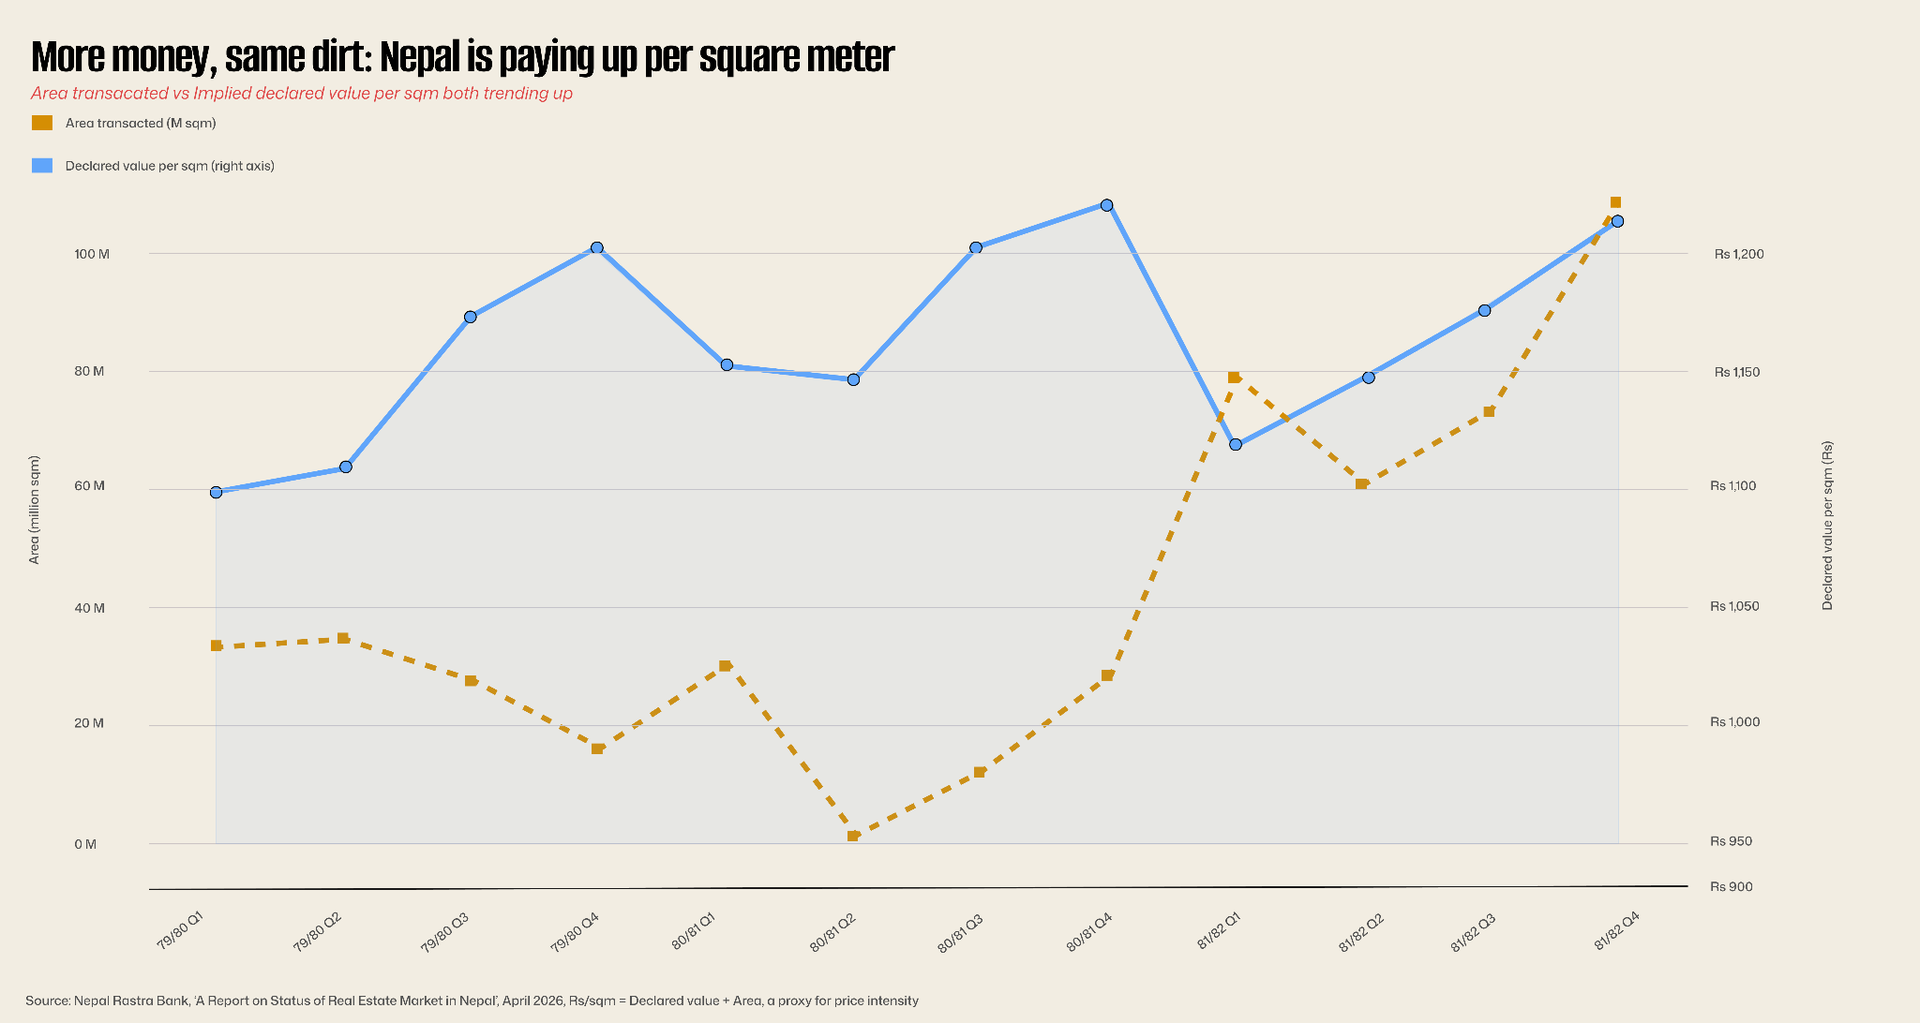
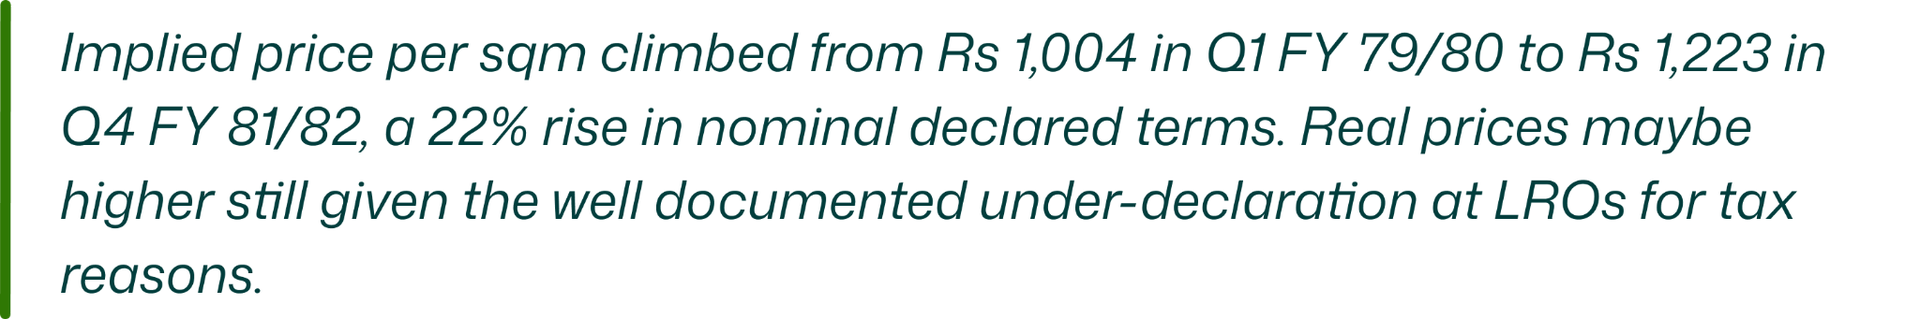
Declared value is not market value. In a country where the thaili is set for tax, not truth, a rising declared-value trend is arguably the most conservative read on where prices are actually going.
2. The Map
Two different countries on one data set
The provincial cut is where this report earns its pay. Aggregate national numbers hide the fact that Nepal's real estate market isn't one market, it's at least three, stacked awkwardly on top of each other.
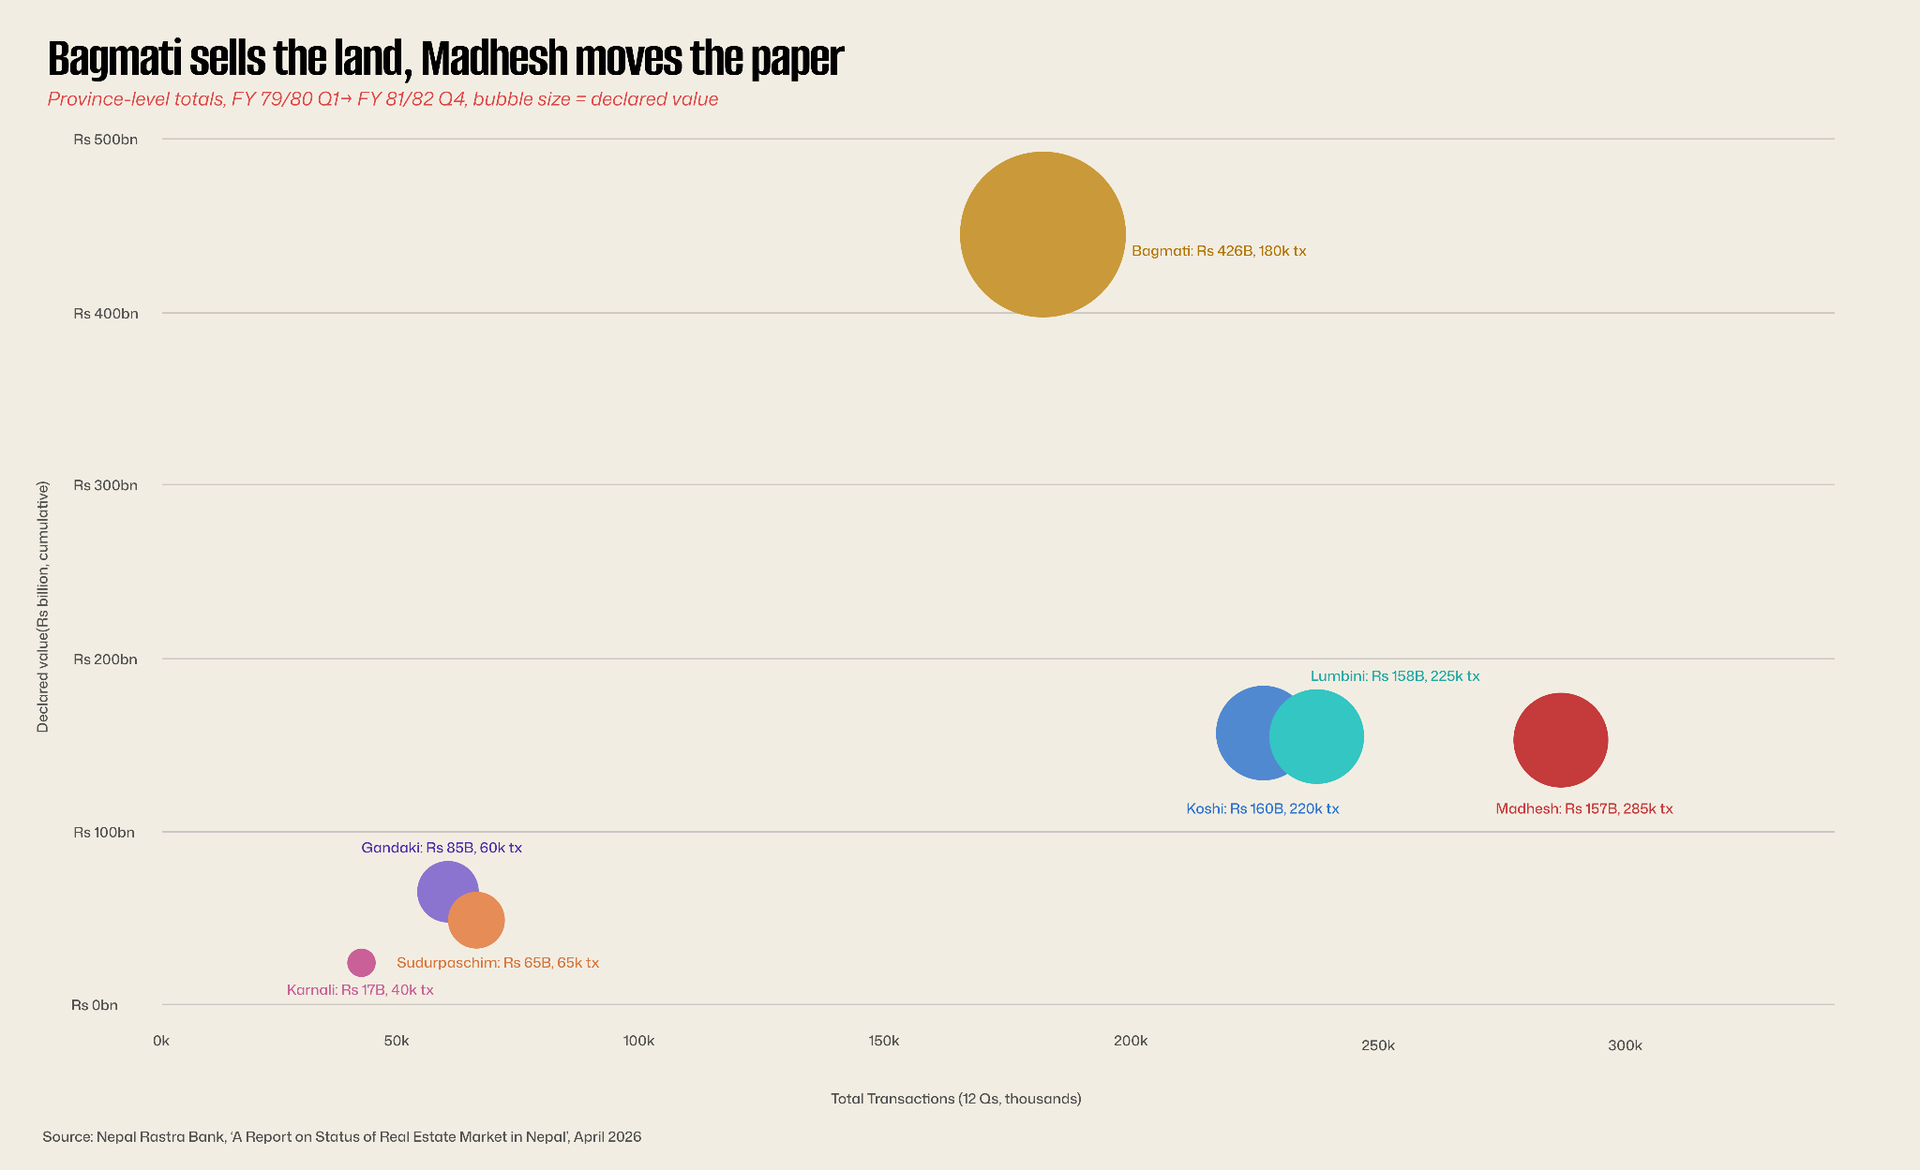
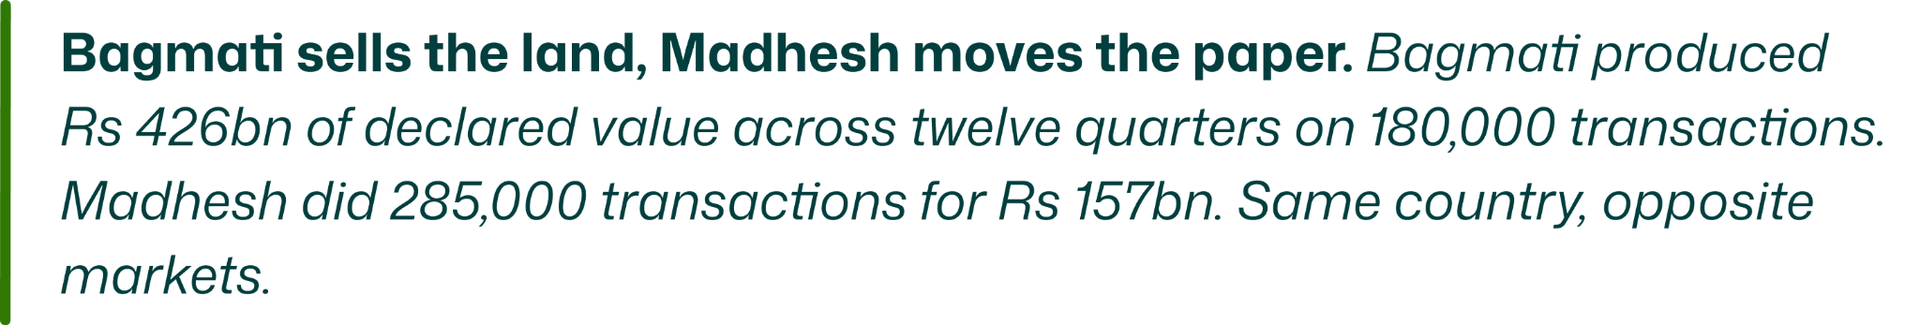
Bagmati is Nepal's urban pricing engine. Its share of the declared-value pie hovering around 38% in most quarters, peaking at Rs 51.4bn in Q4 FY 81/82 reflects land that trades in lakhs per aana, not thousands per ropani. The province is 18% of transaction count but 38% of declared value. That ratio is the story.
Madhesh is the mirror image. More deeds than any province. Lower value per transaction. The land category data explains why Madhesh is the only province where the most common transaction band is greater than 20 aana. In every other province, mid-sized plots dominate. Madhesh is an agrarian market trading at agrarian prices. It is also, by some distance, Nepal's most active market by volume.
Koshi and Lumbini sit in between substantial transaction counts, substantial area, moderate value. This is where formalisation is happening at scale, and where provincial capital growth (Biratnagar, Butwal) is starting to show up in value terms.
The three provinces that matter least by value, Karnali, Sudurpaschim, Gandaki collectively produced less declared value in twelve quarters than Bagmati did in two. Whatever inclusive real estate growth means in Nepali policy discussions, this chart is the counter-evidence.
3. The Plot
The 2.5-10 aana market
If Nepal's land market has a product category with a moat, it's the mid-sized urban plot. Nationally, 2.5–10 aana transactions have held a 42–46% share of all rajinama deeds for three straight years. That stability is not accidental. This is the plot size that works for a middle-class household, for a small commercial build, for a developer subdividing farmland at the urban edge.
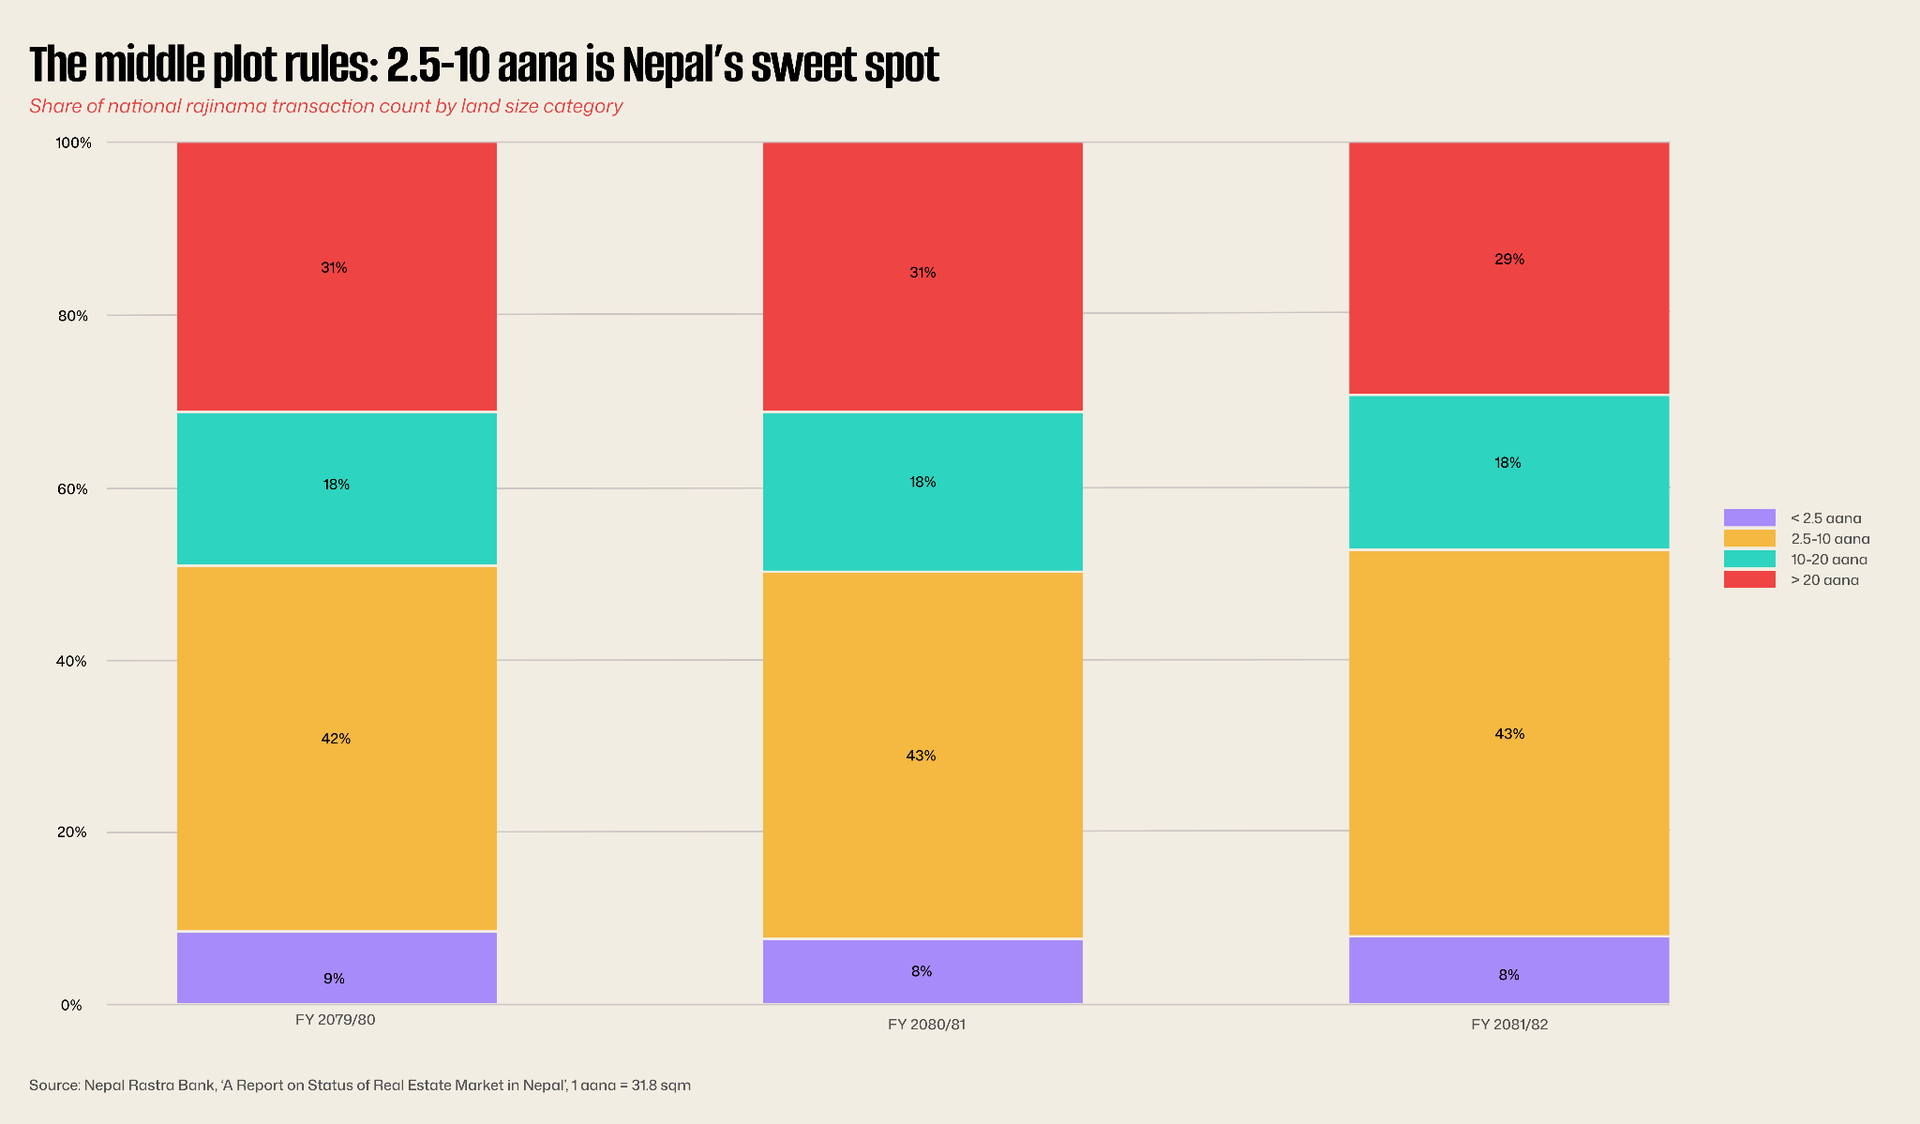

The metropolitan data sharpens the point. In metros and sub-metros, 5–10 aana is the dominant band driven by plot adjustments, subdivision sales, and the realities of where housing finance can actually clear. Under 2.5 aana transactions are mostly technical (boundary adjustments, family transfers). Over 20 aana in metro areas is increasingly rare, the economics of a single large urban parcel no longer clear without substantial capital behind the buyer.
What this means for anyone pricing exposure: the middle of the curve is where Nepal's housing finance demand lives. It's where mortgage-ready buyers meet developer-ready stock. It's also, by implication, where a credit tightening would bite first.
4. The Disconnect
When credit stops telling you about the market
For most of the last decade, Nepali analysts treated real estate loan growth as a leading indicator of market activity. The NRB data undermines that habit cleanly.
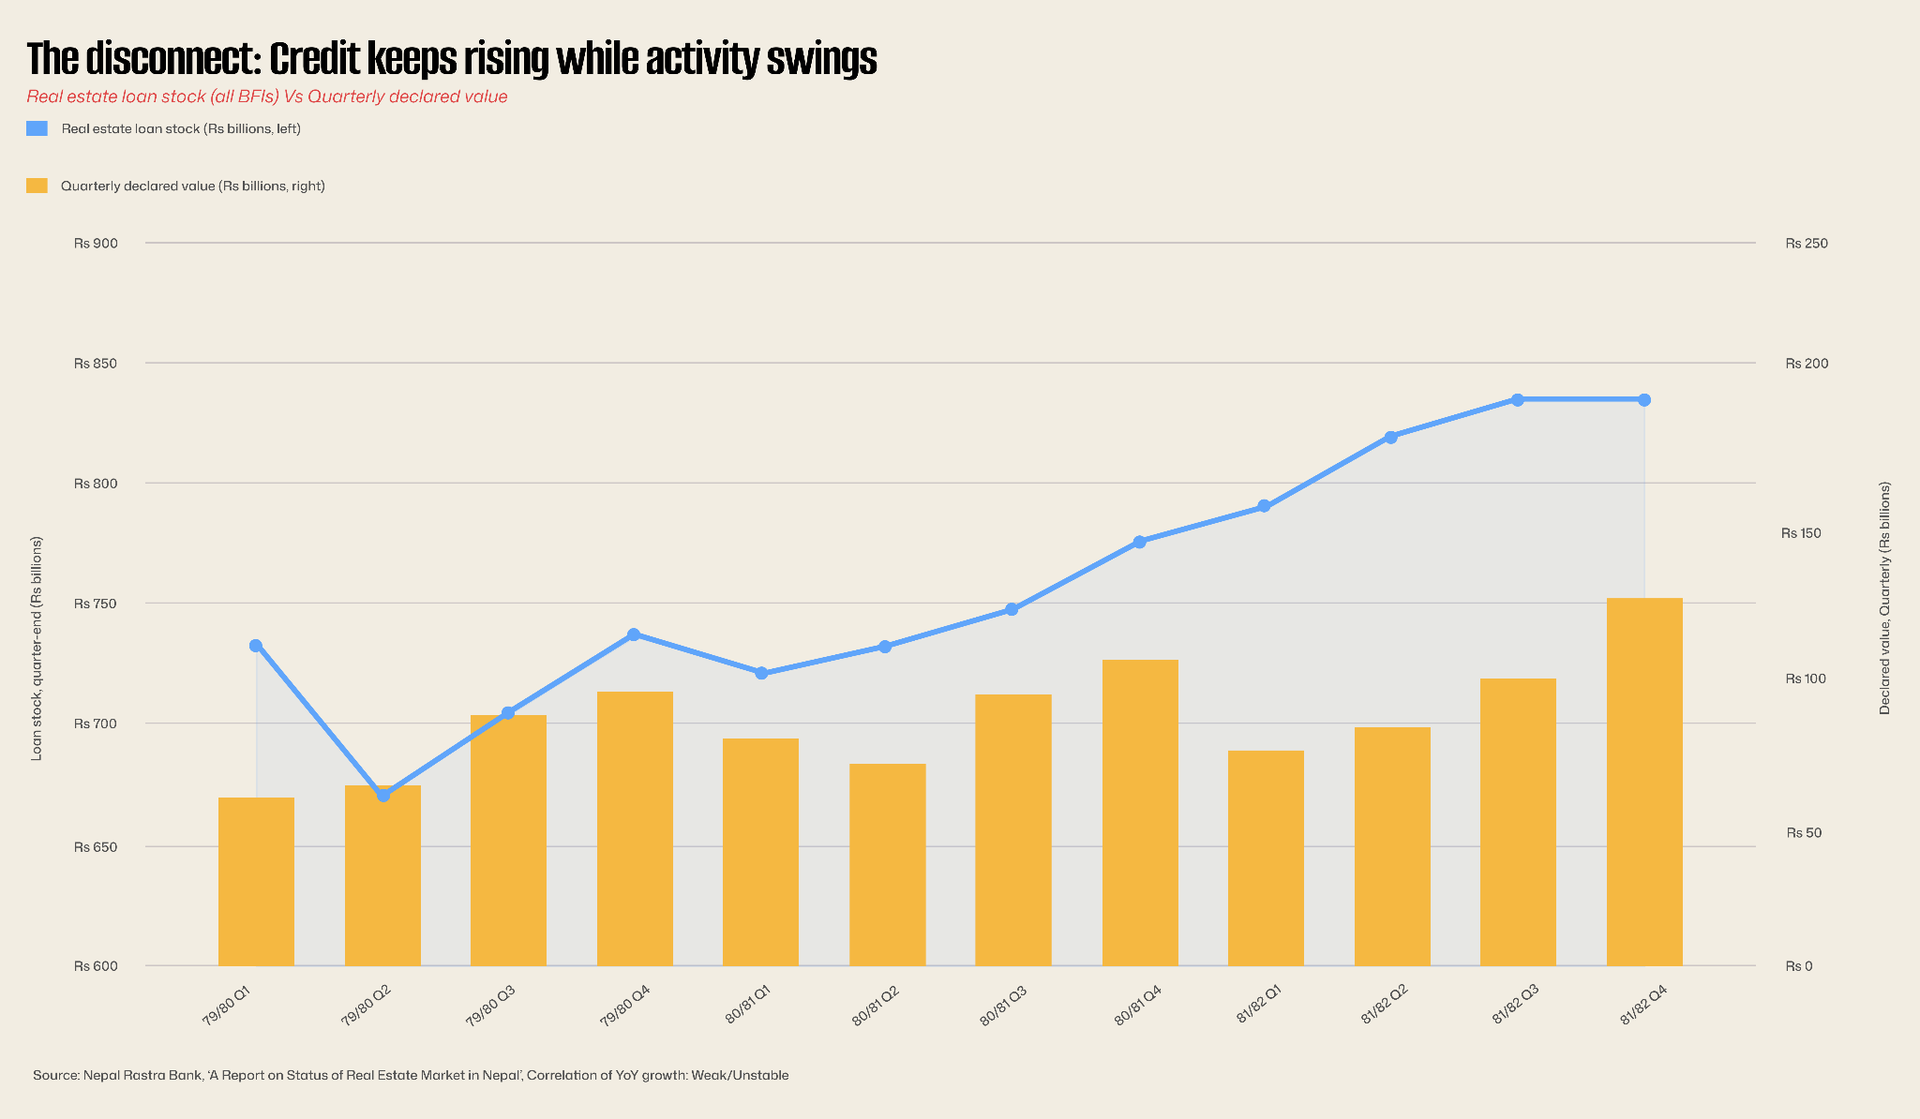
NRB's own language is revealing. Comparing year-on-year loan growth to year-on-year declared value, the report notes: "no definite relationship between the two." That is a significant admission. It means that when banks expand real-estate loan books, the money is not reliably ending up in new transactions. It is refinancing, restructuring, sitting on balance sheets, or funding projects that will hit the market in future quarters.
For the financial stability community, the implication is sharper than the report lets on. Between FY 77/78 Q1 and FY 81/82 Q4, real estate loan stock grew 72%. Residential home loan stock grew 62%. If that credit is not showing up in transaction activity, one of two things is true: either loan-to-value ratios are drifting up on a smaller number of larger deals, or credit is flowing to developers whose projects haven't yet cleared the market. Both possibilities warrant closer regulatory attention than this dataset alone can provide.

5. The Fiscal Signal
The revenue that didn’t come back
If you want to know how the state feels about real estate, look at what it collects from it.
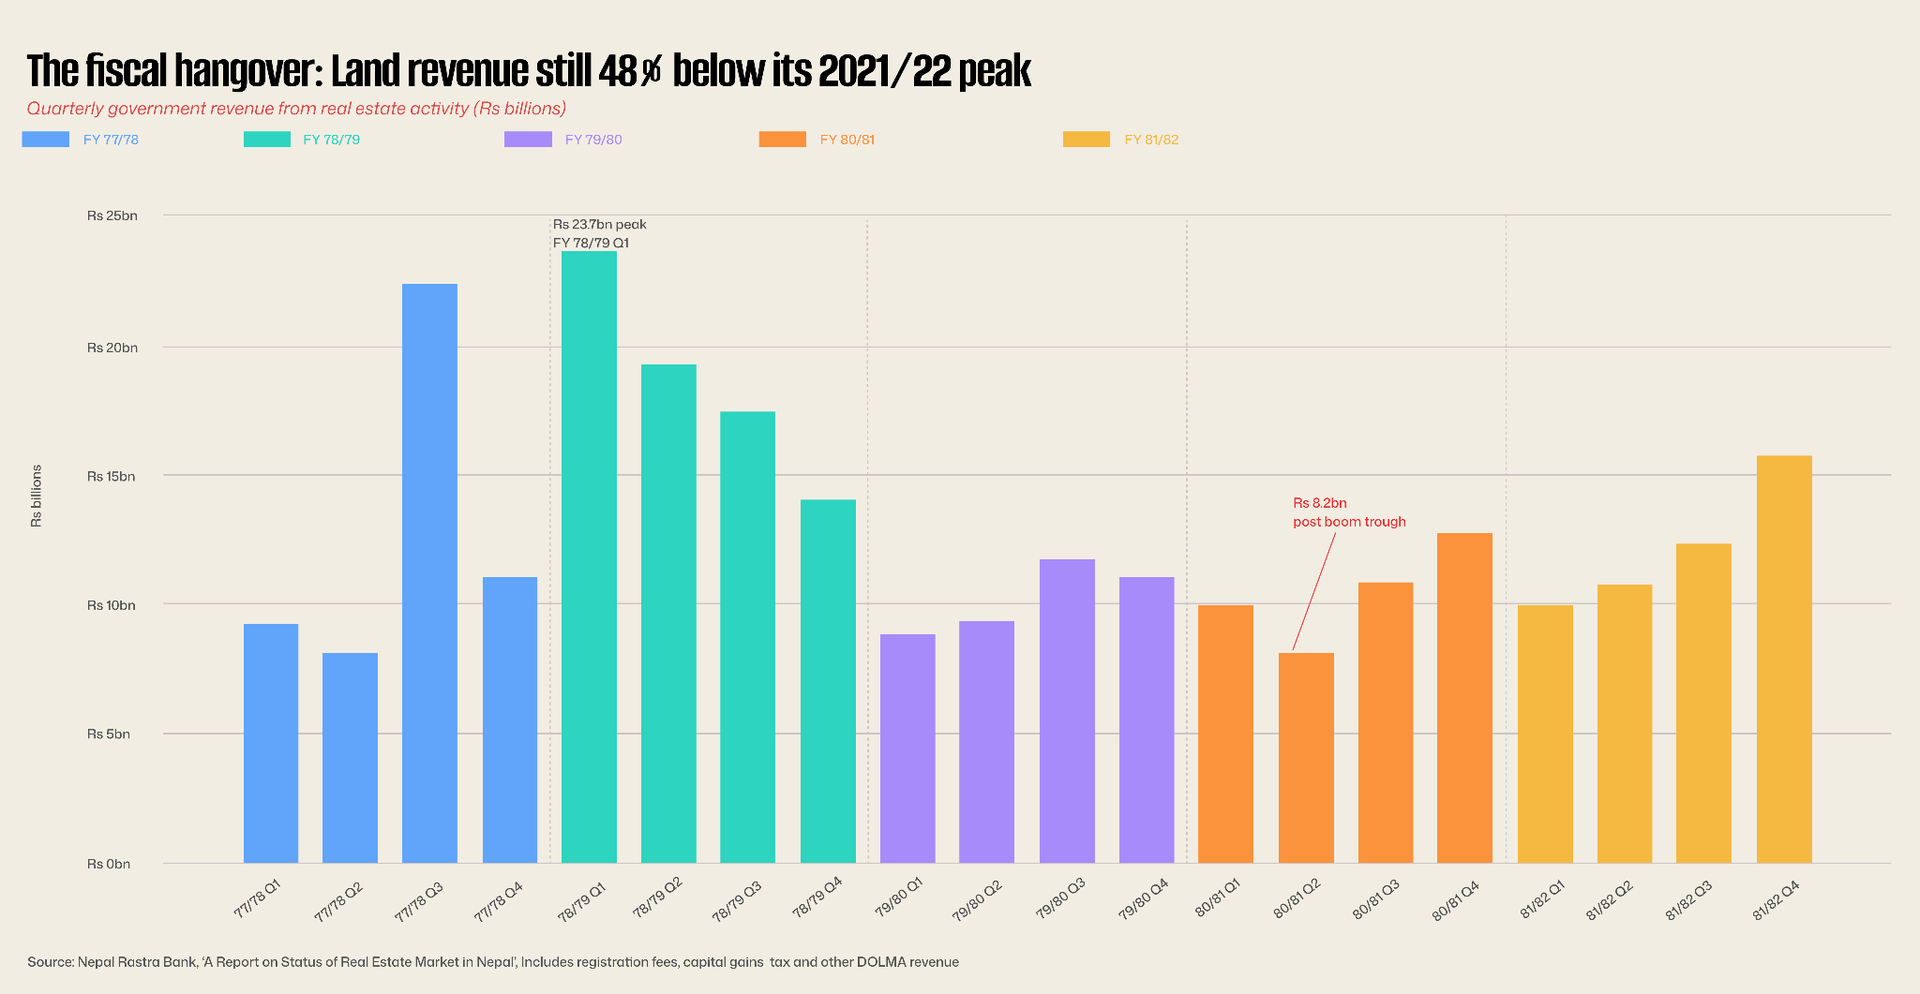
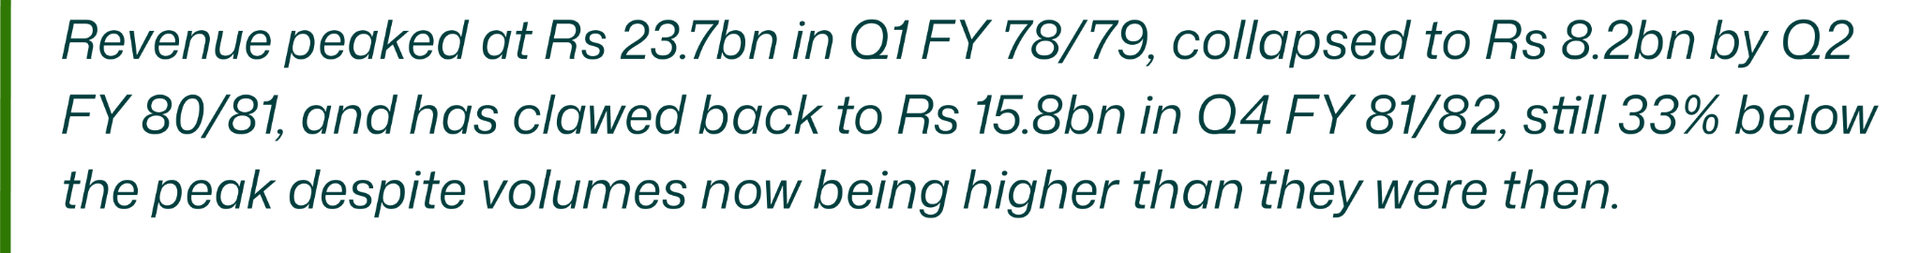
This is the chart that should unsettle policymakers. Transaction volumes in Q4 FY 81/82 (114,769) are materially above the boom-era quarters. Yet revenue collection has not recovered in proportion. Three explanations are worth holding at once:
One, compositional. If the mix of transactions has shifted toward lower-value parcels, more Madhesh less Kathmandu revenue would lag volumes mechanically. The declared value per transaction has held up, though, which partially rules this out.
Two, policy. Capital gains tax enforcement and registration fee structures may have eased relative to the boom period, either explicitly or through administrative slippage.
Three, declaration behaviour. The gap between declared value and market value may have widened. In a market where transaction costs are concentrated at the point of registration, sellers have a strong incentive to under-declare when they believe enforcement is loose. If that's what's happening, then the revenue shortfall is a measurement of informality, not a measurement of activity.
All three are plausible. NRB's own correlation analysis, a 0.43 coefficient between year-on-year declared value growth and year-on-year revenue growth suggests some combination of the last two is dominating. The revenue recovery since Q2 FY 80/81 is real but weaker than the underlying volume story. The fiscal system has not yet fully re-hitched itself to the property market.
6. The Cities
Where the value is going
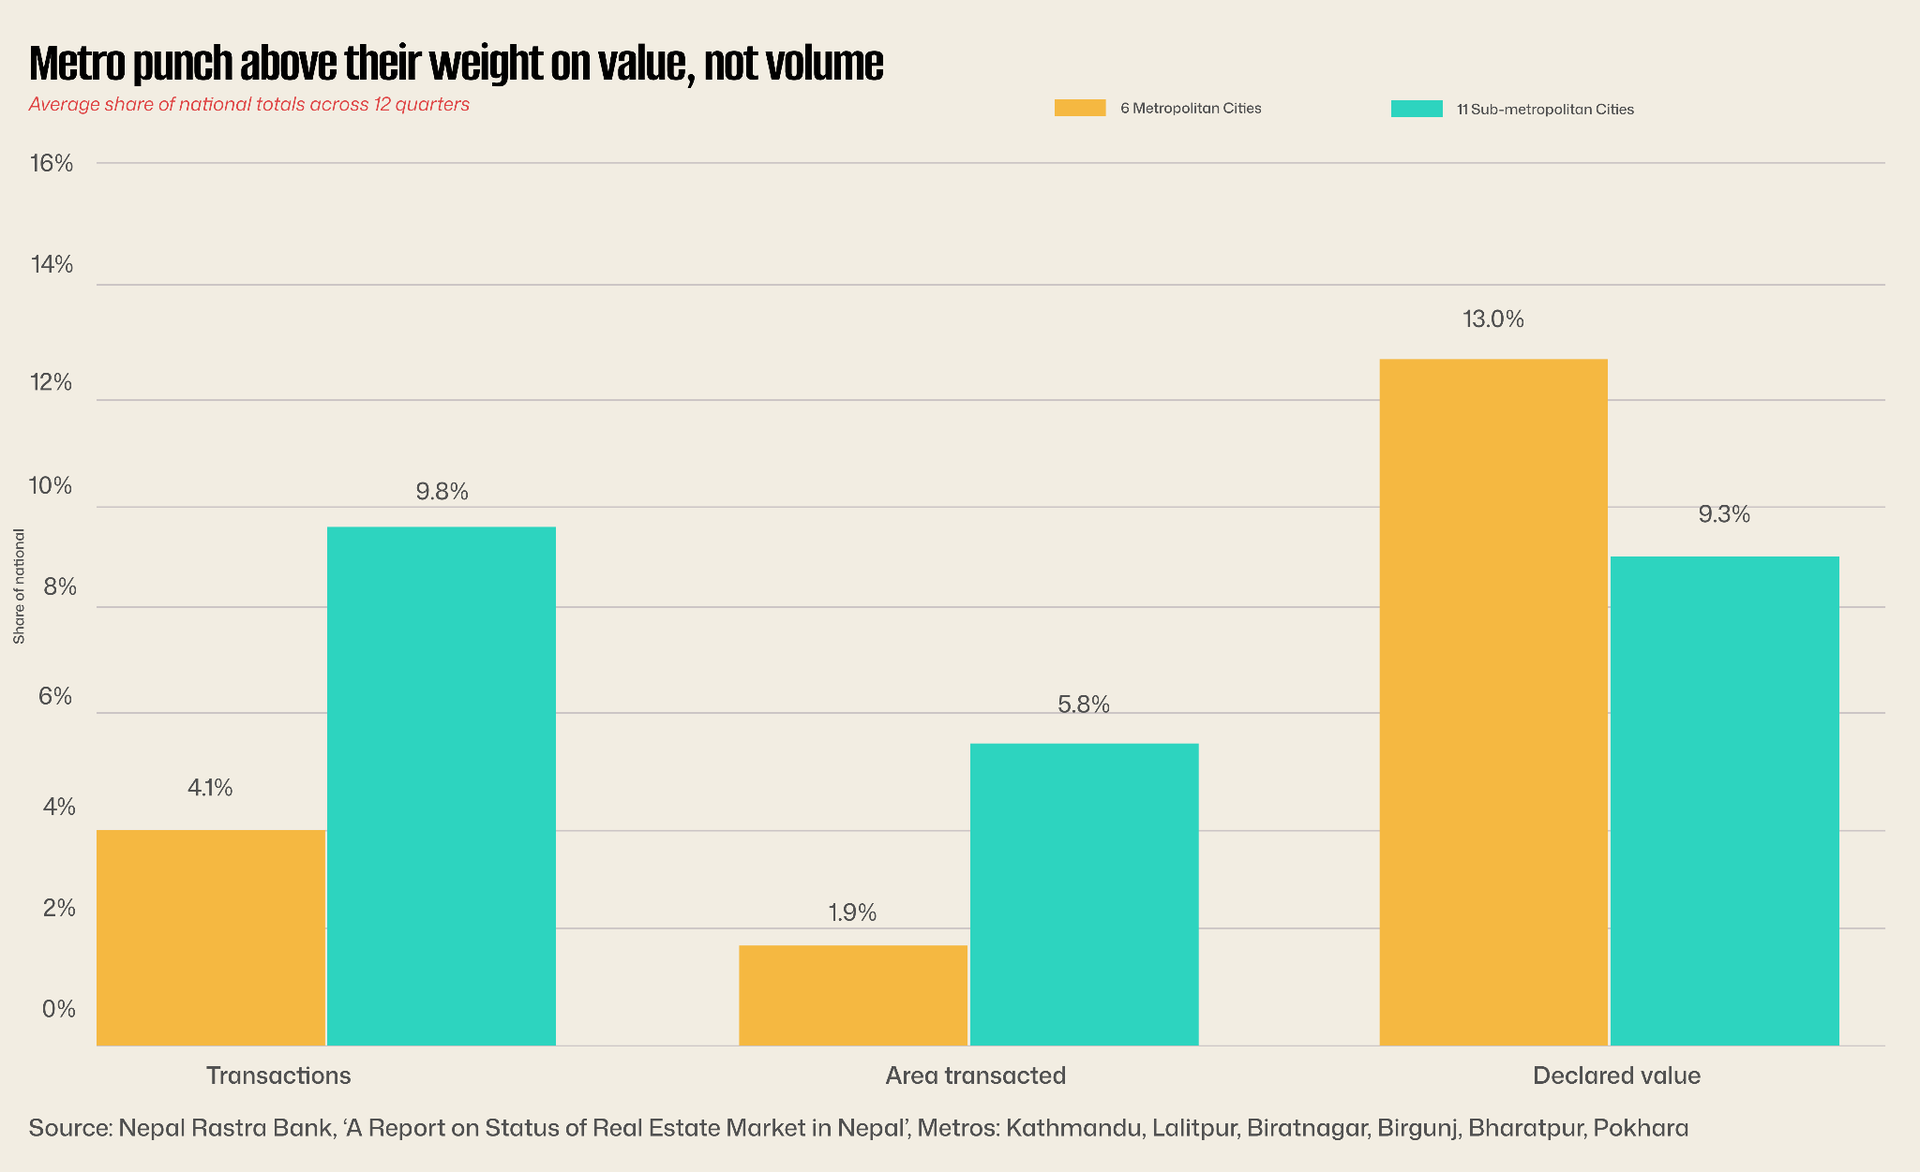
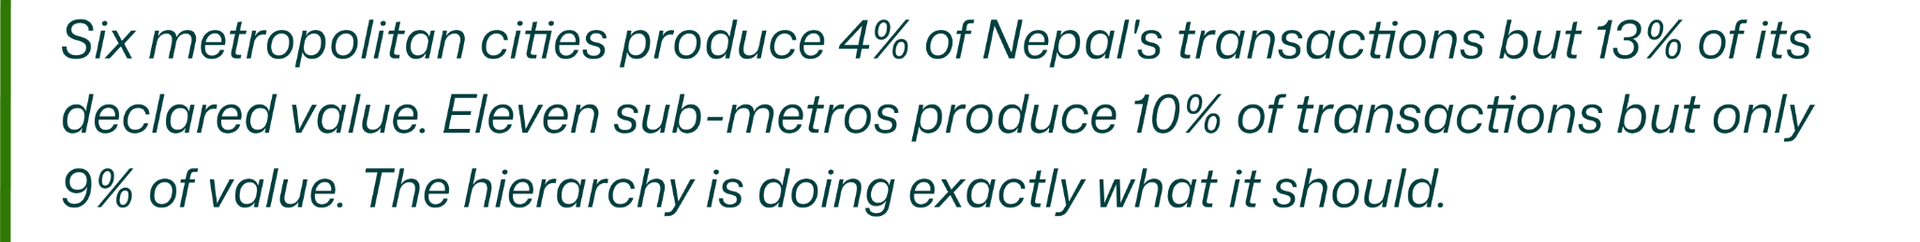
Kathmandu and Lalitpur's metro numbers obscure what's actually happening in the city data. Bharatpur, not Kathmandu is the largest metropolitan city by rajinama transaction count. Birgunj is second. Pokhara third. Kathmandu and Lalitpur trail because prices are high enough that fewer parcels change hands; the activity that does happen carries disproportionate value.
This is the single most under-reported structural shift in the NRB data. Federal restructuring, the rise of Bharatpur as a second-tier hub, Birgunj's trade-corridor economics, Pokhara's tourism-led growth, all of it is showing up in land records before it shows up in GDP prints. The metropolitan data is a leading indicator of where Nepal's non-Kathmandu urban economy is forming.
Sub-metros tell the complementary story. Itahari, Butwal, Dhangadhi, Hetauda, these eleven cities produce 9.8% of national transactions on much smaller land bases. They are where mid-market real estate is most visibly formalising, where the 2.5–10 aana plot dominates, and where the next decade of Nepali mortgage finance will be fought.
7. The Outlook
Recovery, or dead-cat bounce?
The 12-24 month read
The data through Q4 FY 81/82 is consistent with a genuine cyclical recovery but the evidence is not conclusive, and the series ends roughly nine months before this report was published.
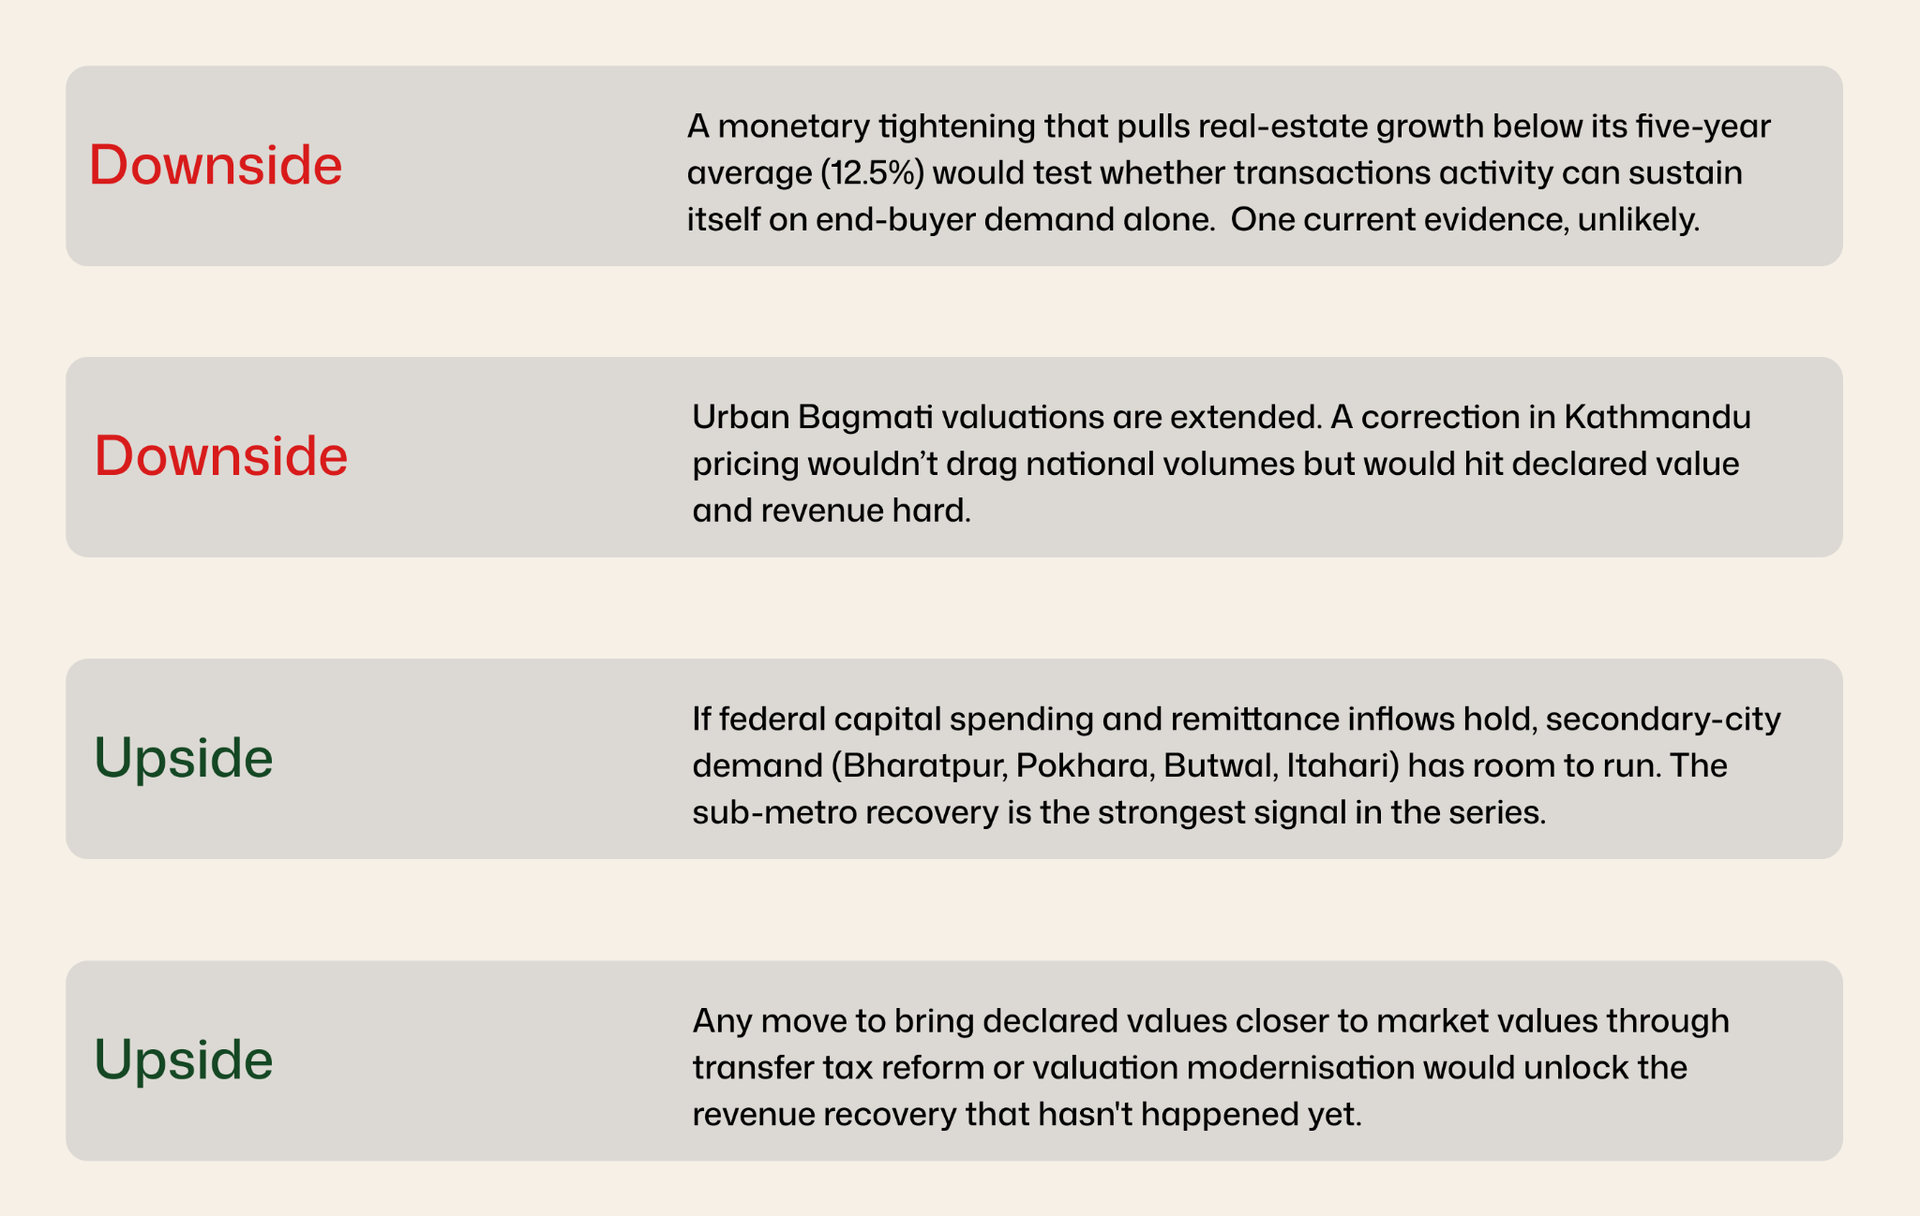
Three things support the recovery case. Transactions have risen for five consecutive non-monsoon quarters. The declared value is at a 12-quarter high. Sub-metropolitan activity, typically the last to recover in a property cycle, is posting its strongest year-on-year growth in the series. That pattern is more characteristic of a real turn than of a dead-cat bounce.
Three things keep the call tentative. Credit growth is doing more of the lifting than it should in a healthy recovery. Government revenue has not kept pace with volumes, suggesting the price signal is being partially absorbed by the informal margin. And the most recent NRB data point is from mid-2025 whatever the monetary stance has done since then is not in this chart.
8. The Bottom Line
Nepal's real estate market has recovered. The question the NRB data forces is which Nepal's market has recovered.
Bagmati's pricing market is expensive and narrow. Madhesh's volume market is cheap and deep. Credit has become a less reliable signal than it used to be. Revenue recovery is lagging activity recovery, which is both a fiscal problem and an informality tell. The middle-plot market is the centre of gravity. Secondary cities are where the next leg of growth is most likely to come from.
None of this is visible if you read headlines about the NEPSE-listed real estate stocks or Kathmandu apartment prices. It is all visible in a dataset that nobody outside NRB's Price Division had systematically turned into a time series until now.
That, more than any single number, is the finding.