What Your Mutual Fund Units Are Actually Worth
Nepal’s closed-end mutual funds have two prices: what their assets are worth and what investors will actually pay. The gap is usually a discount, but it does not behave the way the standard explanation suggests.

Thirty-one of Nepal's forty listed mutual fund schemes trade below the value of what they hold. The usual explanation says the gap narrows as the fund approaches maturity. It does not. What it tracks is the manager.
You bought units in a mutual fund at Rs 10. The fund's manager publishes a net asset value of Rs 11.88 while the units show at Rs 10.62.
Which number is real? Both are. The Rs 11.88 is what the fund's investments are worth per unit. The Rs 10.62 is what somebody else will pay you for the unit today. In Nepal those two numbers almost never match and the gap between them is the most misunderstood thing in the country's mutual fund market.
Nepal has 58 schemes run by 19 managers. This piece sets out what the two numbers mean, why they differ and what the published data says about the usual explanation which turns out not to hold.
Why this matters to more people than it sounds
Mutual funds are how Nepalis who do not want to pick shares are supposed to reach the stock market. A saver who cannot judge whether a hydropower company is worth Rs 400 can hand the decision to a professional and hold units instead.
That is the theory and the structure undercuts it. A closed-end unit holder ends up with two things to understand rather than one: what the fund's investments are doing and what the market thinks the units are worth. The second has nothing to do with the manager's skill and it is the number that appears on their phone.
Roughly Rs 47 billion sits in closed-end schemes. Every rupee of it belongs to somebody who has to understand a discount to know what they own.
The two numbers
Net asset value is arithmetic, not opinion. Take everything the fund owns: shares, debentures, fixed deposits, cash. Subtract what it owes. Divide by the number of units in issue. That is the value of one unit.
Managers publish it weekly or monthly. It moves when the fund's holdings move and nothing else affects it.
Market price is what the last buyer paid on NEPSE. It moves when somebody decides to buy or sell a unit and it can be anything.
Every Nepali scheme is issued at a par value of Rs 10, so both numbers start there and diverge afterwards.
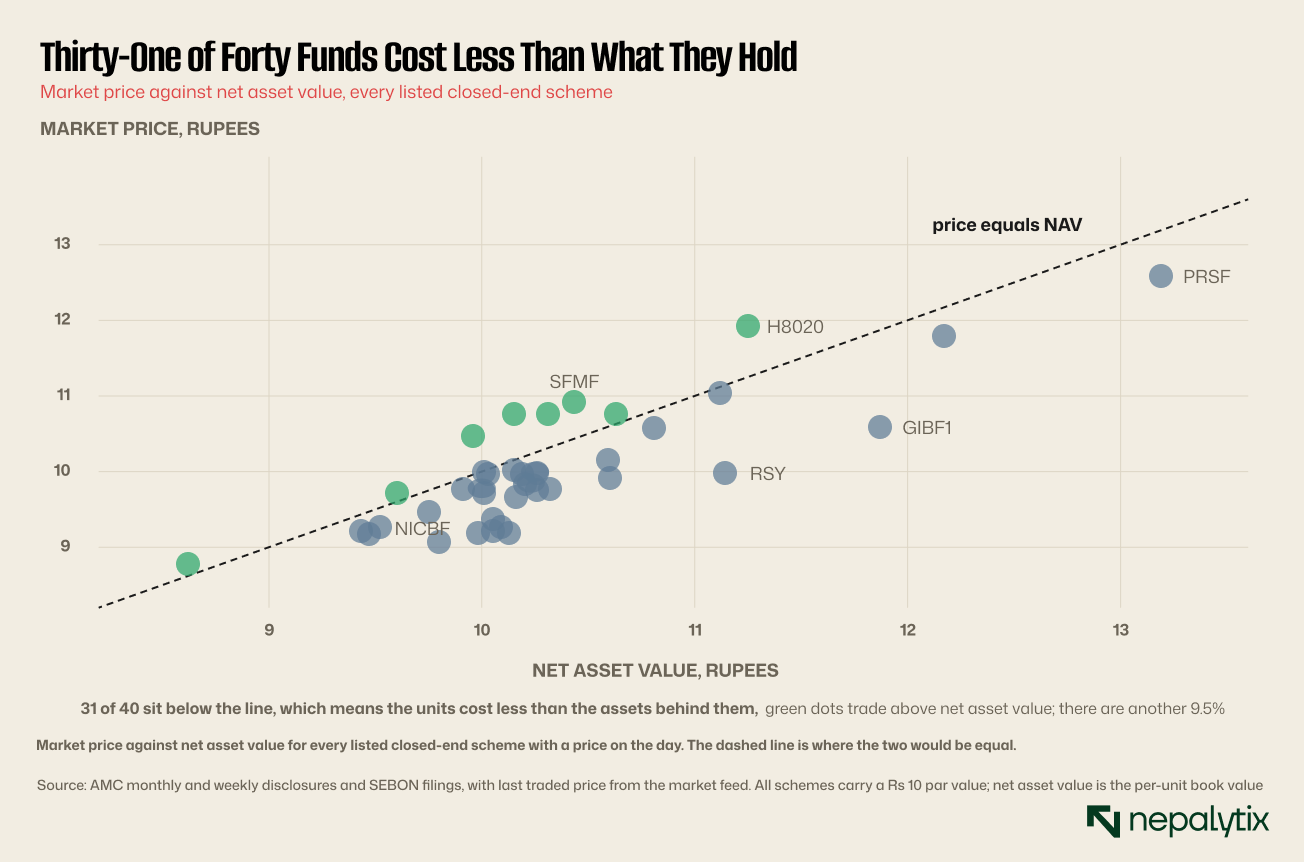
Plot one against the other and the picture is immediate. Of the 40 listed schemes with a market price, 31 sit below the line. Their units cost less than the assets behind them.
9 sit above it so their units cost more than the assets behind them.
Two things follow from that arithmetic and both catch people out.
The first is that net asset value can fall even when the fund has done nothing wrong. If the shares a fund holds drop, the value per unit drops with them. A manager who holds exactly the right things in a falling market still reports a falling number.
The second is that net asset value falls on the day a fund pays a dividend by the amount of the dividend. The money has left the fund and gone to the unit holders. Nobody lost anything and the published figure goes down. A holder looking only at the net asset value series without accounting for distributions will understate what they have earned.
This is the same adjustment problem this publication set out for bonus shares a fortnight ago, in a different form. A series that ignores what was paid out is not a record of performance.
Why there are two numbers at all
The reason comes down to which of two structures a fund uses and it is worth understanding because it decides everything else.
A closed-end fund raises a fixed amount once, issues a fixed number of units, runs for a fixed term and then winds up. Nepal's terms run from about three to eleven years. You cannot give the units back to the manager before the end. If you want out you sell to somebody else on NEPSE at whatever they will pay.
An open-end fund has no fixed size and no end date. The manager issues new units to anybody who wants them and buys them back from anybody who wants out, both at net asset value. These do not list on NEPSE.
Draw a line for each scheme from its value to its transaction price, and the difference between the two structures is the whole argument. Every closed-end line slopes because the market price is a separate number. No open-end line slopes because there is no separate number to diverge.
Nepal has 44 closed-end schemes and 14 open-end ones. The closed-end funds hold about Rs 46.9 billion and the open-end funds Rs 24.4 billion though the single largest scheme in the country is open-end.
Nepal's market is unusual in how heavily it leans toward the closed-end structure. Most developed markets moved to open-end funds decades ago precisely because the discount confuses retail investors and because redemption at value is simpler to explain.
The reason Nepal did not is partly historical and partly practical. A closed-end fund is easier to run: the manager knows the pool will not shrink so they can hold illiquid positions without worrying about redemptions. In a market where as the Exit Register documented, a great many securities cannot be sold quickly that is a real advantage for the manager.
It is an advantage bought at the unit holder's expense since the illiquidity the manager avoids is transferred to the person holding the units.
Open-end funds in Nepal must hold roughly five per cent of assets in liquid form to meet redemptions which is the cost of the structure on the other side.
One practical consequence of the structure is worth stating before the numbers, because it changes what "buying a mutual fund" means.
A closed-end scheme can only be bought at issue or from another investor. If you miss the public issue, the only route is NEPSE and you pay whatever the market asks. If the units trade at a discount that is in your favour. If they trade at a premium as nine of the forty currently do, you are paying more than the assets are worth on day one.
An open-end scheme can be bought any day, at value, in any amount the manager permits. There is no auction and no counterparty. The transaction is with the fund itself.
So the two structures differ not only in pricing but in how you get in and out at all and the second difference is the one most Nepali investors discover after buying.
How big the gap is
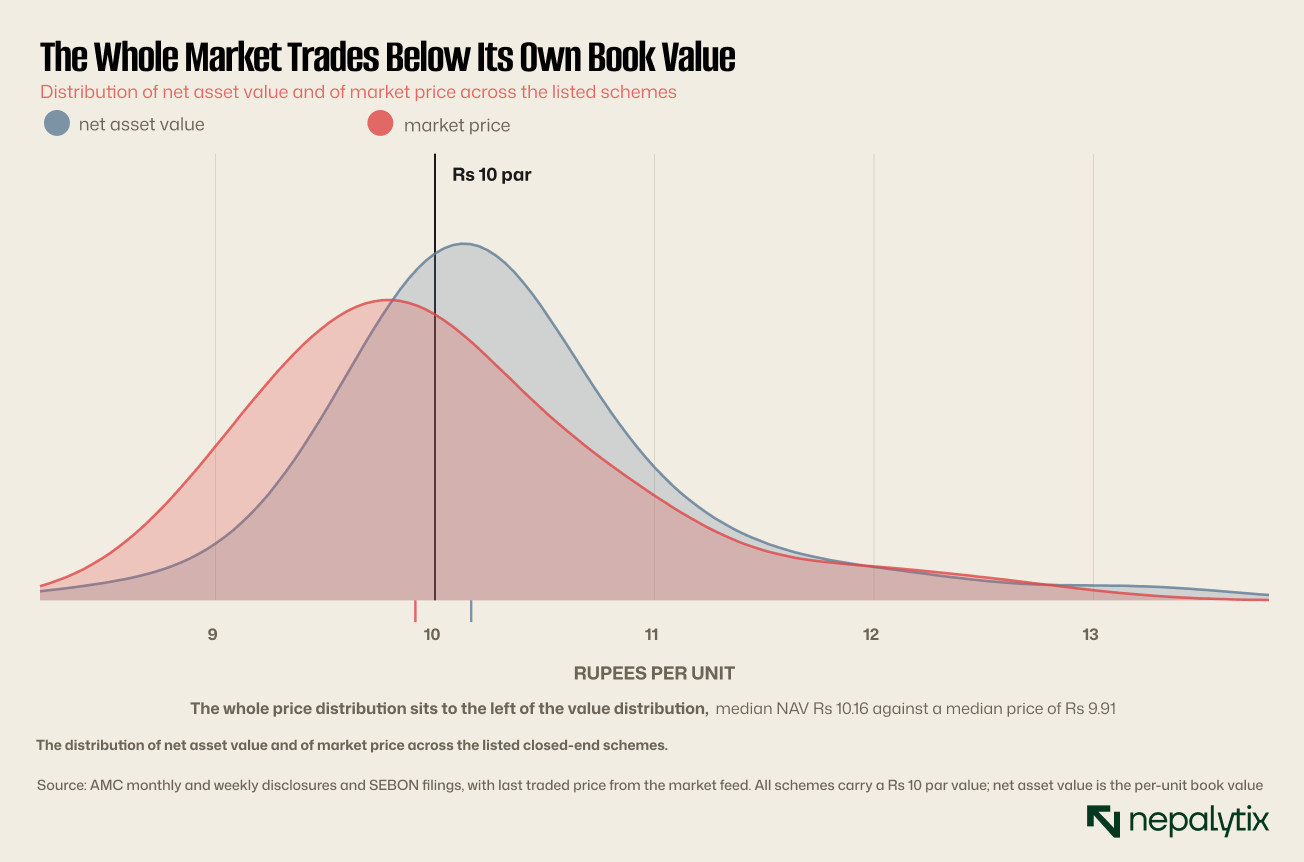
The median listed scheme holds Rs 10.16 of assets per unit and trades at Rs 9.91. The median gap is -2.6%.
Put the two distributions on the same axis and the price curve sits bodily to the left of the value curve. This is not a few outliers. The whole market trades below its own book.
The extremes are wider. Global IME Balanced Fund-1 holds Rs 11.88 per unit and trades at Rs 10.62, a gap of -10.6%. At the other end Sunrise First Mutual Fund holds Rs 10.16 and trades at Rs 10.79, +6.2%.
One more figure worth noticing. Twenty-one of the forty schemes trade below the Rs 10 they were issued at but only ten of them hold less than Rs 10 of assets. So eleven funds have made money for their unit holders and still trade below the price those unit holders paid.
There is a fourth figure worth extracting from the same data because it bears on what the schemes have actually achieved.
The median listed scheme holds Rs 10.16 against a Rs 10 par. So the median fund has grown the money entrusted to it before counting whatever it has already distributed. Thirty of the forty hold more than Rs 10 a unit.
That is the performance question, and it is separate from the pricing question. A fund can be managed well and still trade at a discount and most of the discounted ones are.
The explanation everyone gives
Ask why closed-end funds trade at a discount and you will be told three things, all of which are true and none of which is the whole story.
Your money is locked up. You cannot redeem until maturity so a rupee inside the fund is worth less than a rupee you can reach. The market discounts it accordingly.
The units barely trade. The Exit Register published here last week found closed-end funds the least exitable cohort on the exchange. A buyer who knows they may not be able to sell pays less.
The discount closes at maturity. When the fund winds up, it sells everything and pays out net asset value. So as the end date approaches, the gap should narrow toward zero because the date on which you receive full value is getting closer.
That third claim is specific, and it is testable.
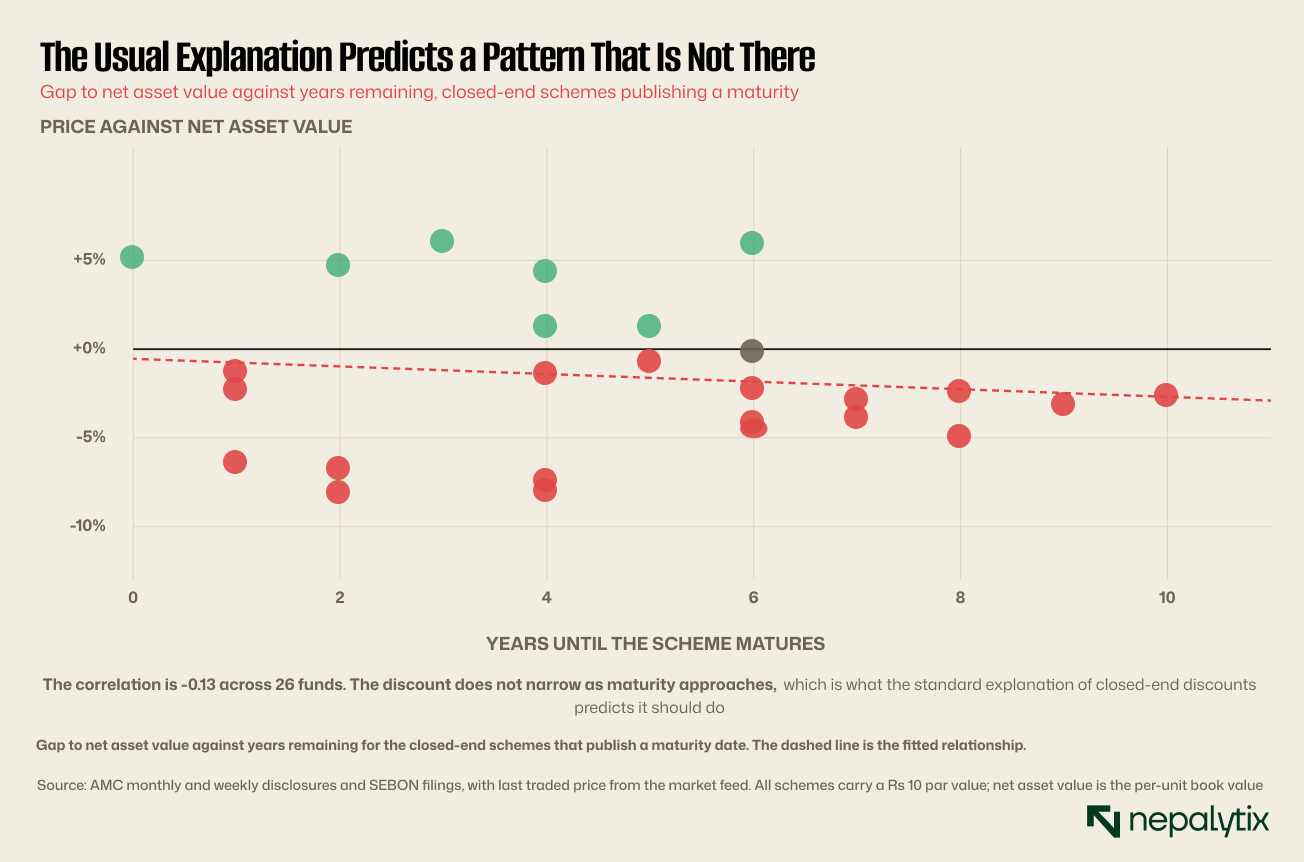
Twenty-six schemes publish a maturity. Plot the gap against years remaining and the relationship is a correlation of -0.13 which is close to nothing.
Schemes with one year to run average a gap of −3.1%. Schemes with eight years to run average −3.5%. Schemes with six years to run average −0.9%, which is narrower than either.
The discount does not narrow as maturity approaches. Whatever is producing it in Nepal, it is not the mechanism the explanation describes.
It is worth being careful about what this test can and cannot show, because it is a cross-section rather than a history.
What is measured here is twenty-six different funds at one moment, each at a different distance from its own maturity. What the theory actually predicts is that a single fund's discount narrows as that fund approaches its own end date which would require watching one fund over several years.
The cross-section is still informative. If the mechanism were strong, funds close to maturity should as a group show narrower gaps than funds far from it, and they do not. But a follow-up that tracked the same schemes over time would settle it properly, and nothing published assembles that series.
One case in the data is suggestive without being conclusive. NMB 50 has matured and it trades at a premium of 5.3% to its last published net asset value. A fund about to pay out should trade near value, not above it.
The lock-up explanation deserves more credit than the maturity test gives it and it is worth separating the two.
Lock-up says a rupee you cannot reach is worth less than one you can which should produce a discount. That part is consistent with what we see: most schemes trade below value.
The maturity extension says the discount should shrink as the lock-up shortens. That is the part that fails. So the evidence supports a persistent penalty for being locked in and not a penalty that scales with how long the lock-in has left to run.
A penalty that does not scale with duration is not really a lock-up penalty. It is closer to a fixed charge for the structure itself, applied regardless of how much of it remains.
What does explain it
Three candidates can be tested against the published figures, and two of them fail.
Fund size. A larger fund might trade closer to value because more units are available. The correlation between assets under management and the gap is +0.05. Nothing.
Performance. A fund whose assets have grown might attract buyers and trade at a narrower gap. The correlation between net asset value per unit and the gap is −0.17 and it points the wrong way: the funds that have done better trade at slightly wider discounts, not narrower.
The manager. This one does not fail.
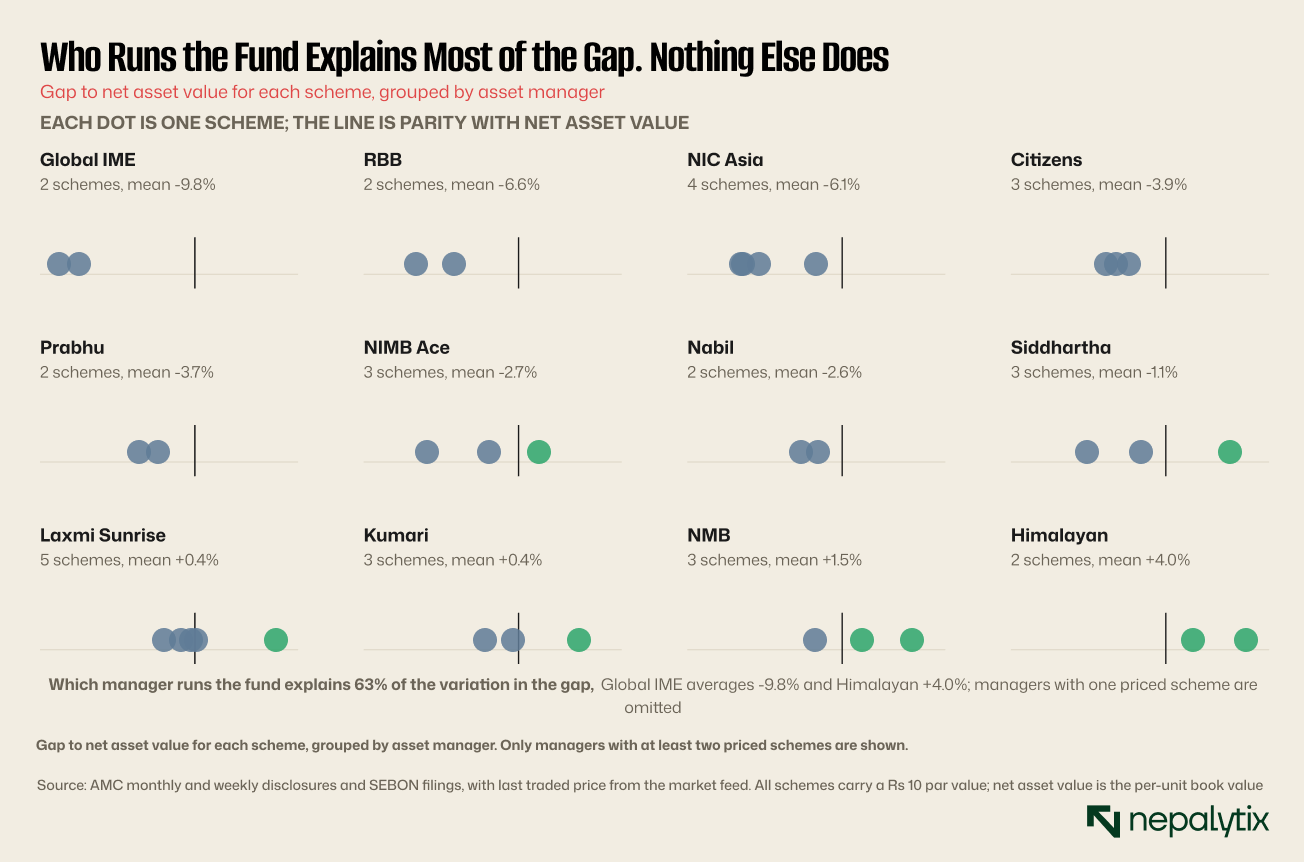
Group the schemes by the company that runs them and the differences are large and consistent. Global IME's two schemes average −9.8%. RBB's average −6.6%. NIC Asia's four average −6.1%.
At the other end, Himalayan's two average +4.1%, NMB's three +1.5%, Kumari's three +0.4%.
Which manager runs the fund explains 63% of the variation in the gap across the 34 schemes at managers with more than one. Maturity, size and performance together explain almost none of it.
Why that is, the published data cannot say. It could be that some managers communicate better, or distribute more consistently or are simply better known to the investors who buy units. It could be that a manager's other schemes set expectations for the next one. What the figures establish is only that the manager matters and the usual explanations do not.
The manager result also has an uncomfortable implication for how these funds are sold.
Every new scheme is marketed on its strategy: a growth fund, a balanced fund, a large-cap fund, a focused equity fund. The names in Figure 4 describe strategies.
On the evidence, the strategy is not what the market prices. Two schemes from the same manager with different mandates trade at similar gaps, and two schemes with the same mandate from different managers do not. NIC Asia runs a select fund, a flexi cap fund, a growth fund and a balanced fund and all four sit between −2.1% and −7.9%.
Whatever the market is responding to, it is operating at the level of the house rather than the fund.
A note on the schemes that publish no maturity at all. Of the forty listed schemes with a price, fourteen do not carry a published maturity in the data used here.
That matters more than it sounds. The maturity date is the one moment a closed-end holder reliably receives full value so it is the single most consequential fact about the security after the net asset value itself. A holder who does not know when their fund winds up does not know when or whether, the discount they are carrying will ever close.
The dates exist in every scheme's offer document. That they are not carried alongside the price on the platforms most investors use is a disclosure gap of the same kind this publication has documented elsewhere in the market.
What to do with this
Never buy a closed-end scheme at par in the public issue if you can buy it later at a discount. A new scheme issues at Rs 10 and on this evidence is likely to trade below that within a year or two. Buying at issue means paying full value for something the market will price below value.
A discount is not automatically a bargain. You are buying Rs 11.88 of assets for Rs 10.62, but you cannot access the Rs 11.88 until maturity and the discount may still be there when you want to sell. It is a bargain only if you can hold to the end or if the gap narrows and the evidence above says the gap does not reliably narrow.
Check the manager before the scheme. On this data that is the variable that moves the price most.
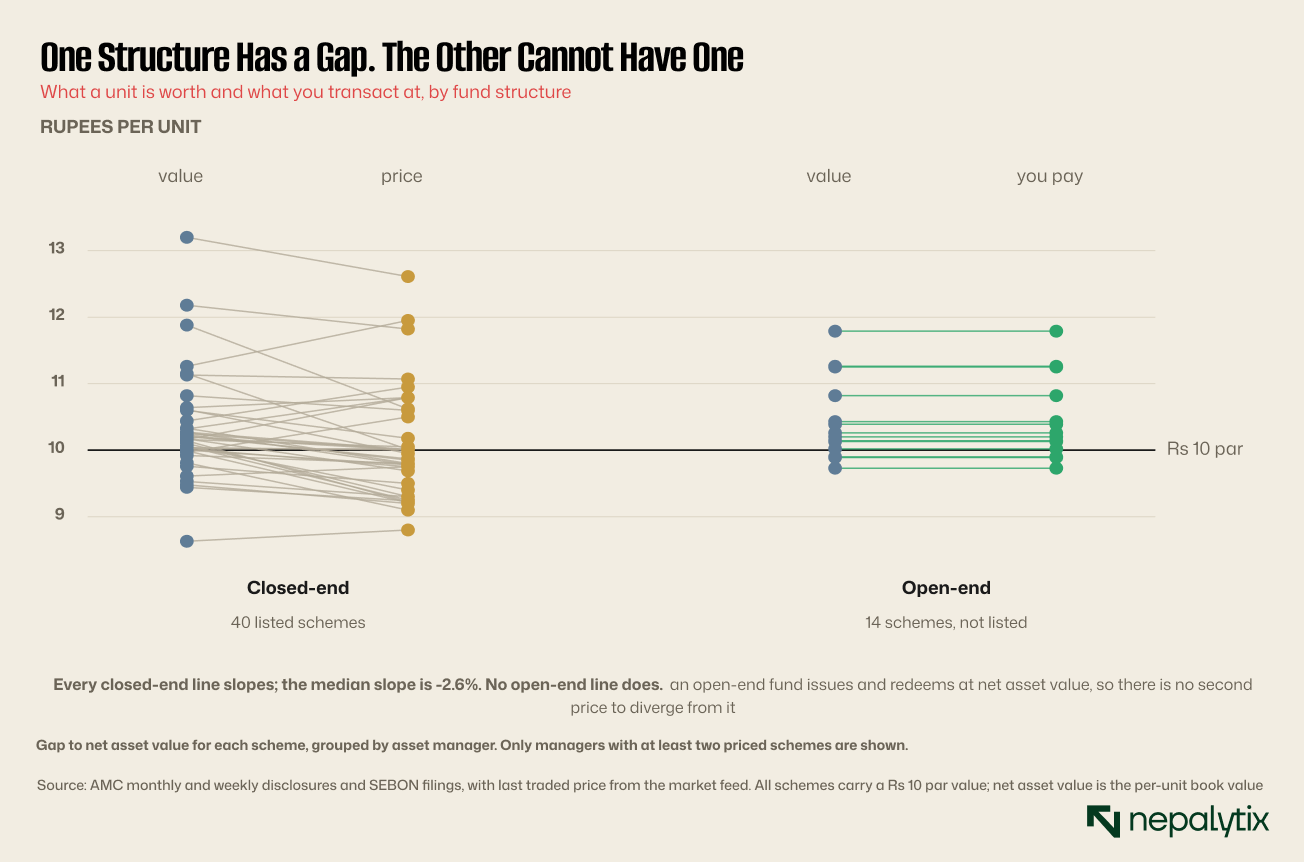
If the discount is what bothers you, the open-end funds do not have one. You transact at net asset value in both directions. There is no market price and no gap. The trade-off is that you cannot buy them on NEPSE and you deal with the manager directly.
Read the net asset value, not the price, to judge the fund. The price tells you what the market thinks of the units. The net asset value tells you what the manager has actually done with your money. They are different questions.
One practical warning about acting on any of this. The Exit Register published on newsletter measured how long it takes to sell a position in each listed security. Closed-end mutual funds came out as the least exitable cohort on the exchange, worse than microfinance.
Several schemes turn over a few hundred thousand rupees in a session which means a holding of Rs 10 lakh takes weeks to sell. A discount that looks like a bargain is only a bargain if you can eventually get out, and for some of these schemes the only reliable exit is maturity.
That is a reason to size positions accordingly rather than a reason to avoid the funds. But it should be known before buying, and it is not something the discount figure tells you.
What would settle it
Three pieces of data would turn this from an observation into an explanation and all three exist.
A history of the gap for each scheme. Net asset value is published weekly and prices daily. Somebody maintaining that series for five years could show directly whether any fund's discount narrowed as it approached maturity which the cross-section cannot.
Distribution history by scheme. A fund that has paid out steadily has returned value its net asset value no longer reflects. Comparing schemes on net asset value alone penalises the ones that distributed.
Unit holder counts. If the manager effect is really a distribution effect, the schemes trading at premiums should have more holders and more concentrated placement. That is recorded at the depository and not published.
None of these requires new collection. All three are already generated in the ordinary course of running a fund.
One more comparison puts the Nepali gap in proportion. Closed-end funds trade away from value everywhere; the structure produces it by construction. International experience puts typical closed-end deviations in the range of ten to twenty per cent either side of value against exchange-traded funds which stay within about one per cent because their structure permits arbitrage.
Nepal's median gap of -2.6% and extremes of -10.6% to +6.2% therefore sit inside the normal international range rather than outside it. The discount is not evidence of anything peculiar to Nepal.
What is peculiar is which variable it tracks. In markets with active closed-end analysis the discount responds to performance and to the approach of maturity. Here it responds to neither and responds instead to the house name which is what a market with thin trading and no published research would be expected to produce.
The point
A mutual fund unit in Nepal has two prices because most Nepali funds are closed-end and a closed-end unit can only be sold to another investor rather than back to the manager.
The gap between them is usually a discount, it averages a few per cent, it reaches ten per cent at the extremes and it does not behave the way the standard explanation says it should. It does not narrow toward maturity. It does not track size. It does not reward performance.
It tracks the name on the fund.
There is one reading of the manager result that is less flattering to investors than to managers, and it should be put on record.
It may be that the market is not pricing the manager's skill at all but the manager's distribution network. A house with a large retail brokerage arm and many branches can place units with investors who will hold them, which supports the price. A house without one cannot.
If that is what is happening, the gap measures how effectively a fund's units were sold rather than how well its portfolio was run and a unit holder reading the discount as a verdict on the manager's investing would be reading it exactly backwards.
Nothing published distinguishes the two. What can be said is that the correlation with performance is negative and weak so whatever the market is rewarding, it does not appear to be returns.
A worked example
Take one scheme and follow the numbers through because the arithmetic is easier than the explanation.
Global IME Balanced Fund-1 holds Rs 11.88 of assets per unit and last traded at Rs 10.62.
Buy one unit at Rs 10.62 and you own Rs 11.88 of investments. The gap is Rs 1.26, or 10.6% of what you paid. If the fund wound up tomorrow and sold everything at the marked prices, you would receive Rs 11.88 and make Rs 1.26 on a Rs 10.62 outlay, which is 11.9%.
It will not wind up tomorrow. Until it does, the Rs 11.88 is a number in a report and the Rs 10.62 is the only figure you can convert into money.
Three things can close the gap. The fund matures and pays out. The market changes its mind and bids the units up. Or the fund distributes cash which reduces the net asset value and hands you part of the difference directly.
The third is the one that happens regularly and it is why the distributable dividend a scheme declares matters as much to a discounted fund as the discount itself.
Disclaimer
This report has been prepared by Nepalytix for informational and educational purposes only and does not constitute investment advice, an offer, or a solicitation to buy or sell any securities.
The information contained in this report is based on sources believed to be reliable; however, Nepalytix does not guarantee its accuracy, completeness, or timeliness. Opinions, estimates, and projections expressed herein are those of the authors as of the date of publication and are subject to change without notice.
Investing in securities involves risks, including the possible loss of principal. Past performance is not indicative of future results. Readers are advised to conduct their own independent research and consult with a qualified financial advisor before making any investment decisions.
Nepalytix and its contributors may hold positions in the securities discussed in this report at the time of publication or thereafter.
Neither Nepalytix nor any of its affiliates accept any liability for any loss arising from the use of this report or its contents.