Where Nepal’s Bank Credit Really Went in 2024/25 -And Why Productive Sectors Are Losing Out
Nepal’s banking system added over Rs. 400 billion in credit last year, but the real story lies beneath the surface.

Where every rupee of bank credit went last year and what banks stopped lending for
A teardown of Nepal’s bank credit allocation, FY 2024/25 and the first eight months of FY 2025/26. The composition shifted.
Nepal's banks and financial institutions added Rs. 407.62 billion in fresh private sector credit during the eleven months ending mid-June 2025. The number is large in absolute terms equivalent to roughly 7% of GDP and the year-on-year growth rate of 8.7% reads as steady expansion. The headline is reassuring.
The headline is also misleading.
The growth rate masks where the credit actually went. Twelve sectors and loan categories are tracked by NRB. Two contracted outright. Four grew faster than 10%. The fastest-growing categories aren't the ones a developing economy is supposed to be financing. The shrinking ones are the ones a developing economy is supposed to be protecting.
Look at the data.
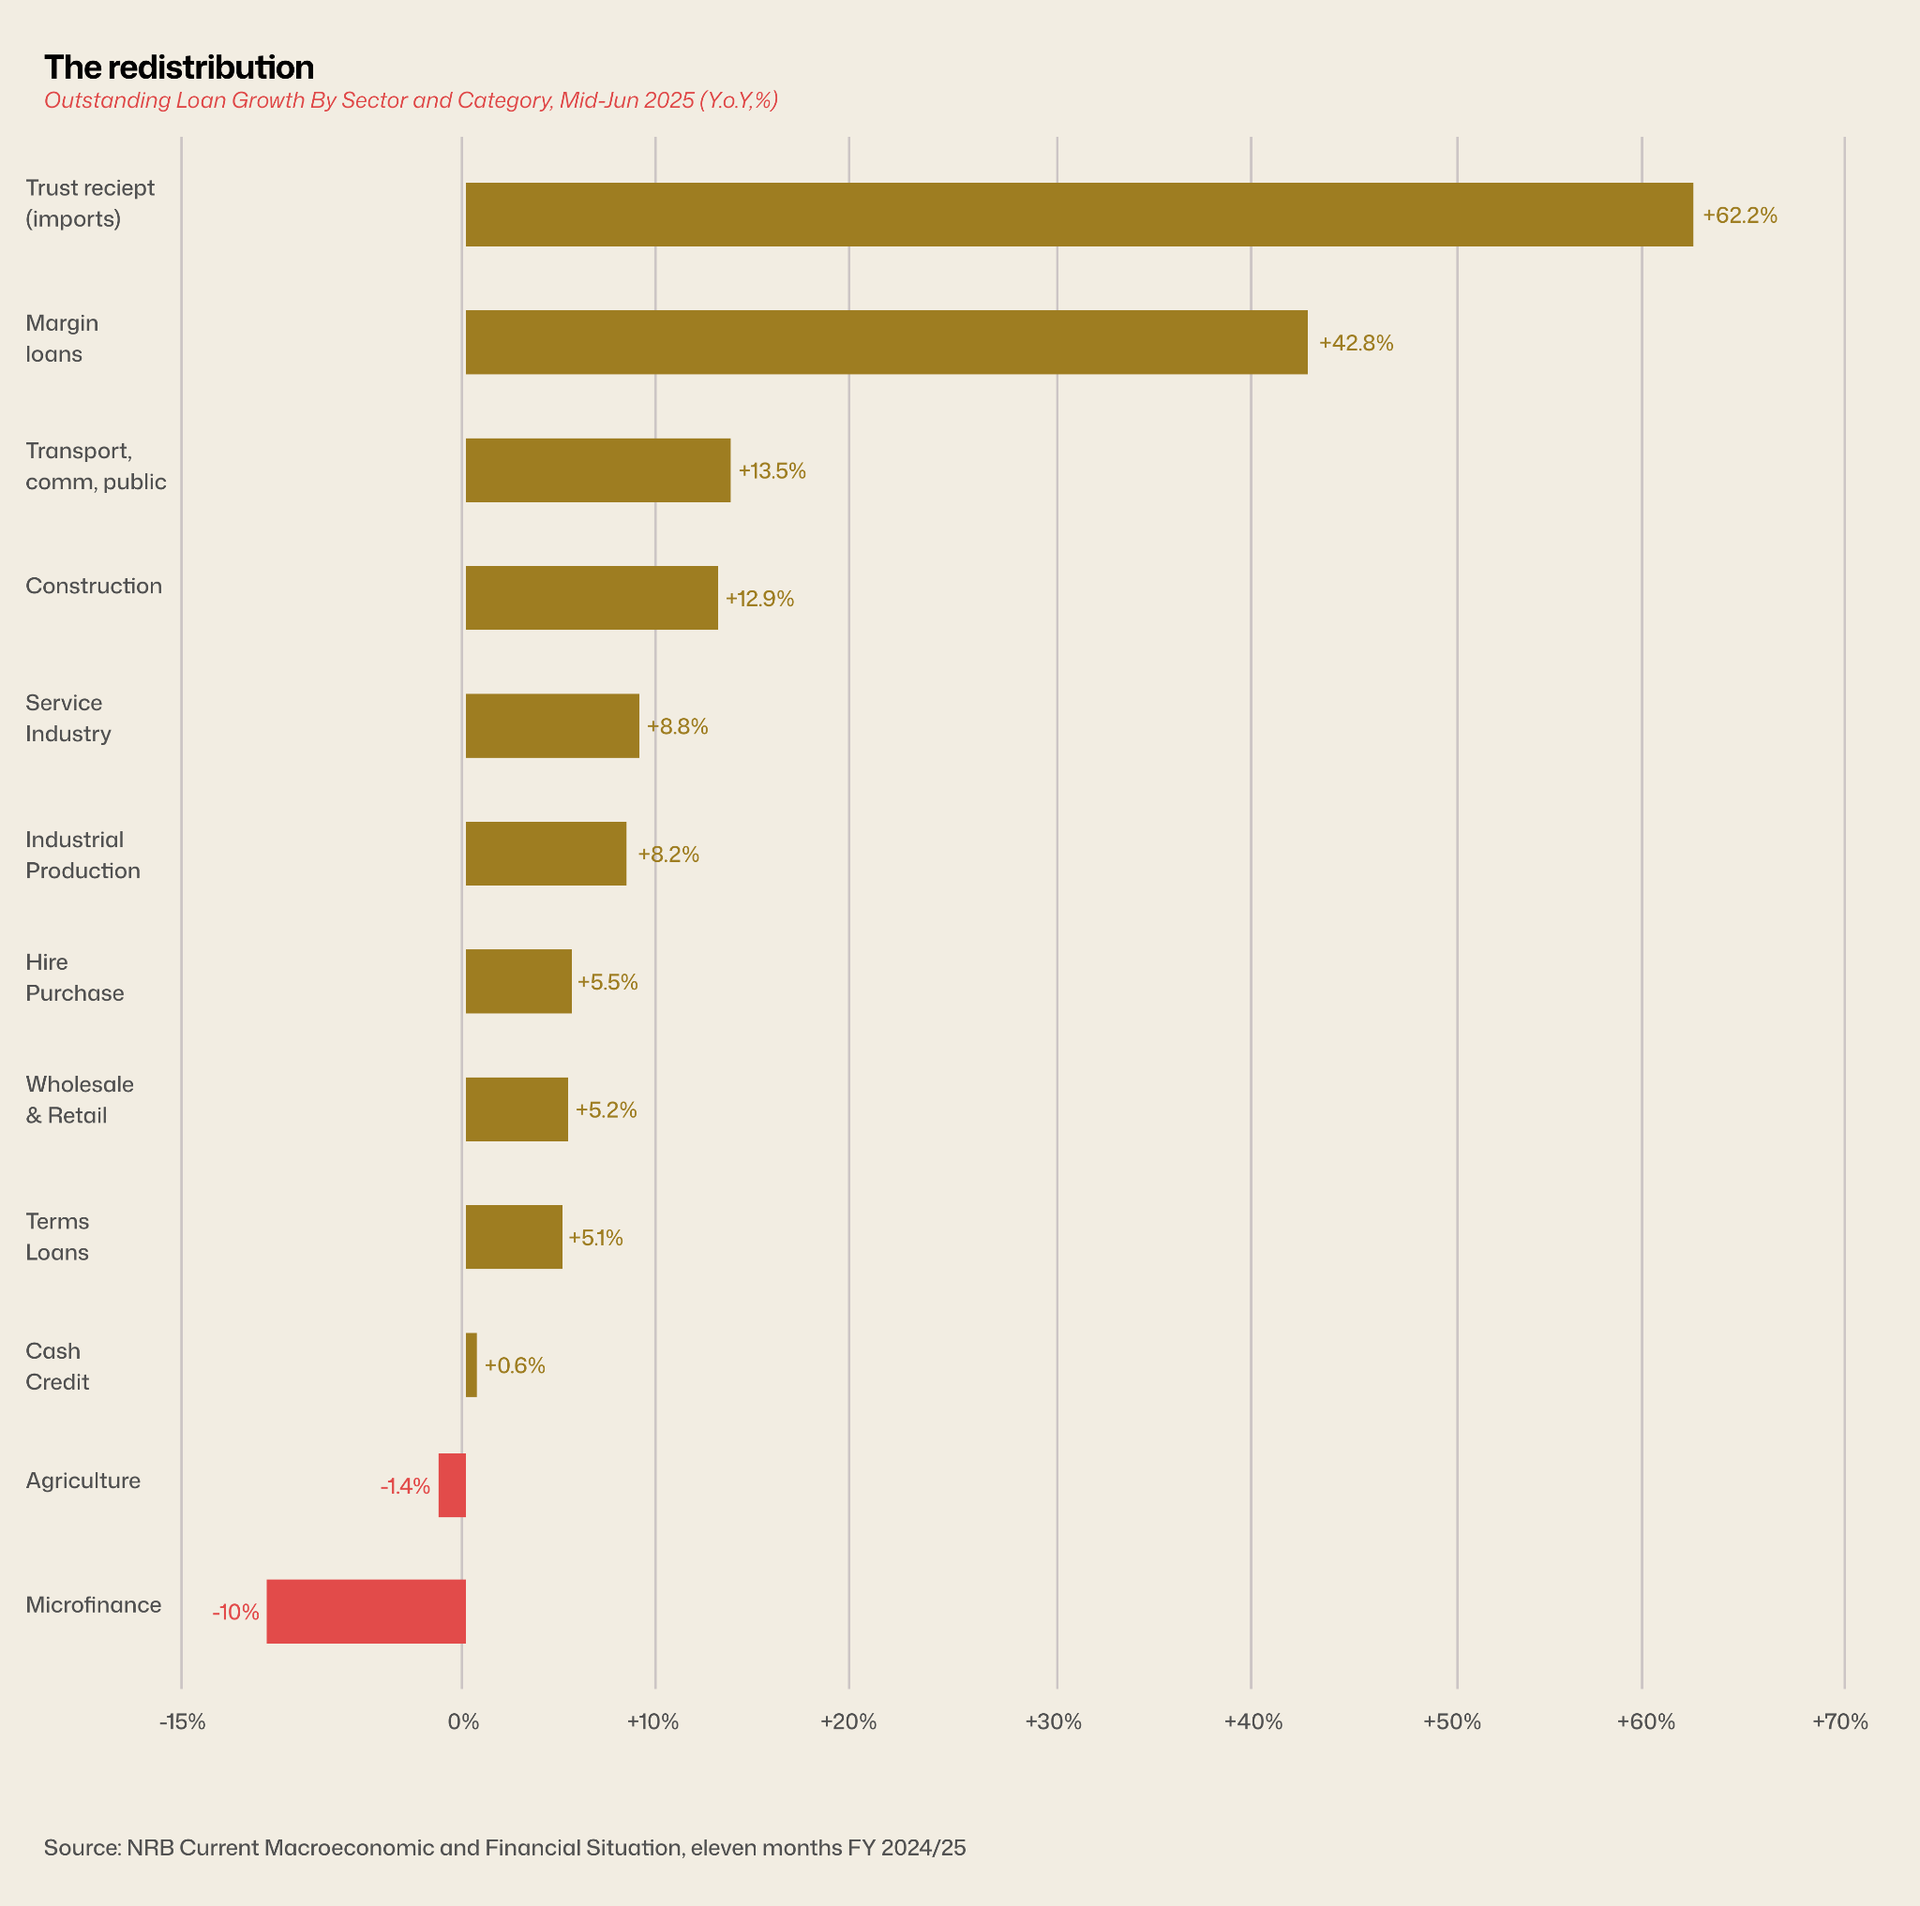
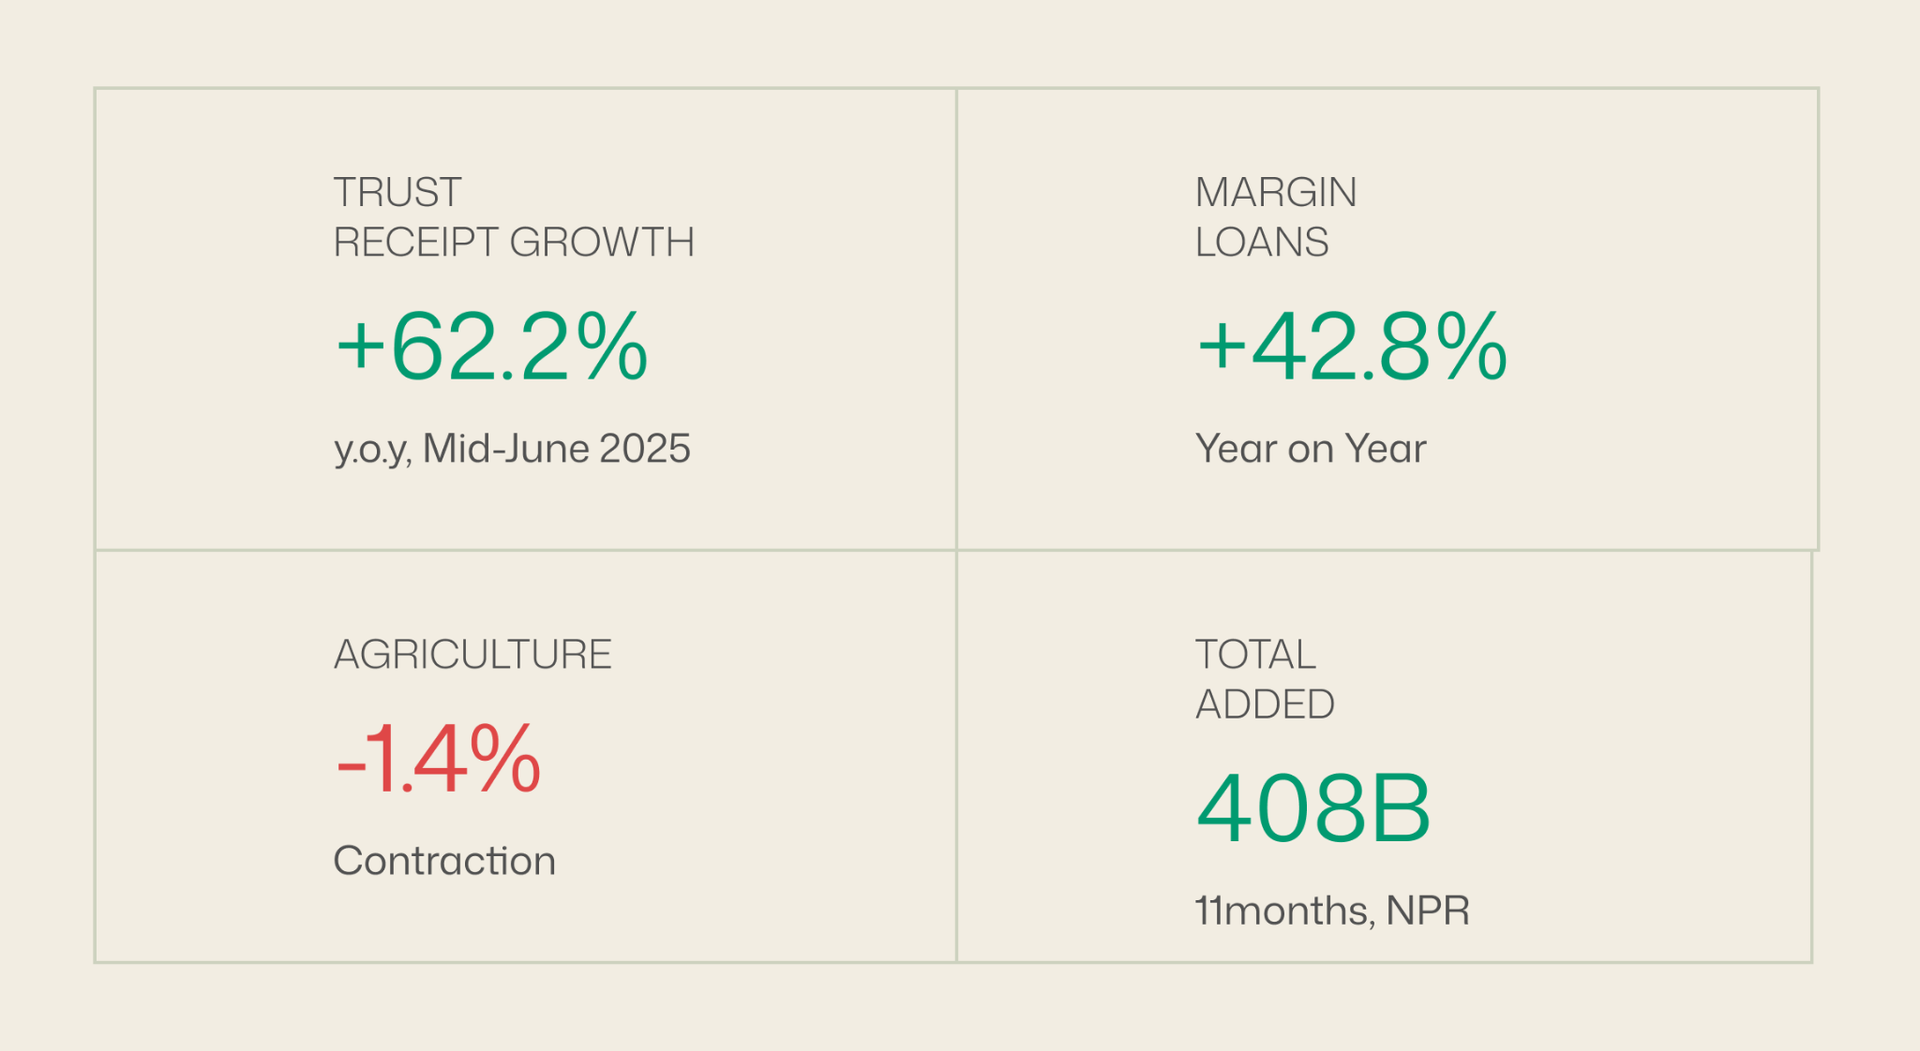
The two longest bars on the negative side are the two sectors NRB has spent decades pushing credit toward. Agriculture, which still employs roughly 60% of working-age Nepalis and produces around 24% of GDP, lost outstanding credit in absolute terms falling 1.4% to Rs. 412.1 billion. Microfinance, the channel through which sub Rs. 500,000 loans reach rural households and small enterprises, lost more contracting roughly 10% during the same window.
Now look at the two longest bars on the positive side. Trust receipt loans, short-term financing extended to importers against shipping documents, used predominantly to bring in vehicles, steel, electronics, and consumer goods grew 62.2%. Margin loans, credit extended against collateral of listed shares, used by retail investors to lever NEPSE positions grew 42.8%.
Banks didn’t tighten last year. They were redirected.
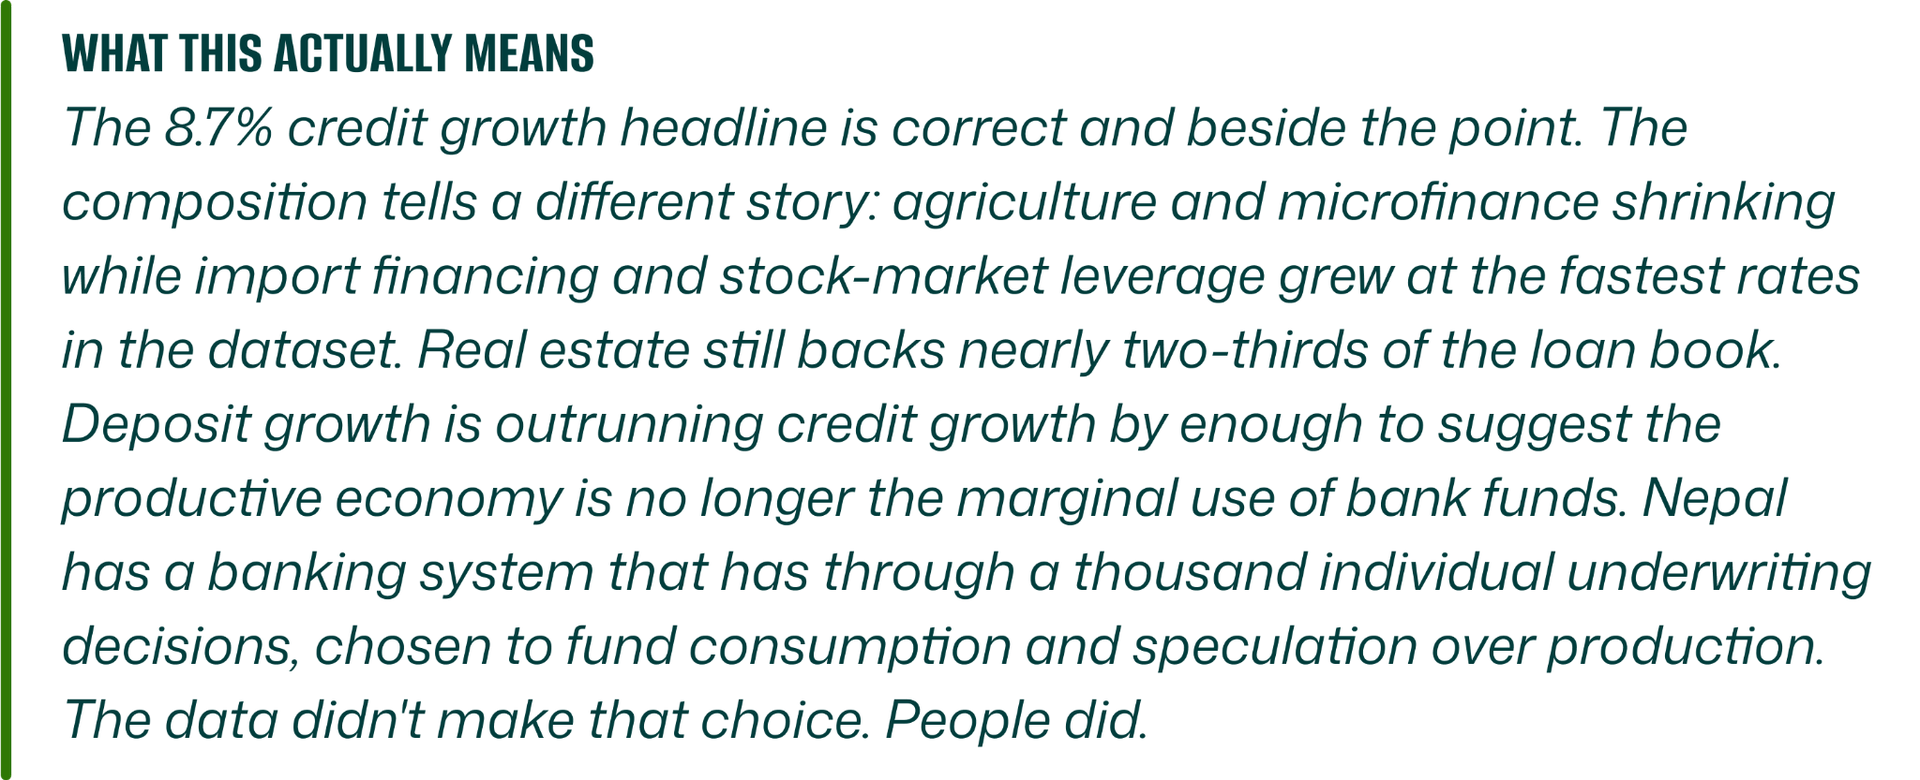
The two strongest growth categories don't fund production. They fund consumption (imports) and speculation (margin trading). The two weakest fund the productive base of the country. The sign on the growth column tells you which direction Nepal's banking system has chosen to lean.
Trust receipts and margin loans are valid banking products. Short tenor, high-quality collateral, listed equities for margin, the imported goods themselves plus a foreign-bank letter of credit for trust receipts. They're easier to underwrite than an agricultural loan in Surkhet. From any one bank's profit-and-loss perspective, the redirection isn't irrational.
It's just not what the system was supposed to do.
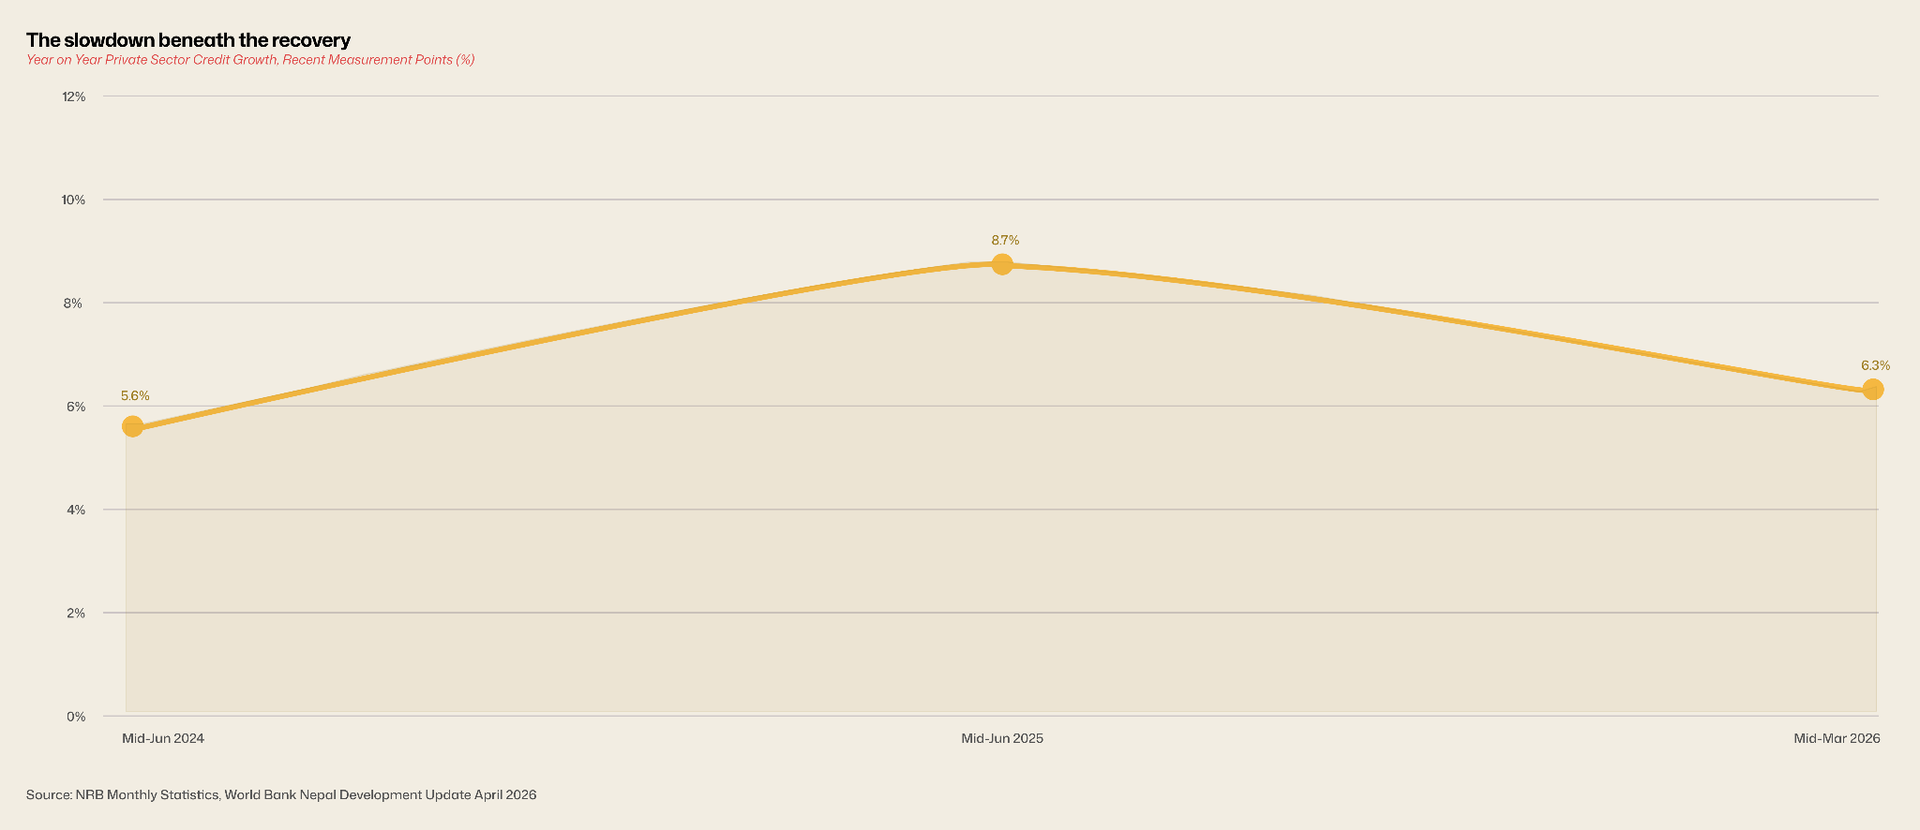
The 8.7% credit growth in mid-2025 looked like a recovery. It wasn't a sustained one. The latest reading from NRB, the eighth-month figure for FY 2025/26, equivalent to mid-March 2026 has private sector credit growth back down to 6.3%. The intervening months saw the September 2025 anti-corruption unrest, which the World Bank estimates cost the economy about 1.3% of GDP, and an NRB policy rate cut of 75 basis points in the first half of FY 2025/26. The rate cut was supposed to stimulate borrowing. It didn't, much.
Place this trajectory in context. Nepal's pre-pandemic credit growth which the system ran on through 2017–2019 typically came in between 17 and 22% annually. The 6.3% we're seeing now is roughly a third of that pace. Regionally, Bangladesh's banking sector has been growing private credit at around 10–12% over comparable periods, India between 12 and 16%. Nepal isn't just slower than its own past. It's slower than its peer set.
A slowdown of this depth, sustained across multiple measurement points and surviving a substantial rate cut, isn't cyclical. Cyclical slowdowns reverse when monetary conditions ease. This one didn't. What we're looking at is structural, banks holding deposits they cannot profitably or prudently deploy, in an economy where productive borrowing demand has thinned and the remaining demand is concentrated in categories that don't compound into long-term growth.
The redistribution chart and the trajectory chart are the same story told two ways.
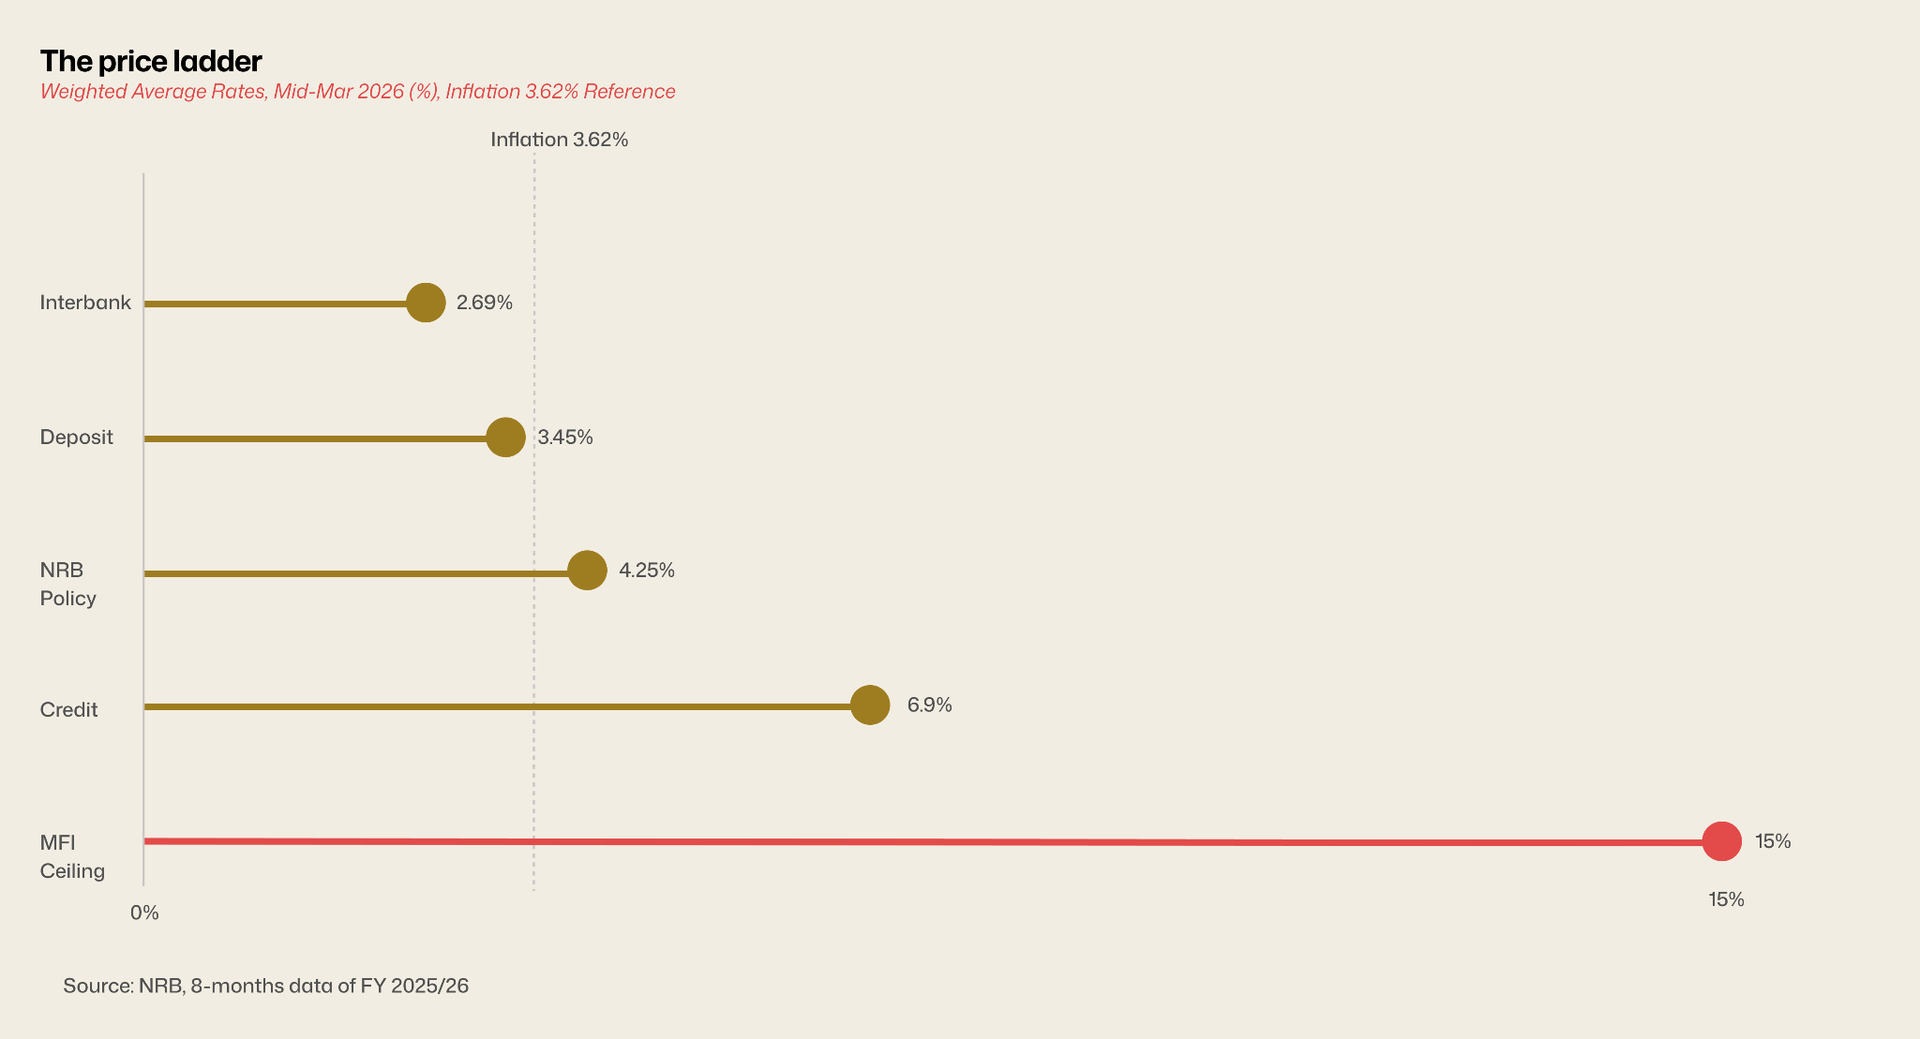
If the redistribution chart shows where credit went, the price ladder shows why. The cheapest rupee in Nepal is the one banks lend each other on the interbank market: 2.69%. The next cheapest is the rupee a bank pays a depositor, 3.45% on a class-A bank fixed deposit. NRB's policy rate sits between the two at 4.25%. The rate a class-A bank charges its best corporate borrower is 6.9%. The regulated ceiling on microfinance lending is 15%, with effective rates often higher once service charges stack. A Rastra Bank rupee at 4.25% becomes a Nabil Bank corporate loan at 6.9%, then a small-cooperative loan at perhaps 12–14%, then an MFI loan in Karnali at 15% and up. Each step adds a margin. Each step also adds a borrower the system has decided is riskier.
The 6.3% credit growth headline obscures this. It's an average across a system where the marginal rupee finds the floor of the ladder cheap and easy to borrow against, and finds the top of the ladder hard to reach at all.
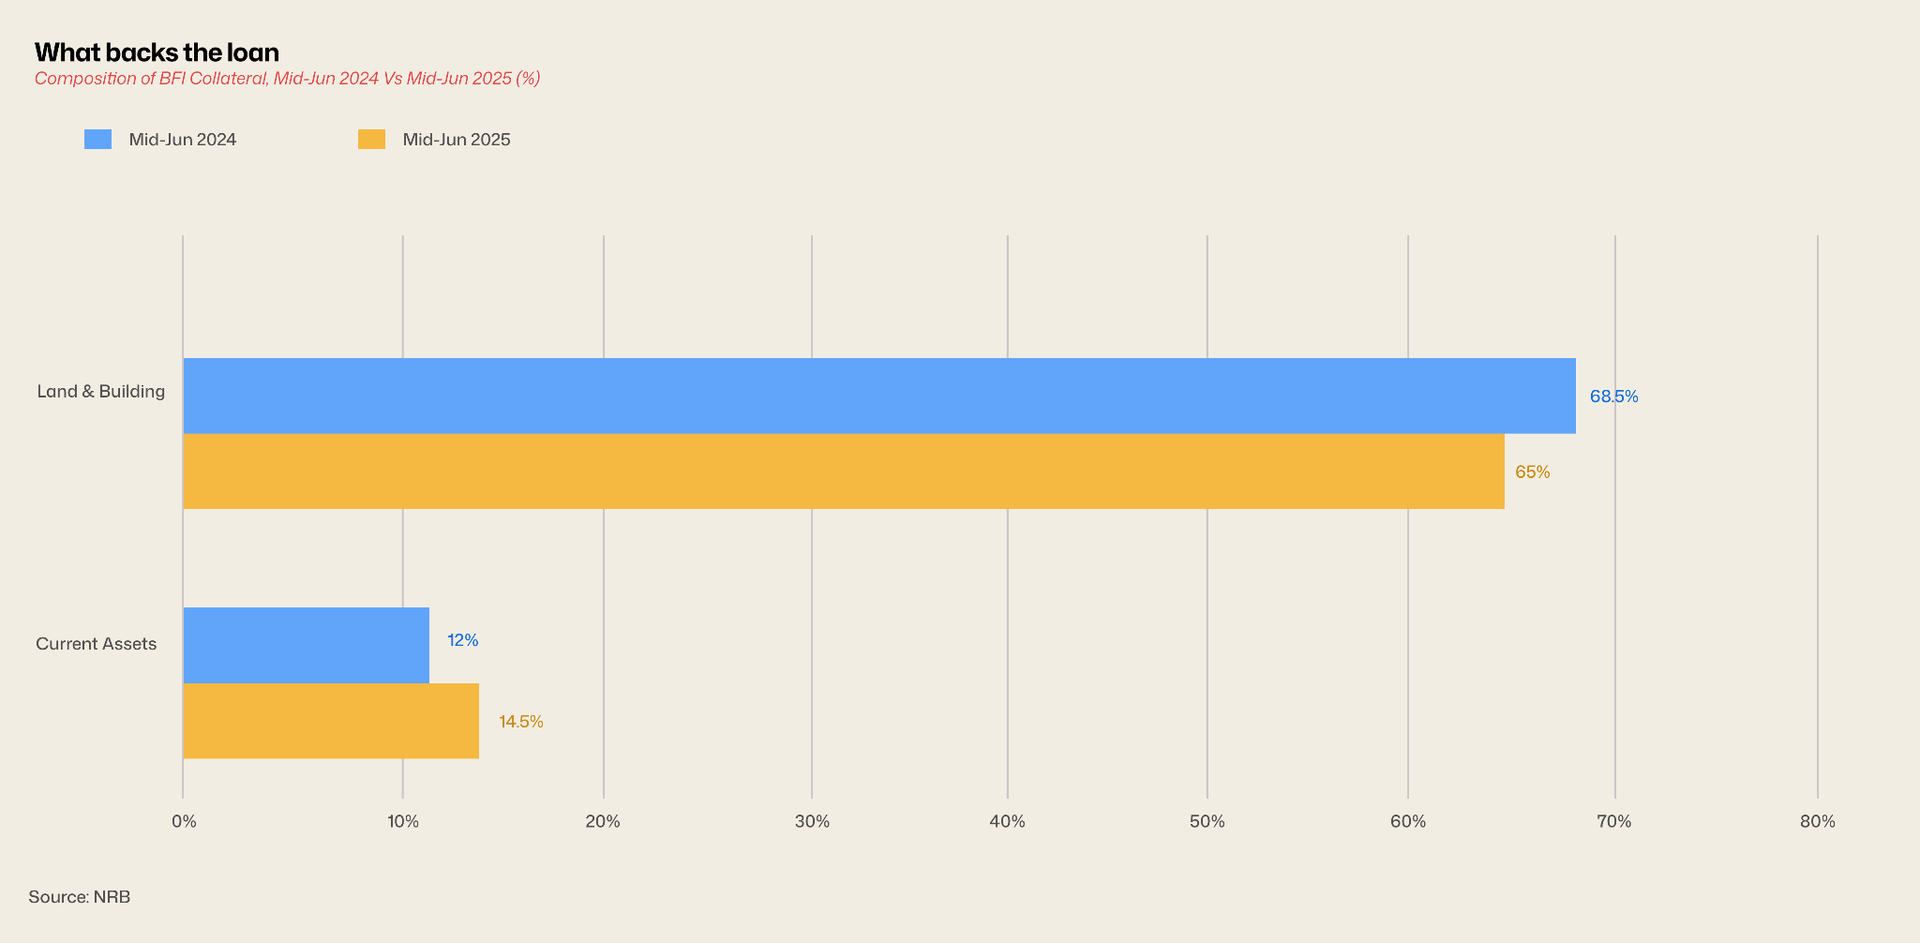
The collateral mix is shifting slowly, but in a direction worth flagging. A year ago, 68.5% of all outstanding BFI credit in Nepal was secured against land and buildings. Today the figure is 65.0%. Current asset collateral, agricultural and non-agricultural inventories, receivables, working-capital-style collateral that ties to active business operations grew from 12.0% to 14.5%.
The 3.5-percentage-point drop in real estate collateralization sounds modest. It isn't. In a banking system where two-thirds of all loans are tied to a single asset class, Nepali land even small shifts in that ratio matter for systemic resilience. A 10% correction in Kathmandu real estate would, under the old mix, have implicated 68.5% of the loan book. Under the new mix it implicates 65%. Marginally less concentrated. Still very concentrated.
This is one of the few directional shifts in the data that points the right way.
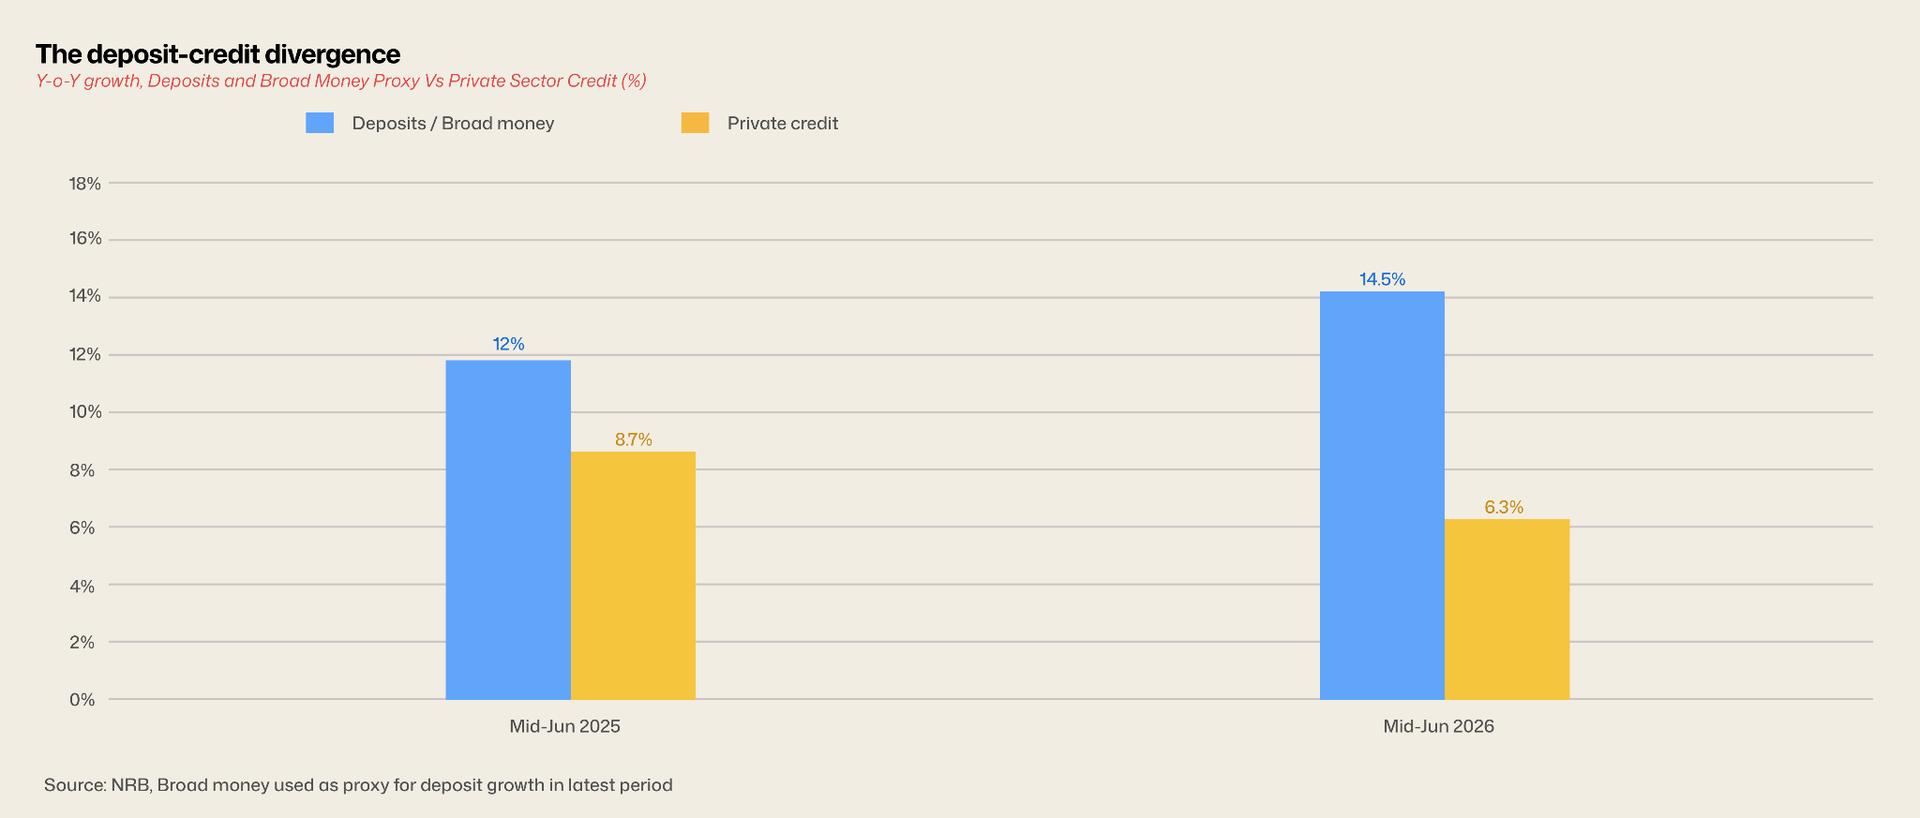
The most quietly important number in NRB's recent statistics is the gap between deposit growth and credit growth. In mid-June 2025, deposits at BFIs grew 12.0% year-on-year while private sector credit grew 8.7%, a 3.3-percentage-point gap. By mid-March 2026, broad money growth had widened to 14.5% while credit growth fell to 6.3%. The spreads more than doubled in nine months.
Banks are taking in money faster than they can or will lend it out.
This is what the previous charts add up to. Deposits compound. Banks pay 3.45% to attract them. They need to deploy them at margins above that to make money. The deployment options that show growth trust receipts, margin loans are limited in scale by import volumes and equity market activity. The deployment options that have scale agriculture, microfinance, and SMEs are shrinking. The remaining capacity gets parked at the interbank market for 2.69%, sits in NRB facilities, or accumulates as foreign assets.
A banking system with a structural deposit surplus is a banking system being told something by its economy. Either the productive demand isn't there, or the banks have decided the demand that exists isn't worth the underwriting effort. Both readings are concerning. They mean different things for policy.
What could break this read
NRB sectoral credit data is reported on a fiscal-year basis with a publication lag of roughly two months. Composition figures here are mid-Jun 2025; the eighth-month FY 25/26 figure is from mid-Mar 2026 and is provisional, subject to revision. Cooperative-sector lending estimated by some at 14–18% of total formal credit sits largely outside the BFI dataset and could reweigh the redistribution conclusion if included. Microfinance NPL data is reported separately and is not reflected in the 10% contraction figure. Broad money is used as a proxy for deposit growth in the latest period; the two metrics are related but not identical.