Why a “Breakout” on NEPSE Isn’t the Same as on NSE
Technical analysis signals like breakouts, RSI, and MACD are widely used by Nepali retail investors, but the structural realities of NEPSE-low free float, broker concentration, absence of derivatives, and circuit limits-distort these signals.

A "breakout" on NEPSE is not a "breakout" on NSE. The same candlestick, the same volume bar, the same RSI reading carry different information in a market where 51% of every stock is locked, twenty-five brokers handle most of the volume, and there are no derivatives to discipline price discovery. This piece walks the chain.
Over the past years, technical-analysis content on Nepali financial WhatsApp groups, YouTube channels, and broker websites has surged. Stock-specific "breakout alerts" using RSI, MACD, moving average crossovers, and Fibonacci retracements are routinely shared with confident calls. Platforms like NEPSE Alpha, Sharehub, and ShareSansar publish technical signal dashboards. Retail investors increasingly enter and exit positions based on these signals. The implicit assumption: NEPSE charts behave like the charts in any other equity market, and the same patterns produce the same outcomes.
The reasoning is fair. Technical analysis is a globally established discipline. RSI was published in 1978. The MACD predates that. Candlestick patterns date to eighteenth-century Japanese rice markets. The argument runs: chart patterns reflect collective trader psychology, and human psychology is the same in Kathmandu as it is in Mumbai or New York. A stock that has tested a resistance level three times and broken through on volume should behave the same way on NEPSE as it does on NSE, fear of missing out drives the breakout, late buyers chase, the price moves higher.
The case is plausible. It is also wrong, because the conclusion depends on a hidden premise that the market in which the chart is drawn is structurally similar to the markets in which technical analysis was developed and validated. NEPSE is not.
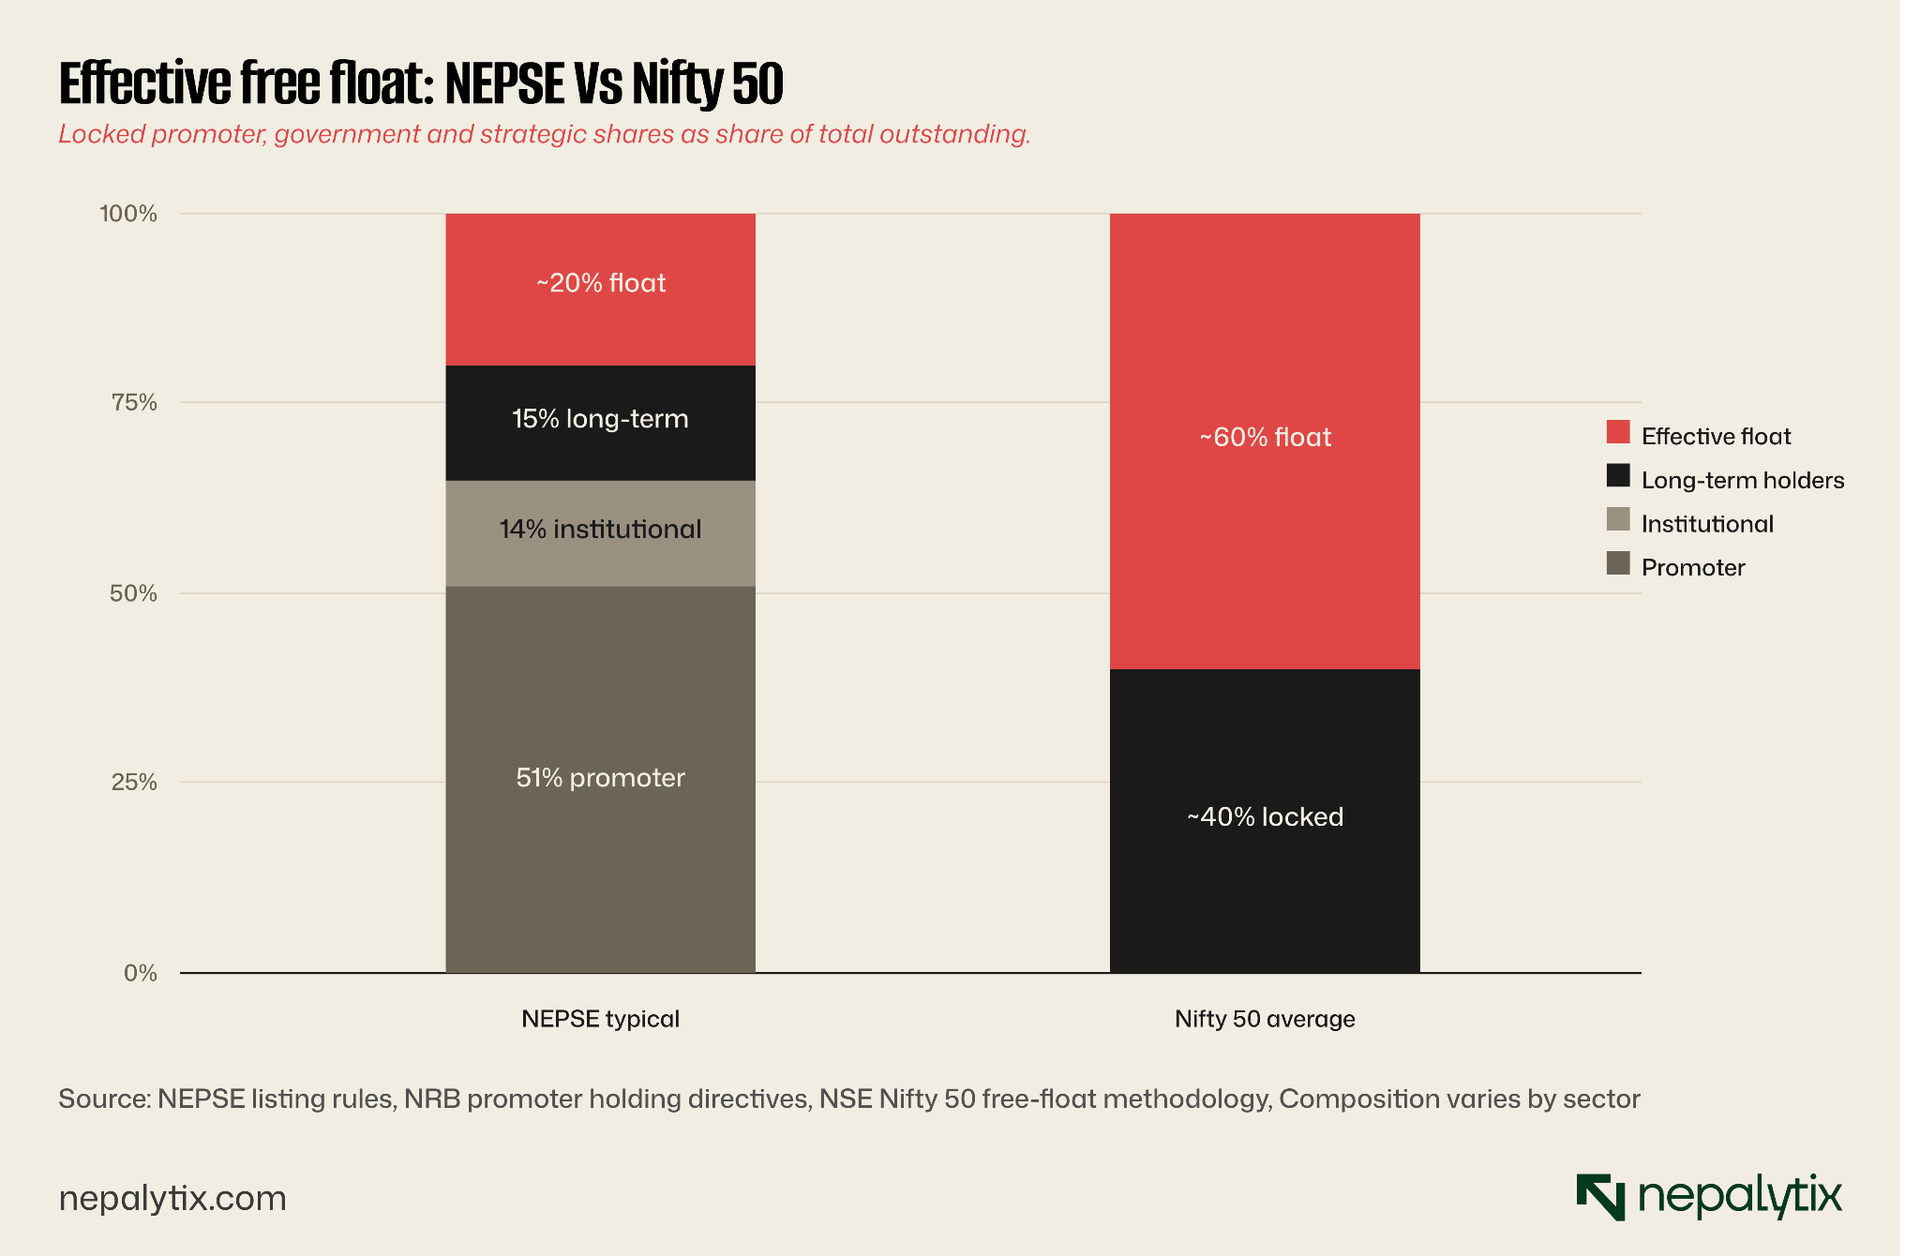
Free float on most NEPSE stocks is structurally below 49%
Nepali commercial banks must hold minimum 51% promoter shares by regulation. Most listed companies follow the same convention. Promoter shares are locked at IPO and rarely traded, they exist on the share register, not in the market. The actual tradeable float on a typical NEPSE stock is the 49% public portion minus institutional holdings, mutual funds, employee shares, and long-term retail. Effective free float on many stocks sits between 15% and 30% of total shares outstanding. On NSE, by comparison, the average free float across the Nifty 50 is approximately 60%. NEPSE is not a low-float exception. Low float is the structural norm.
Low float means small flows move prices disproportionately
Price impact is a function of order size relative to available float. On a stock with 20% effective float, a buy order representing 1% of outstanding shares is 5% of the available float. The same order on a 60% float stock is 1.7% of available float. NEPSE moves on retail flows that, in absolute rupee terms, would be invisible on NSE. A buy cluster from a single broker on a low-float stock can move the price 5% in one session. The "breakout" the chart shows is real. The reason it happened that one investor with a Rs 5 crore position decided to enter is not visible on the chart. The chart shows the symptoms. The cause is below the chart.
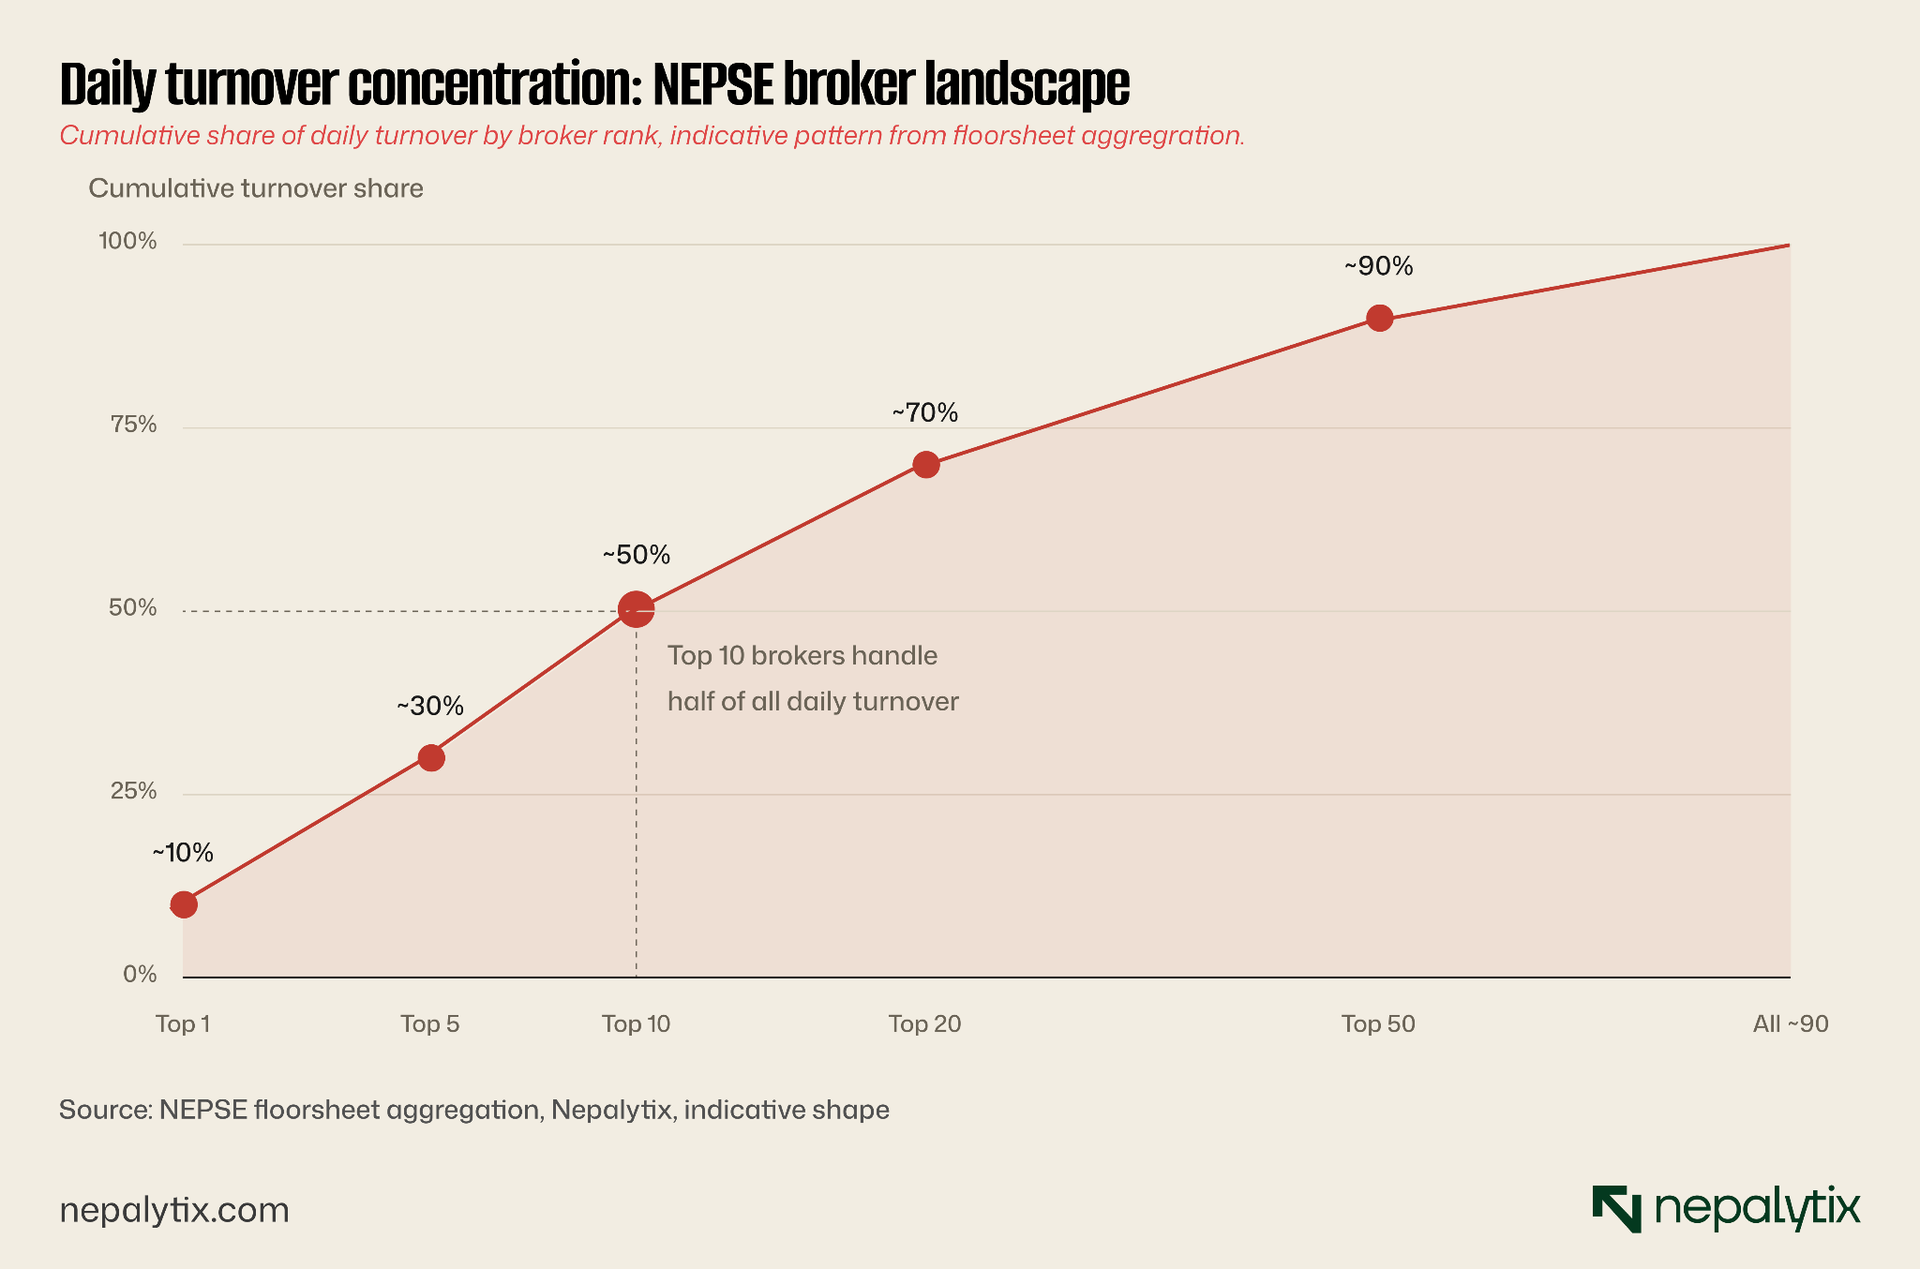
Broker concentration creates coordinated patterns that look like price discovery
NEPSE has roughly 90 licensed brokers. The top ten regularly handle a disproportionate share of daily turnover, often more than half. When a small number of brokers cluster around the same stock, the chart pattern that emerges, increasing volume on a price advance, breakout above resistance can be the visible trace of broker coordination rather than a market-wide shift in opinion. In a wide market with thousands of independent participants, a breakout aggregates many independent decisions. In NEPSE, the same pattern can emerge from coordinated activity by three or four brokers. The pattern looks identical on the chart. The information content is different.
No derivatives means there is no instrument to discipline a wrong price
On NSE, NASDAQ, or any deep equity market, a stock that is mispriced upward attracts short sellers. They borrow stock, sell it, and profit if the price falls back. The mechanism is uncomfortable for the seller but essential for the market, it forces overpriced stocks back toward fair value, which is what makes chart-pattern signals more reliable. NEPSE has no short selling. There are no equity options. There are no equity futures. A stock that has run up beyond fundamental value can stay there indefinitely, because no one can profit from disagreeing. The "breakout" the chart shows can persist for weeks or months at a price that has no fundamental support, because there is no instrument to push it back.
Circuit breakers truncate the patterns the indicators are calibrated against
NEPSE imposes a daily price band of approximately ±10% on individual stocks. Once a stock hits the upper or lower circuit, trading effectively halts in that direction for the day. This sounds like a stability mechanism. From a charting perspective, it is a signal-distorter. A stock that wants to move 18% in one day on legitimate news cannot do so; it hits the circuit, trades sideways for the rest of the session, and continues the move the next day. The candlestick pattern that results is not a real candlestick, it is a truncated artefact of the circuit rule. Indicators like RSI calibrated on the assumption of free-running price action are reading data that has been mechanically filtered. The signal is weaker than the chart suggests.
Combine all five and the chart is no longer a clean read of supply and demand
Each structural condition on its own would degrade chart reliability. The five compounds. A breakout above resistance, on rising volume, with bullish RSI divergence, the textbook setup that has fifty years of empirical validation in deep equity markets has a different probabilistic outcome on NEPSE. Sometimes it works. Often the move was driven by a small cluster of brokers operating on illiquid float, with no short-selling counterforce, against indicators reading circuit-truncated data. Whether the trade works has less to do with the pattern and more to do with the structural conditions that produced it. The chart is the surface. The microstructure is the substance.
The four conditions before you trust a NEPSE breakout
Don't read NEPSE charts the way books on technical analysis tell you to read charts. Read them with the structural overlay. Before treating any breakout as a high-probability signal, four conditions need to be met simultaneously. Most NEPSE breakouts fail at least two of them.
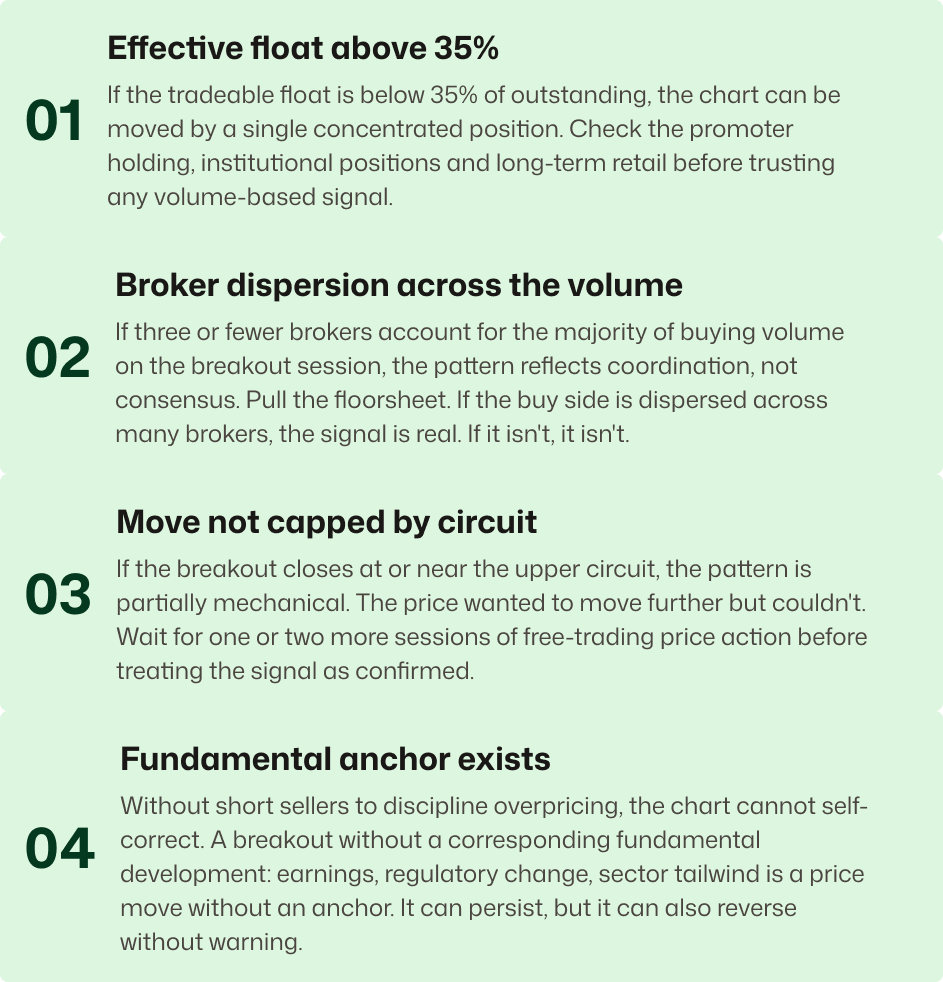
Apply the four conditions to any chart you are about to act on. If a breakout passes all four, it is one of the relatively rare NEPSE patterns that carries the same information a comparable pattern carries on NSE. If it fails one or more, the pattern is structurally weakened, possibly real, but not high-probability.