Why Nepal’s Best Mutual Funds Trade at a Discount
Twenty-nine of Nepal’s 33 measurable closed-end funds trade below NAV. The deeper the NAV rises above the Rs 10 issue price, the wider the market discount becomes.

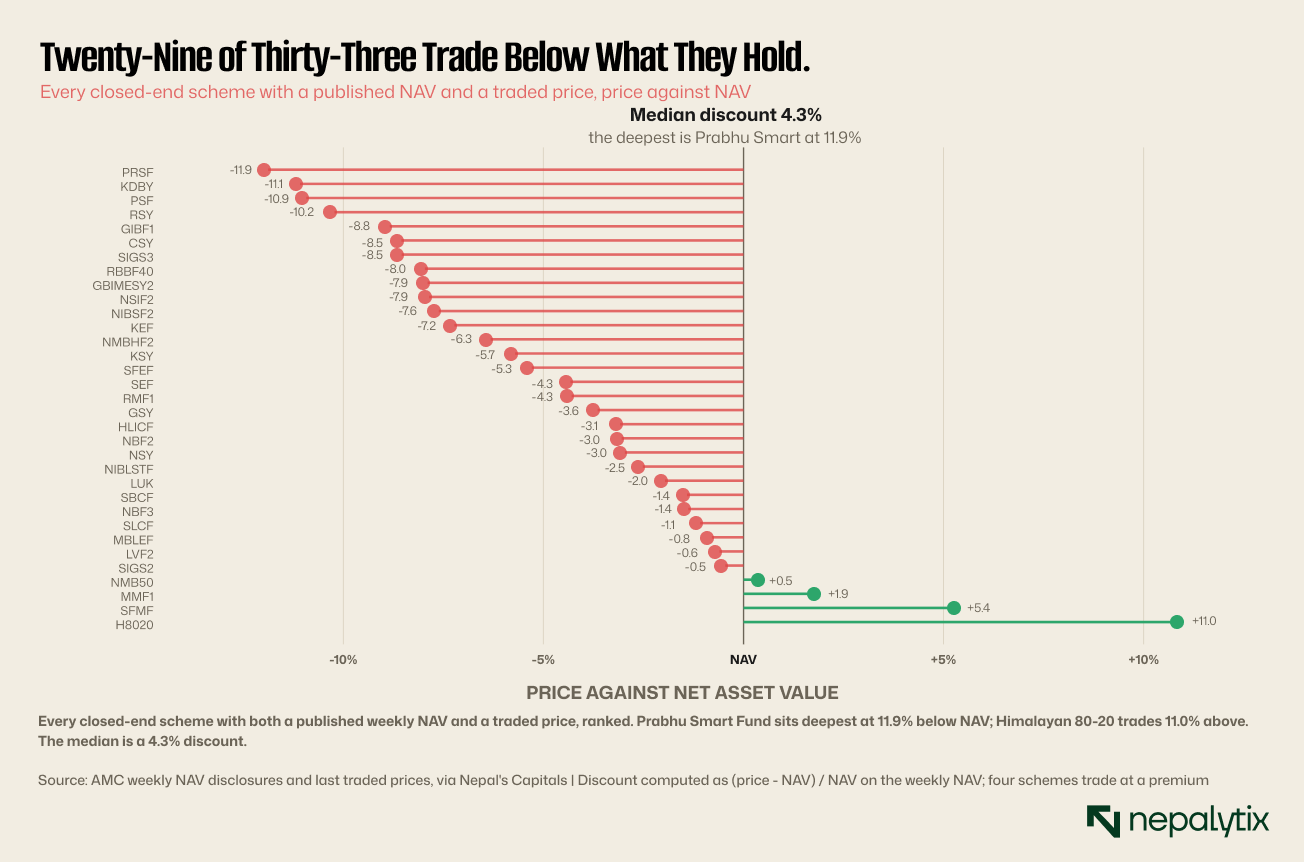
Twenty-nine of Nepal's thirty-three measurable closed-end funds trade below what they hold. What sets the size of the discount is not maturity and not fund size. It is how far the fund's net asset value has risen above the Rs 10 it was issued at.
THE SIGNAL
Twenty-nine of Nepal's thirty-three measurable closed-end funds trade below the value of what they hold. That much is normal closed-end funds trade at discounts everywhere.
What is not normal is what predicts the size of the discount. It is not time to maturity which should drive it and barely does. It is not fund size which does nothing at all. It is the level of the net asset value itself: the further a fund's NAV has risen above the Rs 10 it was issued at, the harder the market marks it down. The correlation is -0.52 against -0.20 for maturity and -0.01 for size. Nepali investors are anchored to par and the funds that have compounded best are the ones penalised hardest for it.
A discount is not a mispricing and then sometimes it is
A closed-end fund issues a fixed number of units, lists them and does not redeem them. If you want out before maturity you sell to another investor at whatever the market will pay which is generally less than the fund's assets are worth per unit. Open-end funds work the other way: units are created and redeemed continuously at NAV so no discount can open.
Discounts on closed-end funds are universal and mostly rational. You are buying an asset you cannot liquidate at will managed by someone charging a fee in a wrapper with a fixed exit date. Some discount compensates for all three.
The question is not whether a discount should exist. It is what determines how big it is and in Nepal the answer turns out to be something nobody has written down.
Two structural features of the Nepali market make this worth measuring rather than assuming. The first is that closed-end schemes dominate: of 58 registered schemes, most are closed-end with fixed maturities running five to twelve years. In markets where open-end funds dominate, the discount question barely arises. Here it applies to the majority of the industry.
The second is the par value. Nepali fund units are issued at Rs 10 which is a small number in absolute terms and an unusually salient one. A share issued at Rs 100 that trades at Rs 366 does not strike anyone as expensive because the par value has long since stopped being a reference point. A fund unit issued at Rs 10 that trades at Rs 12.61 is a different psychological proposition and this piece argues that the difference shows up in the price.
The whole market, measured
Nepal has 58 mutual fund schemes across 19 asset managers. Of the closed-end ones, 33 have both a current weekly NAV and a recent traded price and those 33 hold about Rs 36 billion. Eleven more are excluded and it is worth saying why: NIC Asia's six schemes publish no weekly NAV; three others publish a monthly NAV but no weekly; four have a NAV but no recent trade.
That last category is a finding in itself. NIBL Growth Fund, RBB Mutual Fund-2, Sanima Growth Fund and Siddhartha Equity Fund-2 are listed securities that did not print a price. A closed-end fund that does not trade offers its holders neither the redemption of an open-end fund nor the liquidity of a listed one.
Across the 33 that do trade, the spread runs from an 11.9% discount to an 11.0% premium. That is a range of nearly 23 percentage points on instruments that are, structurally, the same product.
One more thing about the excluded schemes, because it bears on how seriously to take any Nepali fund discount. The set of 33 is not a sample drawn from 44, it is everything that could be measured. Eleven schemes are invisible on this question because their manager does not publish a weekly NAV or because nobody traded them. A market in which a quarter of the closed-end universe cannot be priced against its own assets is one where the discount is doing less work as a signal than it would elsewhere.
The explanation everyone gives
Ask why a Nepali closed-end fund trades below NAV and you will be told about maturity. The logic is sound: at maturity the fund liquidates and pays out NAV, so the discount must be zero on that date. A fund with one year left cannot rationally trade 10% below NAV because the holder need only wait twelve months to collect the difference.
So discount should scale with time remaining. Here is that relationship.
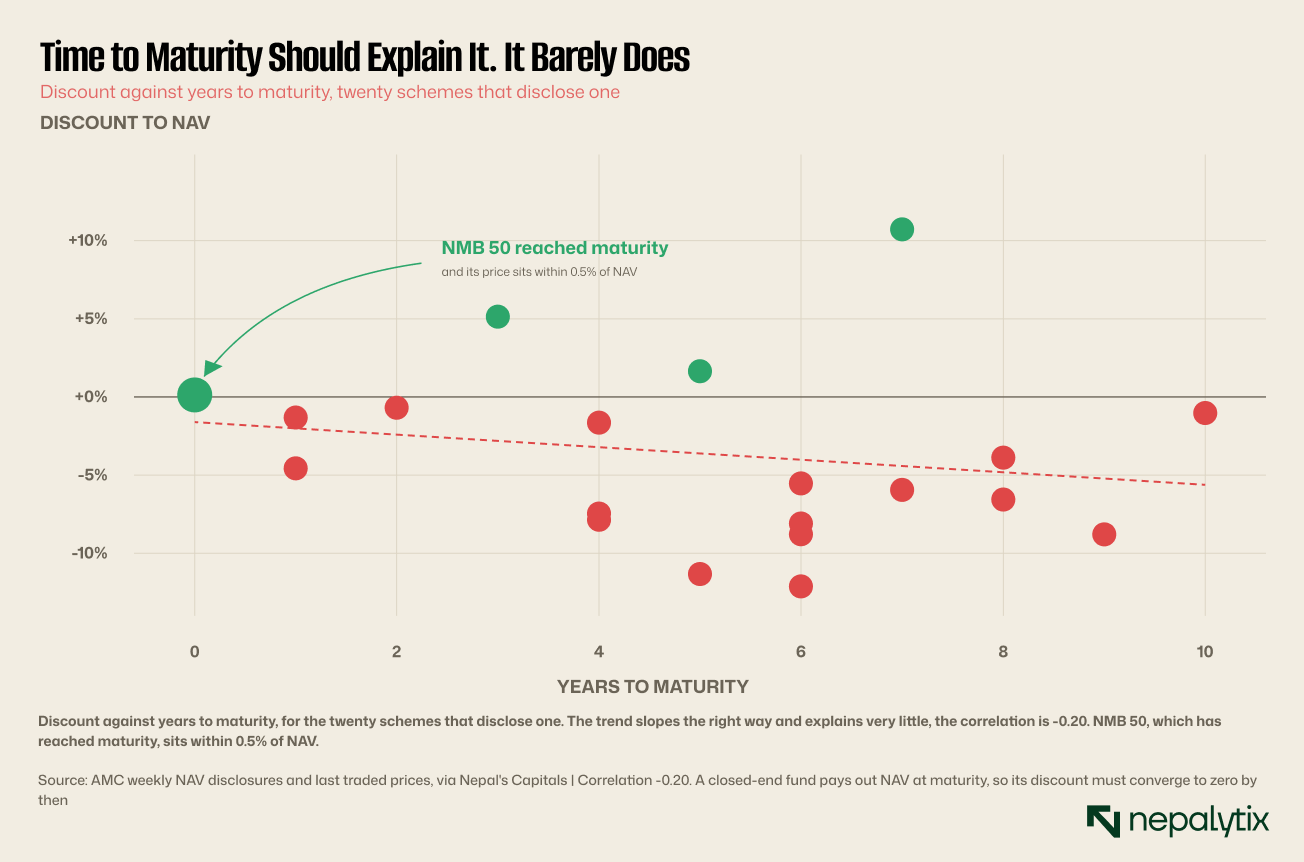
The relationship exists and it is weak. Correlation -0.20, which on twenty observations is barely distinguishable from noise. The convergence at the far left is real, NMB 50 has matured and trades essentially at NAV, and Sanima Large Cap and Siddhartha Growth-2 with one and two years left sit at 1.1% and 0.5% discounts. But look at the scatter everywhere else. Kumari Dhanabriddhi has five years remaining and trades 11.1% below NAV. Mega Mutual Fund-1 also has five years remaining and trades 1.9% above.
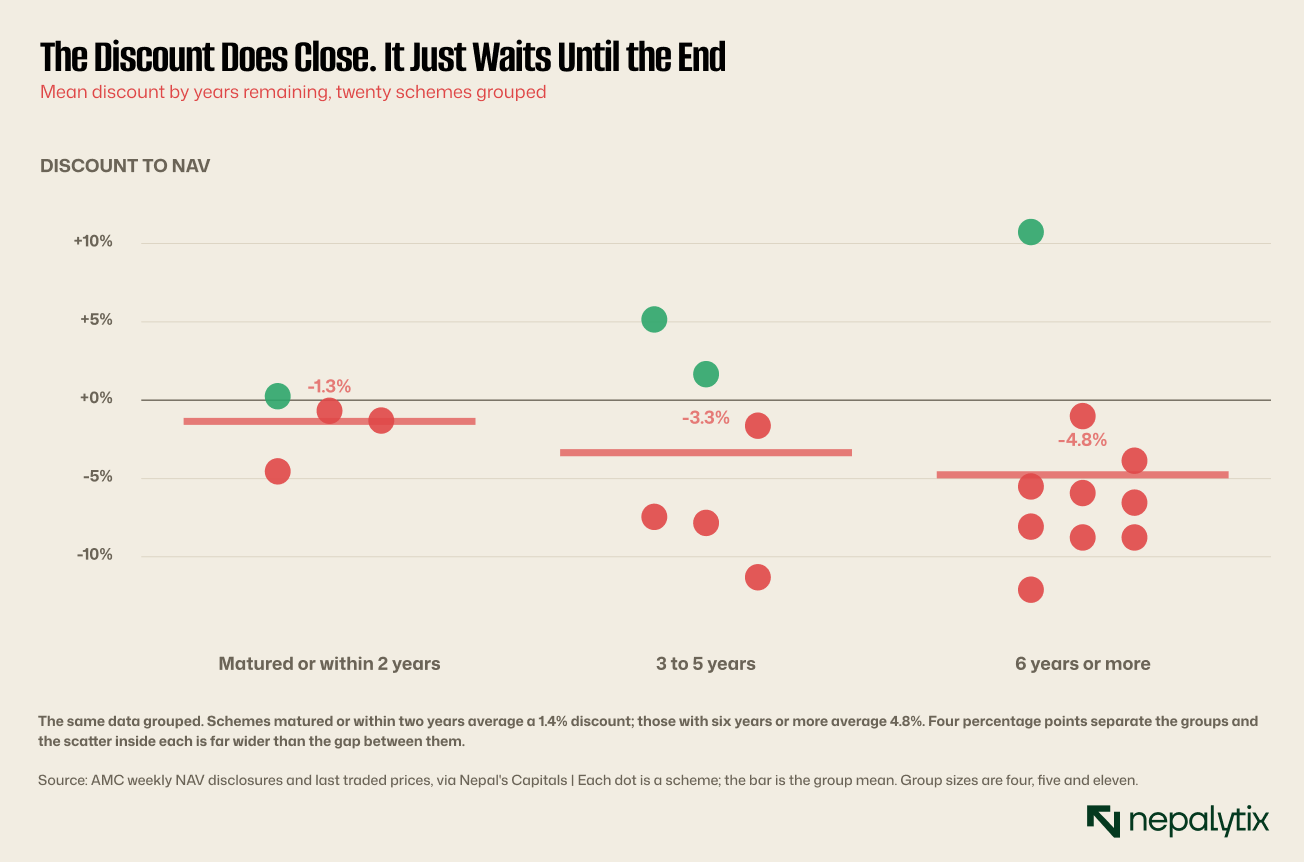
So maturity does something. It is simply not the thing doing most of the work.
It is worth being precise about why the weak result is surprising rather than merely disappointing. Maturity convergence is not a theory about investor behaviour. It is an arithmetic certainty: on the maturity date the fund sells its holdings and distributes NAV so anyone holding units bought at a discount collects the gap. A 10% discount on a fund with two years left is a 5% annual return available to anyone willing to wait before any change in the underlying portfolio.
In a market that priced this properly, discounts would form a clean downward slope as maturity approached and the funds nearest their end dates would cluster tightly near zero. Nepal produces a faint version of that shape and an enormous amount of noise around it. Which means the arithmetic is being outvoted by something.
The explanation that holds
Every Nepali mutual fund unit is issued at a par value of Rs 10. Not Rs 100 like a share Rs 10. That number is printed on the offer, it is what every investor paid and it is the reference point every retail holder in the country carries around.
Now sort the funds by how far their NAV has risen above it.
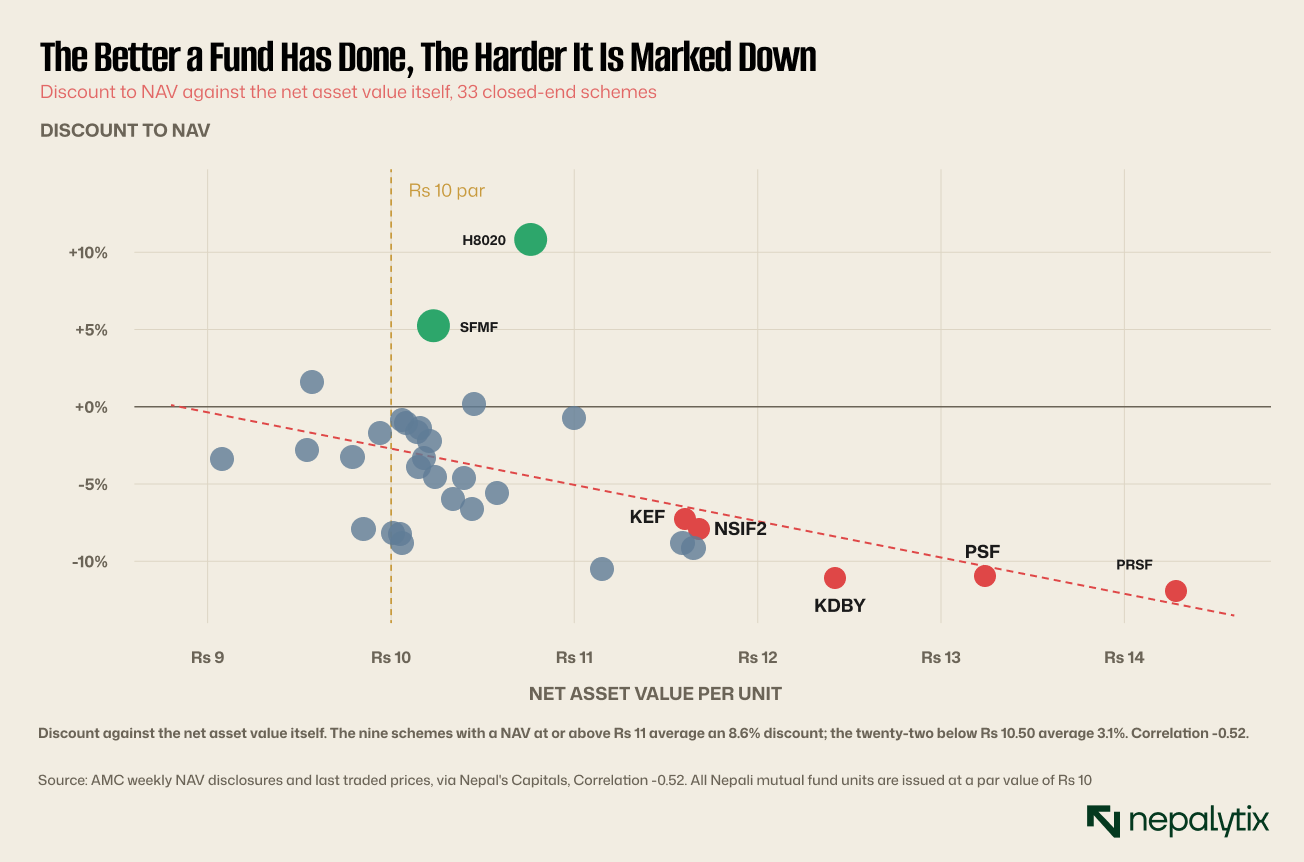
Prabhu Smart Fund has the highest NAV in the Nepali market at Rs 14.31, it has returned 43% on the par value its investors paid and it carries the deepest discount, 11.9%. Prabhu Select Fund at Rs 13.27 is second deepest. Kumari Dhanabriddhi at Rs 12.45 is third. Meanwhile Laxmi Value Fund-II at Rs 10.06, Nabil Balanced Fund-3 at Rs 10.14 and MBL Equity Fund at Rs 10.08 all trade within 1.4% of NAV.
The mechanism is not mysterious. A buyer who paid Rs 10 for units, or who is used to seeing funds issued at Rs 10, has a strong intuition about what a fund unit is worth. Asked to pay Rs 14 for one, that intuition resists regardless of the fact that the fund genuinely holds Rs 14.31 of assets per unit. The price sticks below where the arithmetic says it should be and the gap widens as the NAV climbs further from the anchor.
This is textbook anchoring and it produces a perverse result: the discount is largest on the funds that have done best for their holders. A manager who compounds successfully is rewarded with a wider gap between what the fund is worth and what the market will pay for it.
There is a second-order effect worth naming. If the anchor explanation is right, then a fund's discount should widen over its life purely as a function of doing well. A scheme launched at Rs 10 that compounds at 8% a year reaches Rs 14.69 in five years, and on the relationship in Figure 4 that alone predicts a discount somewhere around nine or ten per cent with no change in the manager, the strategy, the fee or the maturity.
That is a strange property for a market to have. It means an investor buying at launch and holding to maturity is fine, since the discount closes at the end. But an investor who needs to sell in year six is penalised precisely in proportion to how well the fund performed for them, and the better the manager the worse the penalty.
What size does which is nothing
Before accepting that, the obvious alternative should be ruled out. Perhaps the discount tracks liquidity and liquidity tracks fund size.
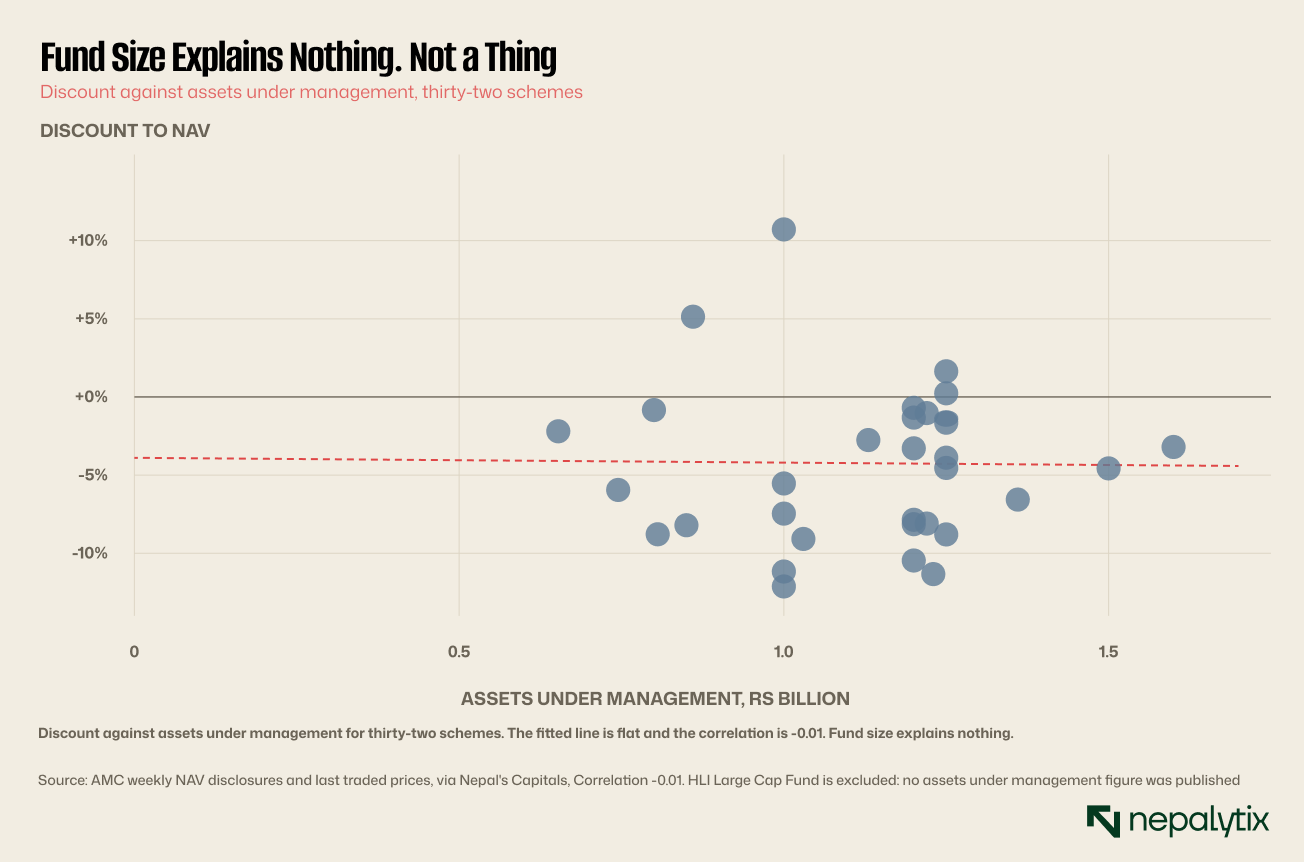
It does not. Correlation -0.01 which is to say none. Rs 1.5 billion funds and Rs 650 million funds sit at the same discounts. Whatever is setting the price, scale is not a part of it.
The alternative reading that the market is efficiently pricing something correlated with NAV that this piece has not measured deserves a fair hearing. High-NAV funds are older so they have less time left in some cases and they may hold more embedded unrealised gains that would attract tax on realisation. Both would justify a wider discount on grounds that have nothing to do with anchoring.
The age argument runs the wrong way: less time remaining should narrow the discount not widen it and Figure 2 shows exactly that direction. The unrealised-gains argument is real and unmeasurable from public data, since schemes do not disclose cost basis. It is the strongest objection to the reading in this piece and it cannot be settled here.
Managers are marked differently and it is mostly the NAV again
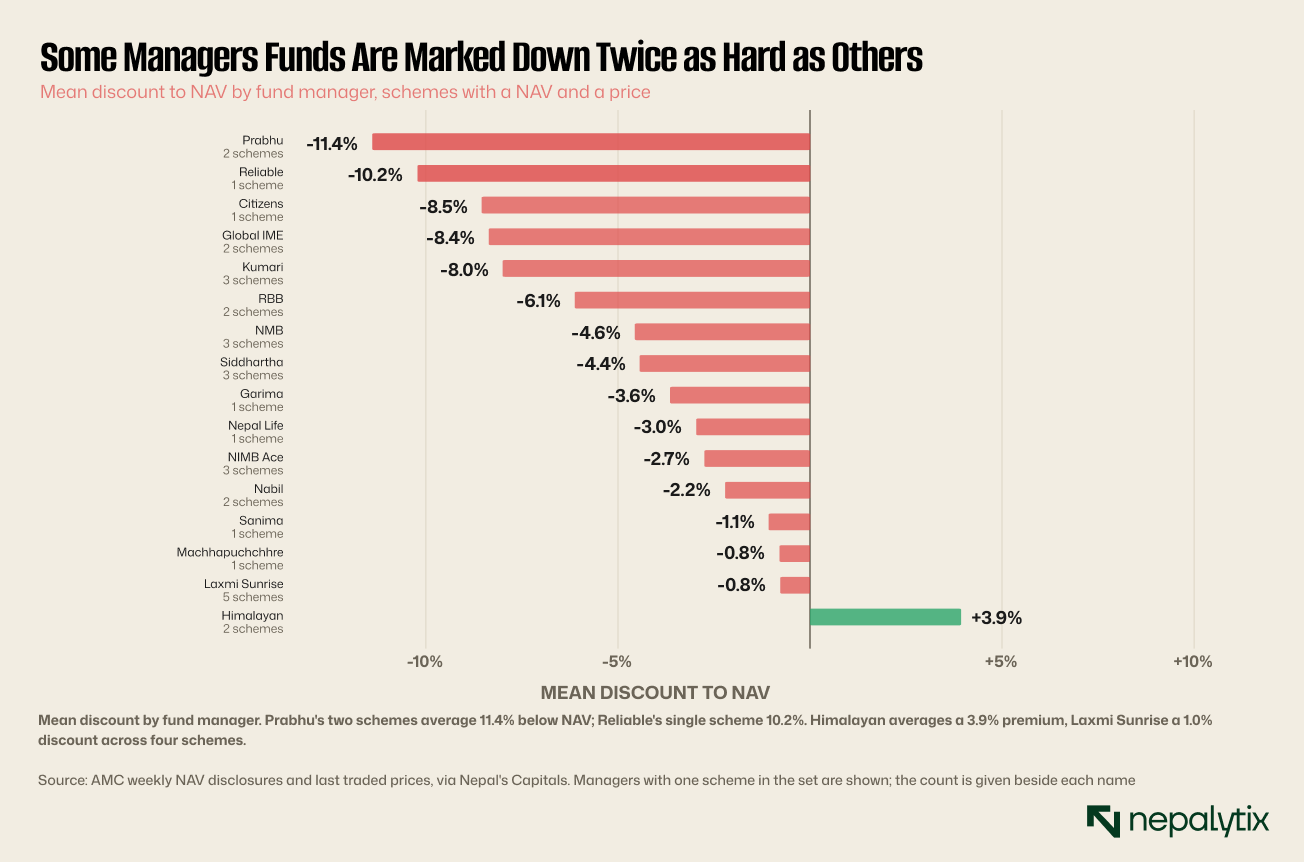
There is a real spread across managers from Prabhu at an 11.4% average discount to Himalayan at a 3.9% average premium. It is tempting to read this as the market's verdict on manager quality, and it is almost the opposite.
Prabhu's two schemes carry the two highest NAVs in the market. Reliable's single scheme has a NAV of Rs 11.15. Laxmi Sunrise which looks best on this chart, runs four schemes whose NAVs sit between Rs 9.94 and Rs 10.58 clustered around par. The manager ranking is substantially the NAV ranking wearing a different label.
Which means a reader should be careful about the obvious inference. Prabhu's funds are not distrusted. They are expensive in absolute rupees, and the market discounts absolute rupees.
Where the funds put the money
One dimension this piece has deliberately left out, and should name. Nothing above concerns what the funds actually hold. Nepali mutual funds are concentrated in the same places the market is commercial banks, non-life insurance, microfinance, hydropower and their portfolios overlap heavily with each other.
That matters for the anchoring argument in a specific way. If every fund held a materially different portfolio, a spread of discounts might reflect the market's differing views on those portfolios. Since the portfolios are broadly similar, that explanation is weaker and the residual has to come from somewhere else. It is a supporting argument rather than a proof, but it points the same way as the correlations.
It also means a reader treating these funds as diversification should check the holdings first. A basket of Nepali closed-end funds is, in large part, a leveraged position in Nepali commercial banks with a management fee attached.
A last point on the manager spread because it has a practical edge. If two managers run schemes with similar strategies and similar holdings and one trades at a 11% discount while the other trades at a premium, the arbitrage is not available, you cannot short a Nepali mutual fund or redeem it against NAV. The discount is a fact you can buy into not one you can trade against. That asymmetry is part of why it persists.
What to check before buying a discount
Three things and the first is about the data rather than the funds.
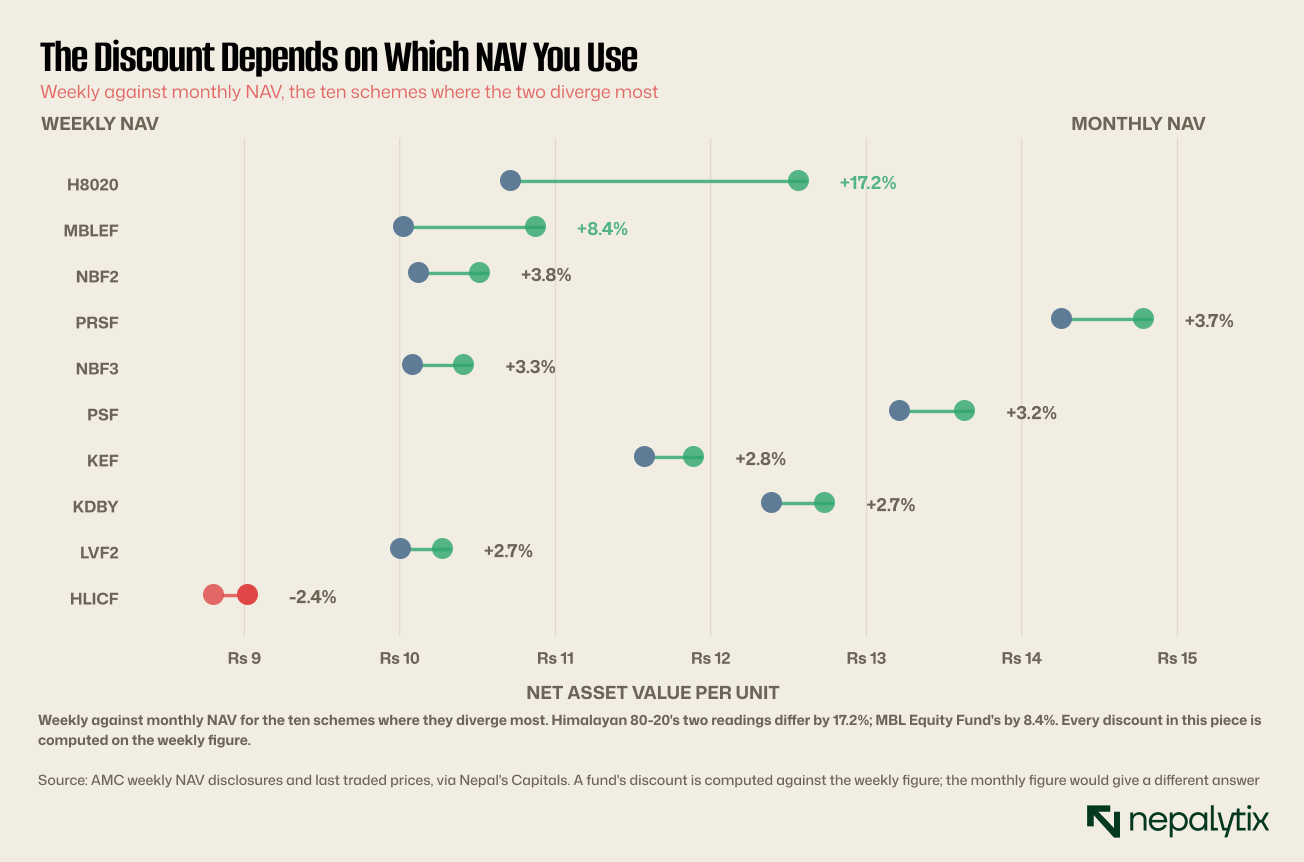
Check which NAV the discount was computed against. Himalayan 80-20 appears in Figure 1 as the market's largest premium at 11.0%. That is true against its weekly NAV of Rs 10.77. Against its monthly NAV of Rs 12.62 it trades at a 5.3% discount. The same security is either the most expensive fund in Nepal or a cheap one depending on which of two published figures you use and both come from the same manager.
MBL Equity Fund has the same problem at 8.4%. For most schemes the two readings sit within three per cent of each other and it does not matter. For these, it decides the answer.
Check the maturity date, because it is the only thing that forces convergence. A discount on a fund with nine years to run may persist for nine years. A discount on a fund with one year to run is a dated claim. NMB 50 is the demonstration: matured and priced within 0.5% of NAV.
Check whether it trades at all. Four listed closed-end schemes did not print a price. A discount you cannot buy into is not an opportunity and more importantly, a fund you cannot sell out of has an exit only at maturity.
And the conclusion that follows from the whole exercise: if the discount is set mainly by distance from the Rs 10 anchor rather than by anything about the fund then the deepest discounts sit on the best-performing funds and buying the deepest discount is closer to buying the best manager than to buying a bargain. That is either the most reliable inefficiency in the Nepali market or a very good reason to check the NAV twice.
One practical note on acting on any of this. A discount is only collectable if you hold to maturity or if the discount narrows while you own the units. The first is a defined outcome with a known date. The second is a bet that the market's anchor loosens which is a bet on a change in how thousands of retail investors think about a Rs 10 note and that is not a thesis anyone should size a position around.
Which leaves the maturity trade as the only clean one available: buy a discount on a scheme whose end date is close and collect the difference on a schedule. Figure 2 shows how few schemes currently qualify.
The one number to take away
Minus 0.52. That is the correlation between a Nepali closed-end fund's net asset value and the discount the market applies to it and it is more than twice the strength of the maturity relationship that everyone cites and fifty times the size relationship that nobody has checked.
If it holds up across more than one week of prices which this piece cannot establish and says so then Nepal has a mutual fund market where the price of a unit is anchored to a Rs 10 note printed on the offer document years ago, and where the reward for good management is a wider gap between what your units are worth and what anyone will pay you for them.
Disclaimer
This report has been prepared by Nepalytix for informational and educational purposes only and does not constitute investment advice, an offer, or a solicitation to buy or sell any securities.
The information contained in this report is based on sources believed to be reliable; however, Nepalytix does not guarantee its accuracy, completeness, or timeliness. Opinions, estimates, and projections expressed herein are those of the authors as of the date of publication and are subject to change without notice.
Investing in securities involves risks, including the possible loss of principal. Past performance is not indicative of future results. Readers are advised to conduct their own independent research and consult with a qualified financial advisor before making any investment decisions.
Nepalytix and its contributors may hold positions in the securities discussed in this report at the time of publication or thereafter.
Neither Nepalytix nor any of its affiliates accept any liability for any loss arising from the use of this report or its contents.