Nepal Is Sending Fewer Workers But Receiving More Money
Nepalis abroad sent home Rs 2.36 trillion in FY2025/26 even as new labour departures fell nearly 49% from their peak. The divergence reveals a remittance economy increasingly powered by workers who are already abroad.
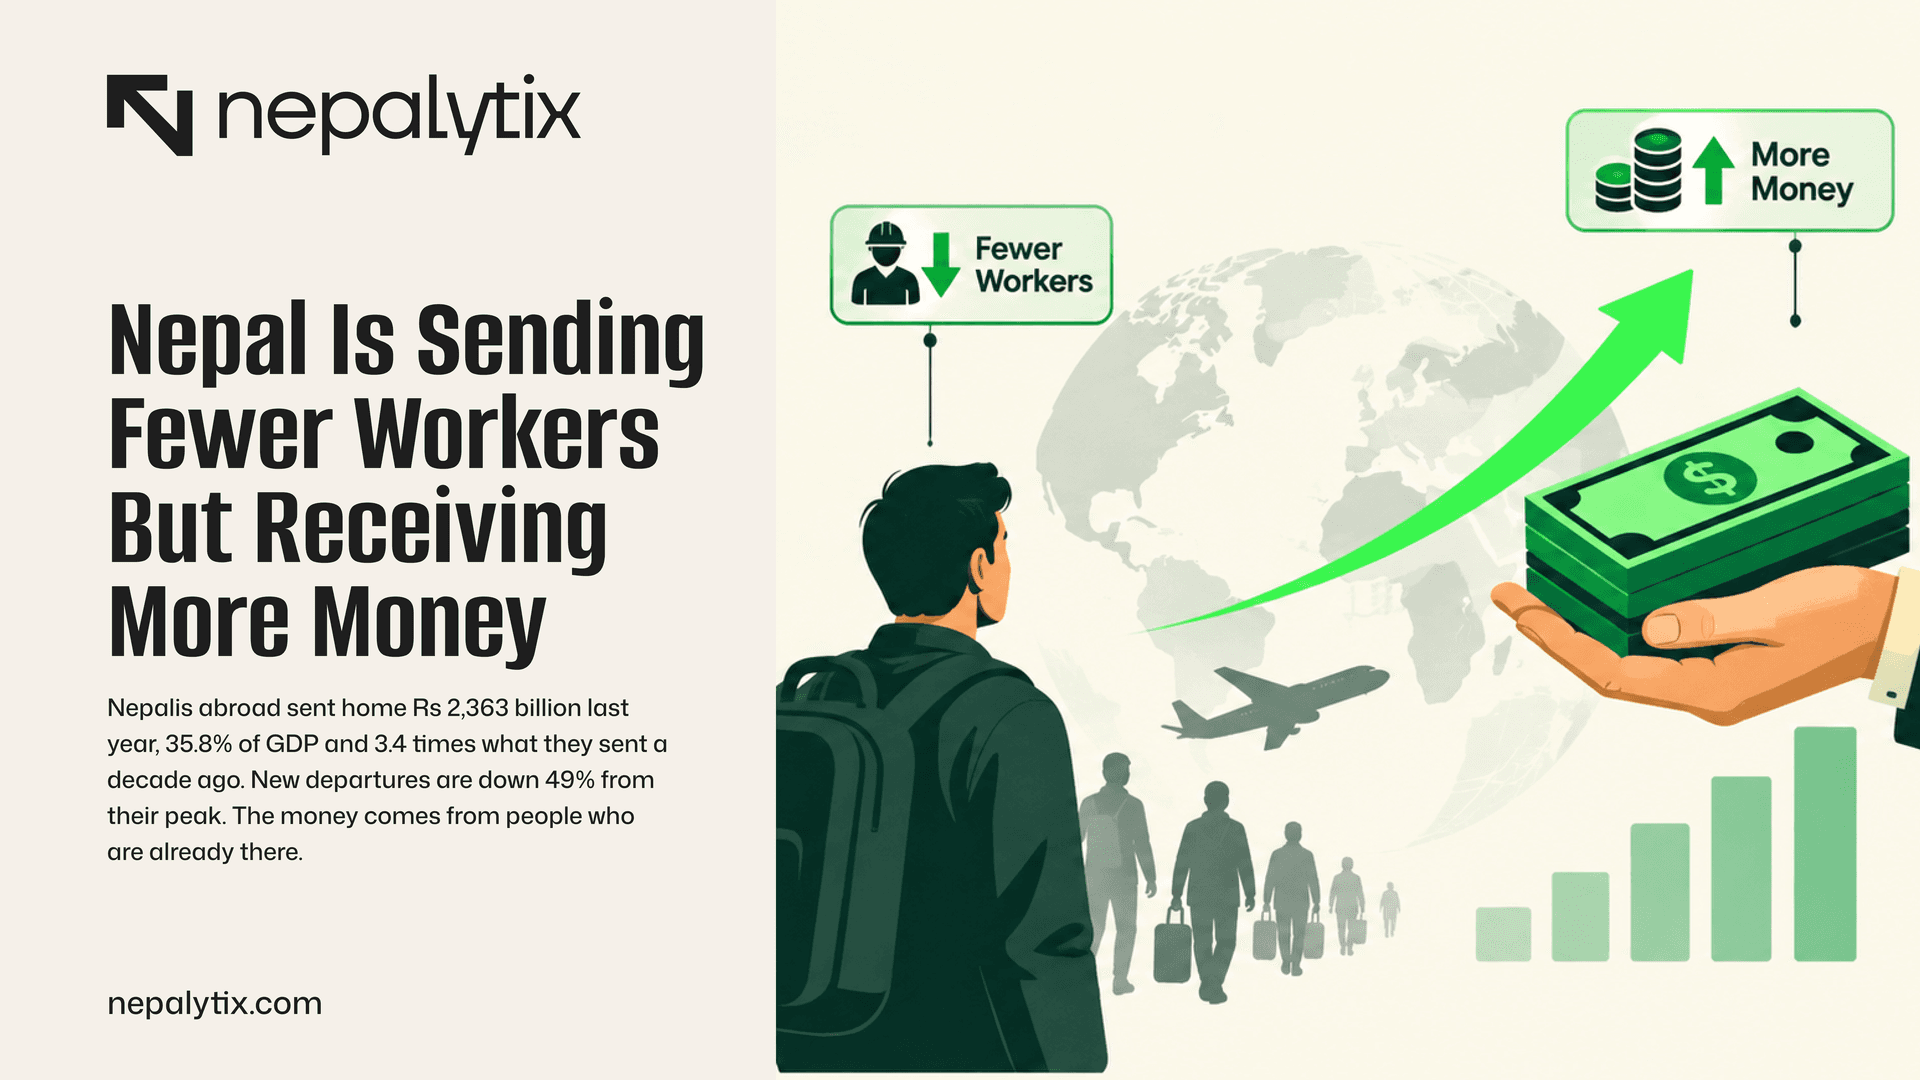
Nepalis abroad sent home Rs 2,363 billion last year, 35.8% of GDP and 3.4 times what they sent a decade ago. New departures are down 49% from their peak. The money comes from people who are already there.
In the year to mid-July 2026, Nepalis working abroad sent home Rs 2,363 billion. That is 35.8% of everything the country produced and it is 3.4 times what they sent a decade ago.
In the same year, the number of Nepalis leaving to work abroad fell for the second year running and now sits 49% below its peak.
Fewer people are going. More money is coming. That sentence describes the most important economic fact about Nepal and almost nothing published explains it.
This piece uses Nepal Rastra Bank's own workbook: 120 months of balance of payments data back to 2016/17 and 269 months of migrant worker approvals by destination back to 2072/73 covering twenty countries. It is an attempt to describe what the remittance economy actually is rather than to repeat its headline.
What this piece is doing differently
Remittances get written about in Nepal constantly and almost always the same way: a headline percentage of GDP, a warning about dependence, a call to invest the money productively. That article has been published for twenty years and the numbers in it are usually a single annual figure from a press release.
The central bank publishes far more than that and almost nobody uses it. Annex 12 of its workbook carries the balance of payments month by month back to FY2016/17. Annex 15.1 carries labour approvals month by month broken out by twenty destination countries back to FY2072/73. Together they are 389 observations.
With that much data the questions change. Not "is Nepal too dependent on remittances", which cannot be answered from a single number but: when does the money arrive where do the workers go, has that changed and does the flow track the people?
The answer to the last one turns out to be no and everything else follows from it.
A hundred and twenty months
Start with the flow itself, month by month because the shape of it is the first surprise.
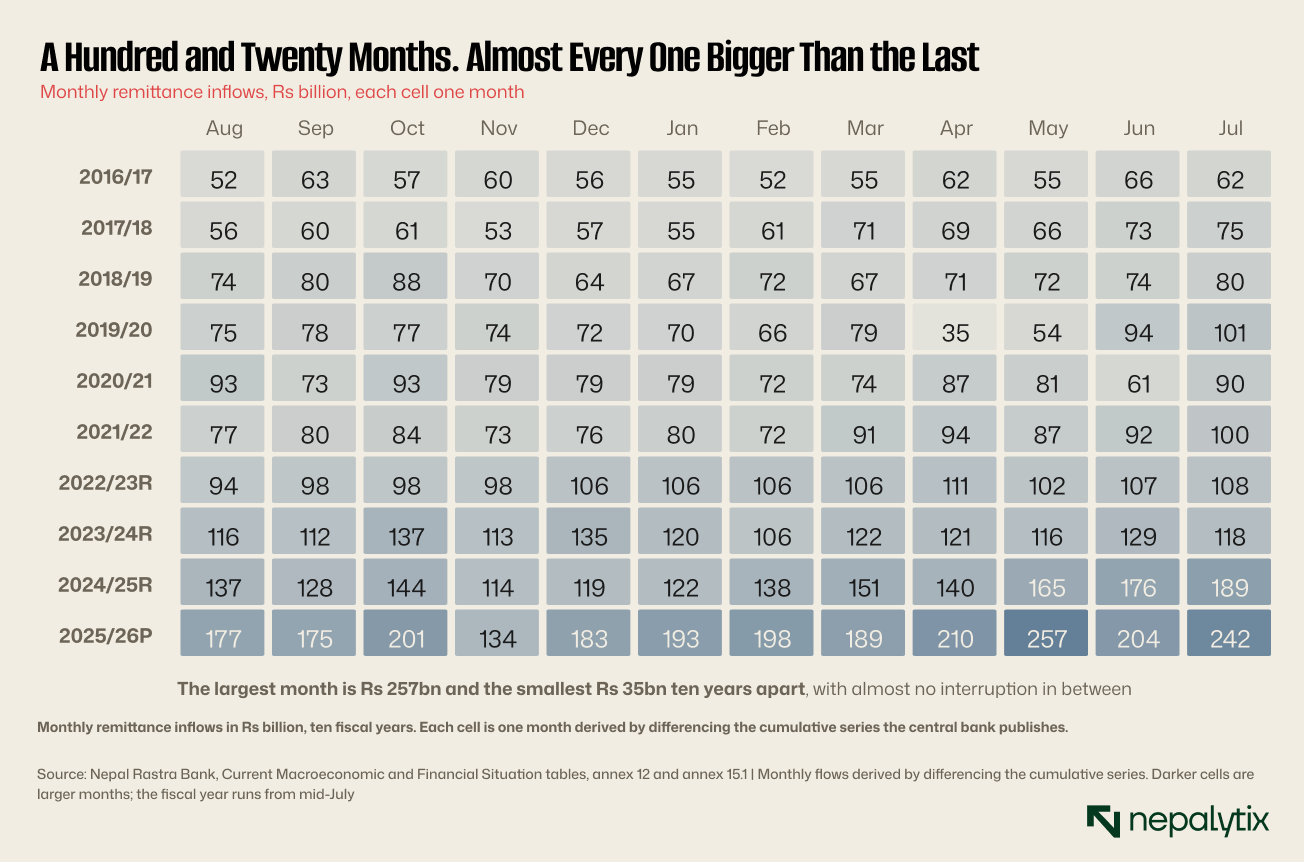
Remittances were Rs 695.5 billion in FY2016/17 and Rs 2,363.1 billion in FY2025/26. Read the grid left to right and top to bottom and the darkening is almost uninterrupted.
There is one flat year, FY2019/20 when the total fell 0.5% as borders closed. There is no other. Not during the 2015 reconstruction, not during the fuel blockade, not during the political instability that has removed governments at intervals throughout the period.
Last year the flow grew 37.1% which is the largest annual increase in the series by a considerable margin. The previous largest was 23.2% in FY2022/23.
Look at the bottom row and the top row together. In FY2016/17 a good month brought Rs 55 billion. Last year a weak month brought Rs 180 billion. The worst month of the final year is more than three times the best month of the first.
That compounding is what a decade of remittance growth looks like and it is easy to lose in a percentage. The flow did not accelerate suddenly. It grew at 8.6%, then 16.5%, then fell 0.5%, then 9.8%, 4.8%, 23.2%, 16.5%, 19.2% and 37.1%. Only two of those ten years were below 8%.
For a country whose politics has produced a change of government roughly every eighteen months throughout the period, that is a remarkably steady line. Nothing domestic touches it which is the first clue about what it actually is.
One detail in the grid is worth pausing on. The pandemic year is visible but shallow. FY2019/20 fell 0.5% and FY2020/21 grew 9.8% which means the two years together were roughly flat.
Compare that with what happened to departures. Approvals collapsed from 743,850 in FY2076/77 to 333,398 in FY2077/78, a fall of 55.2%. Almost nobody left Nepal for work that year.
The money kept coming because the people who had already gone stayed and kept sending. That is the same mechanism operating in the present and the pandemic is the cleanest natural experiment for it in the dataset: departures fell by more than half and the flow did not notice.
Fewer people are leaving
Set that against the number of people going.
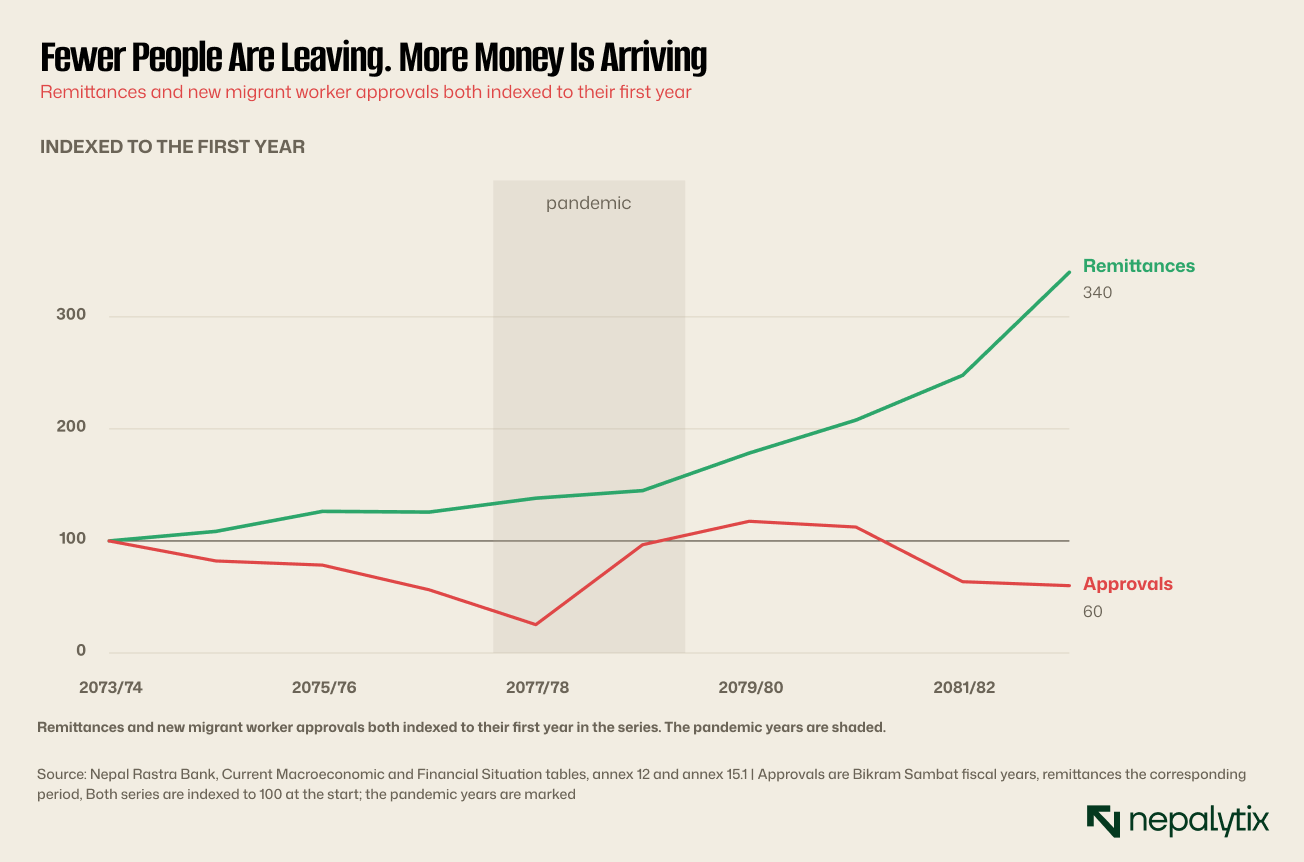
New labour approvals peaked at 1,549,952 in FY2079/80. Last year the figure was 792,308, a fall of 48.9% from the peak and 5.6% on the year.
The two lines separate decisively after 2079/80. Remittances continue upward. Departures fall by half.
This is not a data artefact. Both series come from the same institution, cover the same periods and are published in the same workbook. The pandemic distorts the middle of both which is why the divergence matters most at the right-hand end where conditions are ordinary.
The shape of the gap matters too. Approvals and remittances moved together until FY2079/80 tracking each other through the pandemic collapse and the recovery that followed. It is only in the last three years that they part.
Those are the years in which the workers who left during the 2078/79 and 2079/80 surge when 1.27 million and 1.55 million approvals were issued, settled into their jobs. A worker who left in 2079/80 is now in a fourth year abroad.
So the divergence is not mysterious once the timing is laid out. It is the delayed effect of the largest migration wave in Nepal's history arriving at the point in its earning cycle where it sends the most money home.
The arithmetic that explains it
Divide one by the other and the mechanism becomes visible.
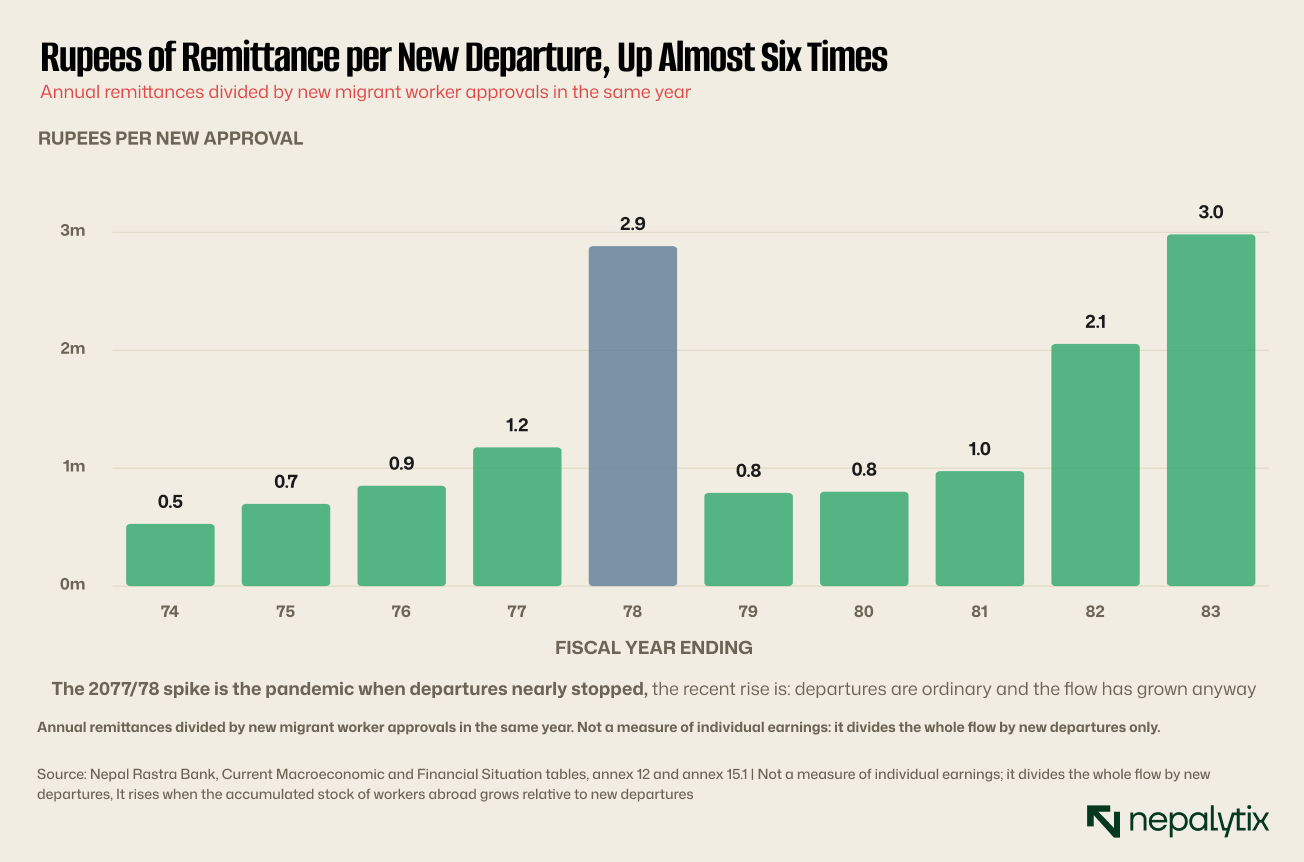
In FY2073/74, Nepal received Rs 527,473 of remittances for every new approval issued. Last year the figure was Rs 2,982,590. That is 5.7 times higher.
The number is not a wage. It is the whole inflow divided by new departures and it rises when the accumulated stock of Nepalis already working abroad grows relative to the number newly leaving.
Which is exactly what has happened. Renewals of existing permits rose 15.7% to 385,783 last year while new approvals fell 19.7%. Nepal is not sending fewer workers in total. It is sending fewer new ones and keeping the existing ones in place for longer.
A migrant in their sixth year abroad earns more than one in their first, has usually repaid the recruitment debt that consumed the early remittances and sends a larger share of a larger wage. The stock is maturing, and a maturing stock produces more money per person without anyone leaving.
There is a second mechanism working alongside the first and the data cannot separate them.
Recruitment in Nepal is debt-financed. A worker borrows to pay agency fees, travel and documentation, often at rates well above bank lending rates and often against family land. The first year or two abroad services that debt and remittances during that period are smaller because a portion never leaves the destination country.
A smaller cohort of new departures therefore means a smaller cohort in the debt-servicing phase. The average Nepali worker abroad in 2026 is further from their departure date than the average worker in 2023 which raises the average remittance per worker without any individual earning more.
Nothing published measures this directly. The recruitment cost data that would allow it is not collected in a form that can be matched to the approvals series.
Where they go has changed completely
The destination data is the richest part of the workbook and the least discussed.
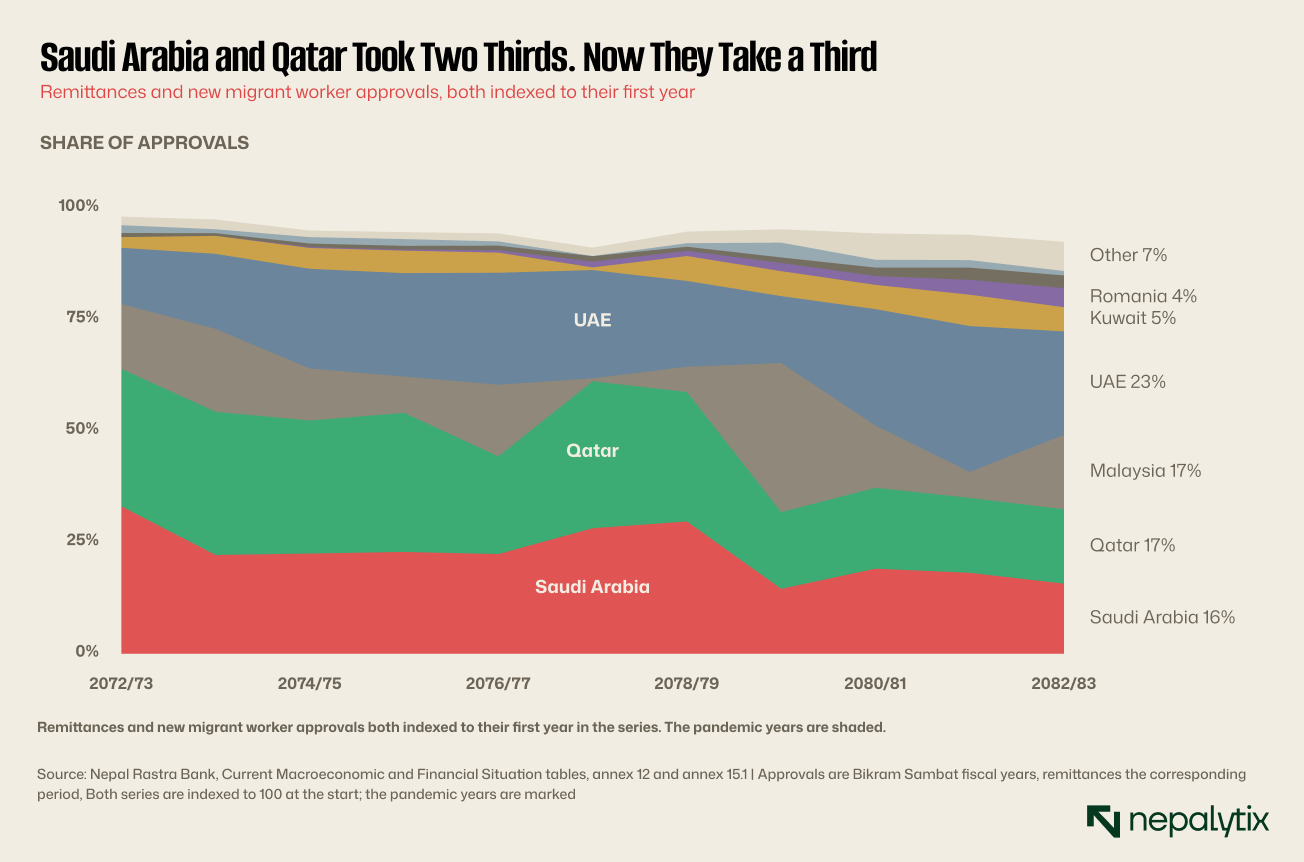
In FY2072/73, Saudi Arabia took 33.1% of Nepali labour approvals and Qatar 30.8%. Between them, two countries took 64%.
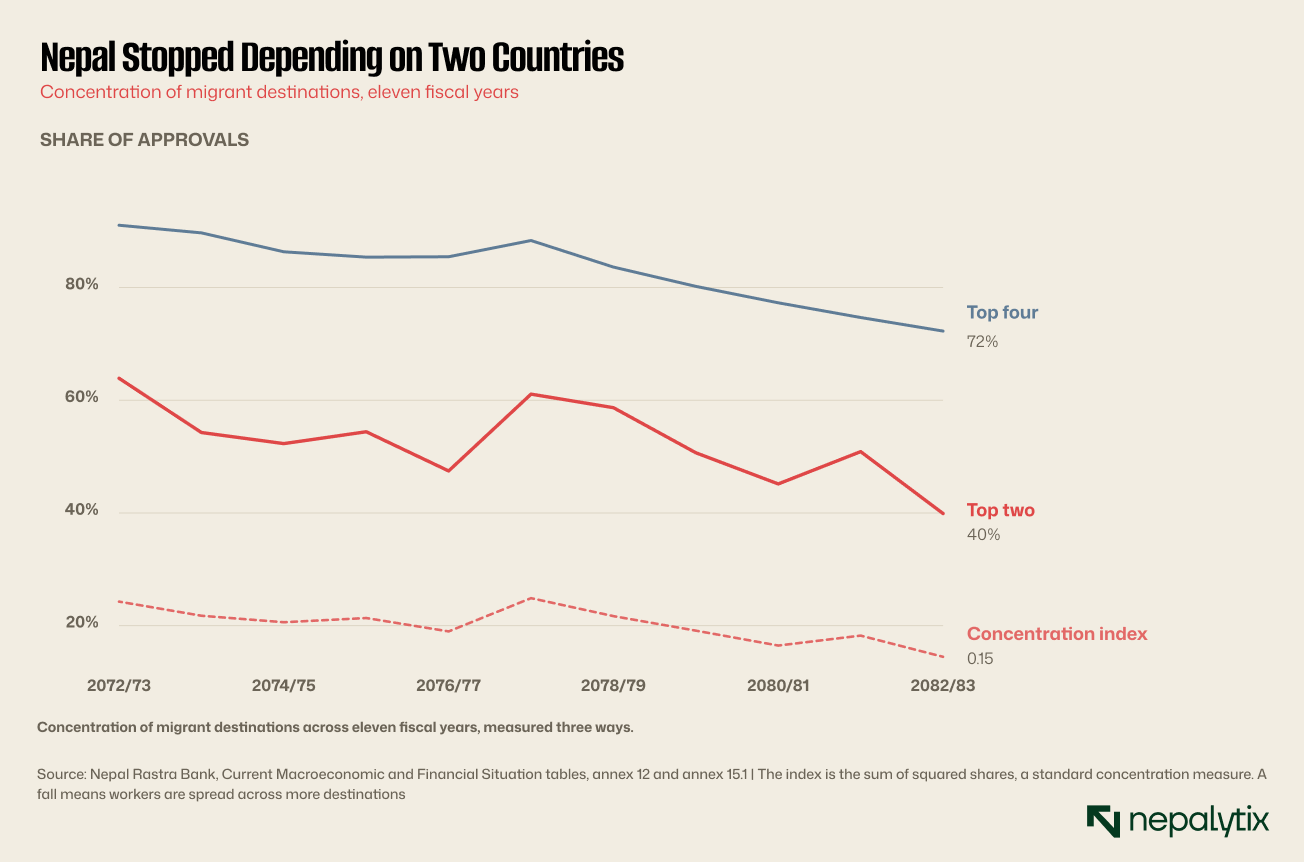
Last year Saudi Arabia took 15.7% and Qatar 16.7%. The two together take 40%. The United Arab Emirates has risen from 12.6% to 23.2% and is now the largest single destination.
Measured properly, the concentration index has fallen from 0.24 to 0.15. The top four destinations took 91% of approvals a decade ago and take 72% now.
That is a substantial structural change and it happened without a policy driving it. Qatar's construction programme concluded. Malaysia opened, closed, reopened and now takes 16.7% after peaking at 33%. Romania appeared from nothing and takes 4.3%.
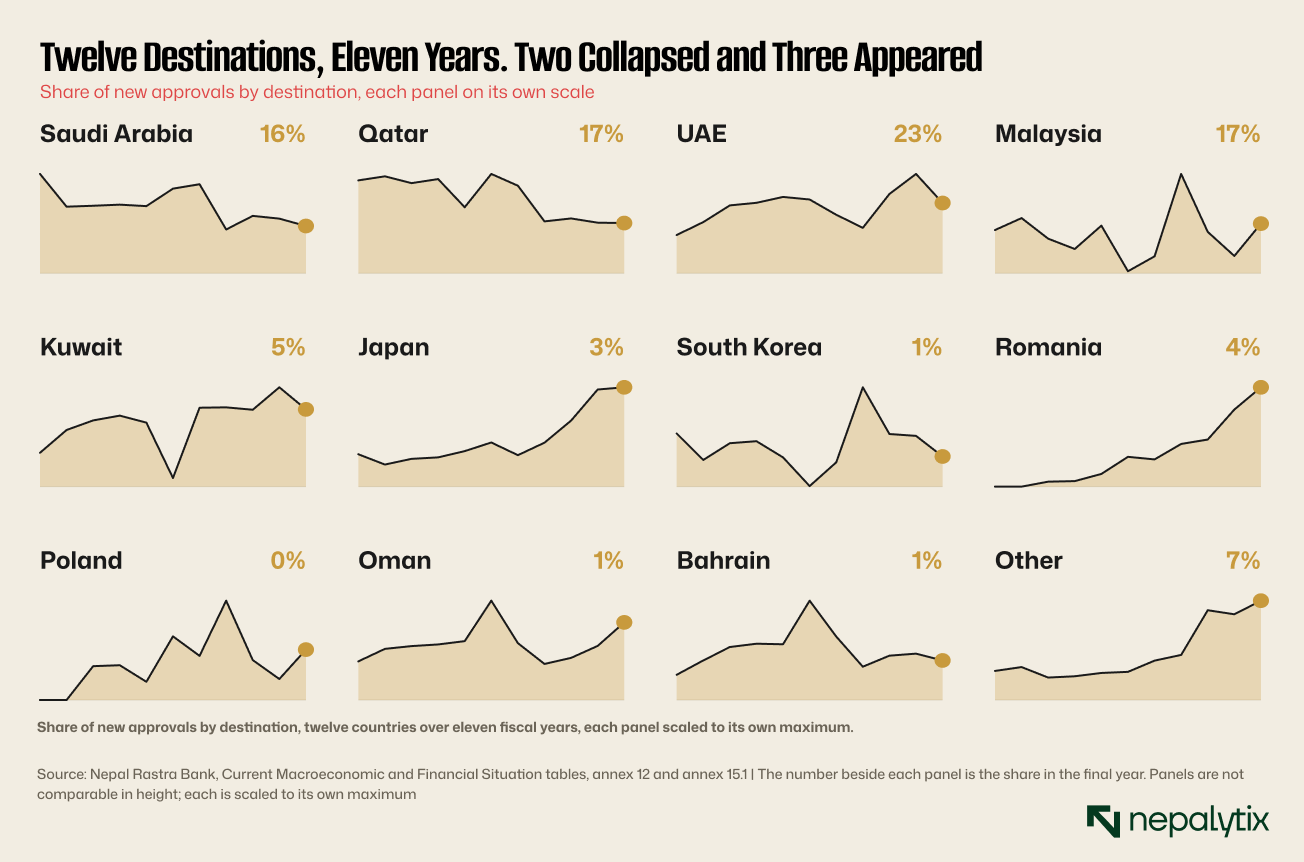
The individual paths are more informative than the aggregate. Saudi Arabia and Qatar both decline steadily throughout. Malaysia is violently cyclical, moving on bilateral agreements rather than demand. Romania, Poland and Japan begin at zero and rise. South Korea is flat and small, constrained by a quota system rather than by demand.
A Nepali worker's options in 2016 were essentially four Gulf states. Today they include eastern Europe, east Asia and a longer tail of smaller destinations.
The Malaysia series is worth following on its own because it shows how little control Nepal has over any of this.
Malaysia took 14.6% of approvals in FY2072/73. It then effectively closed, falling to almost nothing during a dispute over recruitment practices and medical screening. It reopened and by FY2079/80 it took 33% of all Nepali labour approvals, more than any country has taken before or since. It now takes 16.7%.
None of those movements originated in Nepal. Each followed a decision in Kuala Lumpur about foreign worker quotas, recruitment agents or bilateral terms. A third of Nepal's migration programme was switched on and off by another country's domestic politics.
The eastern European destinations tell the opposite story at smaller scale. Romania appears in the data from FY2078/79 and reaches 4.3%. Poland and Malta follow. These are demand-driven openings created by labour shortages in the European Union and they pay considerably more than Gulf construction work.
Whether that continues depends on European labour markets and European migration politics, neither of which Nepal influences either. The improvement in Exhibit 5 is real and it is not something Nepal earned.
A note on what the per-departure ratio is not because it is the figure most open to misreading.
It is not an average remittance per worker. The denominator counts only new approvals in that year while the numerator is money sent by everyone abroad including workers who left a decade ago. When departures fall, the ratio rises mechanically whether or not anyone's earnings change.
That is precisely why it is useful here. A ratio that rises when departures fall is a direct measure of how much the flow depends on the accumulated stock rather than on new departures. At Rs 527,473 in FY2073/74, Nepal's remittances were closely tied to how many people left that year. At Rs 2,982,590 they are not.
The FY2077/78 spike of Rs 2,882,605 is the pandemic and should be read as an artefact: departures nearly stopped so the denominator collapsed. What is notable is that the current figure exceeds even that under entirely normal migration conditions.
What the money is
It is worth being precise about what remittances are in the national accounts, because the loose description does real damage to how people reason about them.
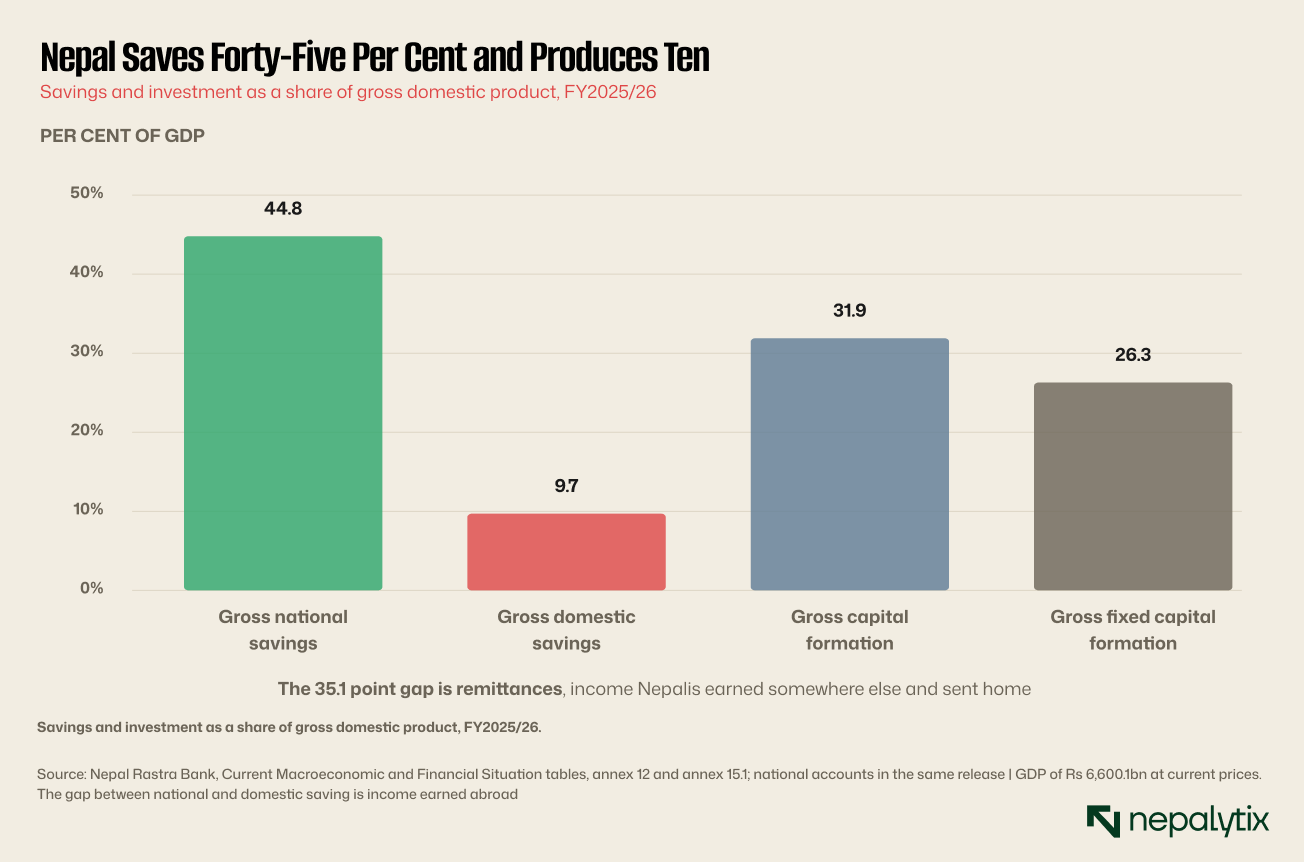
Gross national savings were 44.8% of GDP last year. Gross domestic savings were 9.7%.
The gap of 35.1 points is income Nepalis earned somewhere else. Domestic savings measure what the economy produces and does not consume. National savings add what its people earn abroad. Nepal's domestic saving rate is ordinary for a country at its income level. Its national saving rate is among the highest in the world and the difference is entirely migration.
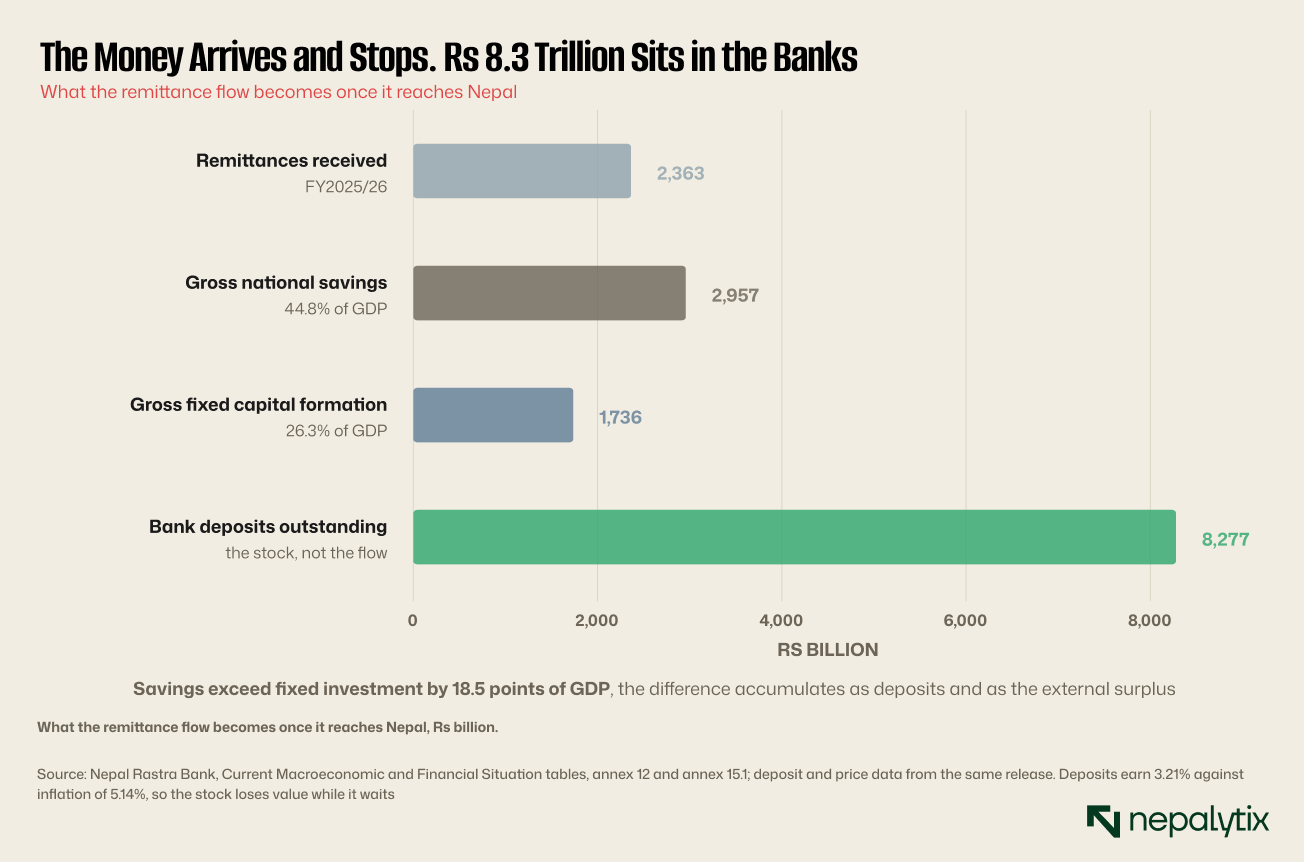
Gross fixed capital formation was 26.3% of GDP. So the country saves 44.8% and invests 26.3% in fixed assets leaving 18.5 points of GDP saved and not invested domestically.
That surplus has to go somewhere and where it goes is the subject of the second half of this piece.
There is a further distinction that the aggregate figure obscures and it matters for policy.
Remittances are a transfer not a return on an asset. They appear in the current account as secondary income which means they finance imports directly and do not require anything to be produced domestically to service them. That is why Nepal can run a goods trade deficit of the scale it does and still hold reserves.
A country with the same inflow from exports would have a productive base generating it. Nepal's inflow is generated abroad by people and the productive base sits in Doha and Dubai and Kuala Lumpur. The national accounts record the income and cannot record the asset because the asset is a Nepali citizen working in somebody else's economy.
That is not an argument that remittances are inferior income. It is an argument that the usual reasoning about savings rates does not apply. A 44.8% national saving rate normally signals an economy accumulating capital rapidly. Here it signals an economy receiving income it did not produce and failing to convert it.
The eleven-year path also reveals something about how Nepal responds to shocks in the destination countries and the answer is that it does not respond so much as absorb.
When Qatar's construction programme wound down after 2022, Nepali approvals to Qatar fell from 17% to 16.7% over the following years rather than collapsing. When Saudi Arabia's share halved, the workers did not stay home; they went to the UAE, whose share nearly doubled over the same period.
That substitution is the single most important protective feature of the current arrangement and it happens without any institution directing it. Recruitment agencies follow demand, workers follow agencies and the aggregate reallocates within a year or two of a destination closing.
The limit of that mechanism is that it only works while some destination is opening. The substitution from Saudi to UAE worked because the UAE was hiring. A simultaneous slowdown across the Gulf would have nowhere to route to and the eastern European destinations are currently too small to absorb it: Romania, Poland and Malta together take under 6% of approvals.
The sparkline panels repay a slower read because each one is a small policy history.
Saudi Arabia declines almost monotonically across eleven years from a third of all approvals to a sixth. There is no single break; it is a steady withdrawal as the kingdom's labour nationalisation programme tightened and its construction pipeline matured.
Qatar shows a clear arc: rising into the World Cup construction programme, peaking, then falling away after 2022. The stadiums were built and the workforce was not needed.
The UAE rises throughout and accelerates in the final three years absorbing much of what Saudi Arabia and Qatar released. Kuwait, Oman and Bahrain stay small and flat.
Japan and South Korea are the most interesting small panels. Both pay several times Gulf wages and both are constrained by quota and language testing rather than by demand. South Korea's Employment Permit System admits a fixed number annually; Japan's specified skilled worker programme requires certification. Nepali supply into both exceeds the available slots by a wide margin which is why the shares stay at 2.8% and below despite being the most valuable destinations on the board.
That is a policy gap Nepal could actually close. Language training and skills certification are domestic programmes and the destinations have stated demand. Everything else in this chapter depends on decisions made elsewhere.
The shape of the year
One more feature of the flow before leaving it because it contradicts what most people believe.
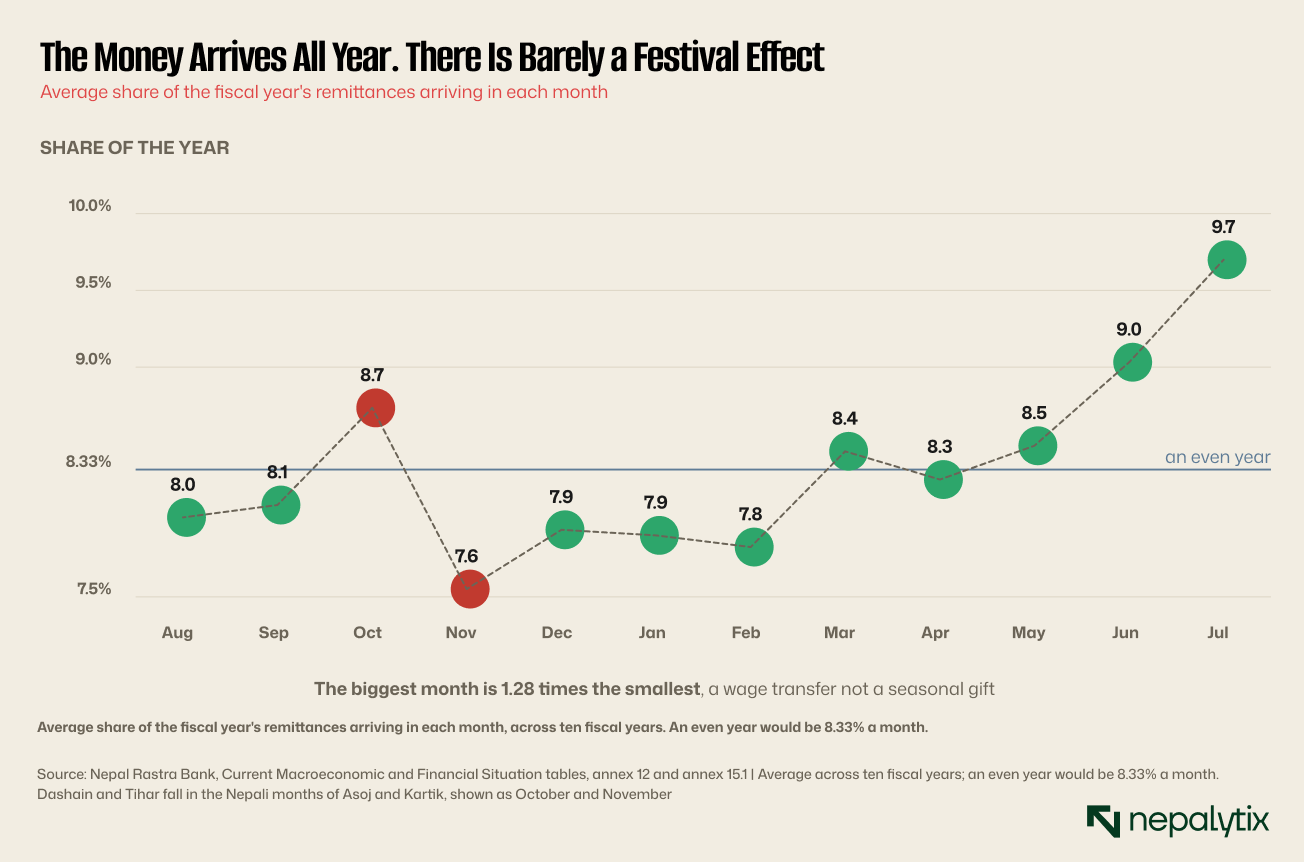
The common belief is that remittances spike at Dashain and Tihar, when families need money for the festivals. The data shows a mild effect at most.
The largest month averages 9.70% of the year and the smallest 7.55%. The ratio between them is 1.28. October and November which contain the festivals in most years, sit at 8.73% and 7.55% respectively which is to say one is slightly above average and the other is the lowest month of the year.
The flow behaves like a wage transfer rather than a gift. Money arrives because someone was paid, not because a festival is approaching. That is a more reassuring picture than the festival story implies because a wage-driven flow is more stable and it is a less reassuring one for the same reason: it depends on continued employment rather than on continued affection.
One further reading of the seasonality data deserves recording because it bears on vulnerability.
A flow that spikes at festivals is discretionary: it depends on the sender choosing to send. A flow that arrives evenly is contractual: it depends on the sender being paid. The Nepali pattern is closer to the second which makes it more predictable month to month and more exposed to employment conditions in the destination.
Put differently, the thing that would interrupt Nepali remittances is not Nepali families needing less. It is Gulf and Malaysian employers needing fewer workers. The risk sits entirely outside the country and outside the reach of any domestic policy.
The savings figures also settle an argument that recurs in Nepali policy debate: whether remittances are "wasted on consumption".
A country wasting its remittances on consumption would show a low national saving rate. Nepal shows 44.8% which is among the highest figures recorded anywhere. Whatever households are doing with the money, a very large share of it is not being consumed.
The gap that matters is not between consumption and saving. It is between saving and investment: 44.8% saved against 26.3% in fixed capital. The failure is downstream of the household in the institutions that are supposed to turn savings into productive assets.
That reframing changes what policy should target. Campaigns urging migrant families to save rather than spend address a problem the data does not show. The binding constraint is that the saving already happening has nowhere productive to go.
What happens when it lands
Rs 2,363 billion arrives. It lands in bank accounts and Monday's Signal three weeks ago described what it finds there: deposits of Rs 8,276.93 billion earning 3.21% against inflation of 5.14%.
Households hold 64% of those deposits and added 17.3% over the year, faster than any institutional holder. So the remittance flow arrives becomes a deposit and loses purchasing power at roughly 1.9% a year while it waits.
It waits because there is nowhere obvious for it to go. Credit to the private sector grew 6.5% last year against deposit growth of 13.9%, which means banks took in nearly three rupees for every one they lent. The equity market is worth Rs 4,463.55 billion, roughly half the deposit base. Property is illiquid and opaque. There is no household bond market.
The result is a country with one of the highest savings rates in the world and a chronic shortage of places to put the savings.
The deposit picture deserves more than a sentence because it is where the whole chain terminates.
Households hold Rs 5,349.7 billion of the Rs 8,276.93 billion in the banking system, and that balance grew 17.3% last year. No institutional holder grew faster. Insurance companies added 0.3%. Government institutions withdrew 4.9%.
At the same time households moved twenty-one percentage points of the deposit base out of fixed deposits and into savings accounts over two years, from 56.4% to 35.3%. They accepted a lower rate to keep the money available at short notice.
Read that alongside the remittance flow and a picture emerges. Money arrives from abroad, enters a household account, earns less than inflation and is held in the most liquid form available. Whatever the recipients are waiting for, it is not a fixed deposit rate.
Nepal has no measure of household financial asset allocation outside the banking system so where that money eventually goes is unknown. The candidates are land, gold, and education for the next migrant.
There is a human reading of the divergence that the aggregates obscure and it should be said plainly.
Behind the 5.7 times increase in remittance per departure is a cohort of Nepalis who have been abroad for four, six, ten years. They have repaid what they borrowed to leave. They have moved from the first job to a better one. They send more because they have more and because the household at home has come to depend on the amount.
The same data says the flow now depends on those people staying. Nepal's external position, its savings rate and its import cover rest on a cohort that is ageing in someone else's labour market and will eventually come home or stop.
Half the departures of five years ago means half the replacements. That is the arithmetic underneath a number that currently looks like success.
Why it does not become investment
This is the part that matters for policy and it is genuinely difficult.
The intuitive answer is that remittance income is consumed rather than invested and there is truth in it. Household surveys in Nepal and elsewhere consistently find that the largest uses are daily consumption, loan repayment, education and health with a smaller share going to land, housing and business.
But that answer is incomplete because the national accounts already capture consumption. What they show is a 44.8% national saving rate which means a great deal is not being consumed. The question is not why remittances are spent. It is why the part that is saved does not become domestic investment.
Three explanations fit the data this publication has assembled.
The projects are small and the capital is atomised. Nepal's largest capital-hungry sector is hydropower and last Thursday's Long Read found 112 listed companies with a median market capitalisation of Rs 4.57 billion. A country financing infrastructure through hundreds of tiny single-asset companies cannot absorb large flows efficiently.
The intermediation is thin. Banks hold the deposits and lend against land: the fastest-growing categories of credit last year were import financing, construction and lending against shares. None finances production. A banking system with surplus deposits and weak credit demand is not a mechanism for turning savings into capital.
The equity market cannot price risk in one direction. Yesterday's Take set out that Nepal has no mechanism for expressing a negative view and the post-listing screen found no company in either sample trading below its issue price. A market that cannot distinguish a good project from a bad one at the moment of issue is a poor allocator of the savings routed through it.
None of those is about migrants. They are all about what Nepal does with money once it has it.
There is a fourth explanation and it is uncomfortable because it implicates the arrangement itself.
A steady external income reduces the pressure to build the institutions that would use it. A country without remittances that needed foreign exchange would have to export something which requires productivity, infrastructure and competitive industry. Nepal does not have to because the money arrives regardless.
This is the resource curse argument applied to labour rather than minerals and it has the same shape: a reliable external inflow weakens the incentive to develop everything else, while also raising the exchange rate and making domestic production less competitive.
The evidence for it in Nepal is circumstantial rather than conclusive. Domestic savings at 9.7% of GDP and fixed capital formation at 26.3% describe an economy that produces little and invests moderately, funded from outside. Whether that is caused by remittances or merely coincident with them cannot be settled from this data.
What can be said is that a decade of exceptionally reliable inflows has not been accompanied by the development of a domestic mechanism to deploy them and that the machinery which does exist has been documented in this publication over the past month as being unable to price risk, unable to value collateral, and unable to distinguish a good issue from a bad one.
It is worth quantifying how thin the domestic alternatives actually are, because the phrase "nowhere to put the money" is doing a lot of work.
Bank deposits are Rs 8,276.93 billion. NEPSE's entire market capitalisation is Rs 4,463.55 billion, roughly half. The annual remittance flow alone at Rs 2,363 billion is more than half the value of every listed company in the country.
So a single year's remittances, if directed at the stock market, would be over half the market. Two years would be more than all of it. There is no plausible reallocation of the remittance flow into Nepali equities that the market could absorb without a violent repricing which is a different way of saying the market is far too small for the savings the country generates.
The same arithmetic applies to the bond market, which barely exists and to formal property which has no price transparency and high transaction costs. The flow is large relative to every domestic asset class simultaneously.
What could reverse it
An economy resting 35.8% of its output on income earned elsewhere has to think about what would stop it.
The currency did a third of last year's growth. The rupee depreciated 10.9% against the dollar over the fiscal year. A remittance sent in dollars and received in rupees grows by that amount before any change in the underlying. So of the 37.1% headline increase, a meaningful part is translation rather than more money being earned or sent. That portion reverses if the rupee strengthens and it is not a productivity gain.
The stock ages out. The mechanism described in chapter three works because the existing cohort is maturing. Cohorts also retire. If new departures stay at half their peak for another decade, the stock stops growing and then shrinks and remittance per departure stops rising because there is no longer an accumulating base behind it.
The destinations change policy. Malaysia's path in Exhibit 6 is the warning. It went from 15% of approvals to nothing to 33% to 17% driven by bilateral agreements rather than by Nepali supply. Any of the major destinations can do the same and Nepal has no influence over their decisions.
Gulf employment structurally declines. The Gulf states are diversifying away from construction-led growth and nationalising parts of their labour markets. The destination shift in Exhibit 4 already shows the effect: Saudi and Qatar halved their share over the period.
That last point cuts both ways and is the most encouraging thing in the dataset. The diversification means Nepal is no longer dependent on two countries. A policy change in Riyadh that would have devastated the flow a decade ago would now affect one sixth of new departures.
The most encouraging thing in the dataset deserves to be stated on its own because the rest of this piece is about fragility.
Nepal's exposure has genuinely diversified. In FY2072/73, a single decision in Riyadh or Doha could have affected a third of the flow. Today no single destination accounts for more than a quarter of new departures, the top two take 40% rather than 64% and the concentration index has fallen by a third.
The composition has also improved in quality. Romania, Poland, Malta, Japan and South Korea pay considerably more than Gulf construction work and sit in economies with stronger labour protection. The share going to those destinations is still small but it is rising and it did not exist a decade ago.
A remittance economy dependent on twenty destinations is a more robust thing than one dependent on four. That change happened over eleven years and it is visible in Exhibit 4 as a widening of the bands rather than as any single event.
What the numbers cannot tell you
The limits here are serious and they are worth stating before the conclusion rather than after.
The approvals data counts permits issued, not people. A worker who renews is counted in the renewal series, a worker who changes employer may be counted twice, and a worker who leaves without a permit is not counted at all. India which shares an open border with Nepal and hosts an unknown but large number of Nepali workers does not appear in the destination data at all because no permit is required.
That last omission is substantial. Estimates of Nepali workers in India vary enormously and none is reliable. Everything in chapters two through four describes permitted migration to countries that require permits which is most of the formal flow and an unknown share of the total.
Remittances are measured where they enter the banking system. Money carried across the Indian border in cash or moved through informal channels does not appear. The reported figure is therefore a floor rather than an estimate.
And nothing in this data says what any individual earns, saves or sends. The per-departure figure in chapter three is an aggregate ratio and should not be read as a wage.
A note on why the informal channel matters for everything above.
Nepal shares an open border with India and Nepali workers in India require no permit, appear in no approval series and frequently send money through channels that never enter the banking system. The figure of Rs 2,363 billion counts what arrived through banks and money transfer operators.
Estimates of the Nepali workforce in India range from several hundred thousand to several million and none is reliable. If the true figure is at the upper end, a material share of Nepal's remittance economy is invisible in every chart in this piece.
The practical consequence is that the destination analysis in chapters four and five describes permitted migration only. It is the formal system, measured well sitting on top of an informal system that is not measured at all.
What would have to change
Four things would convert the flow into capital and none of them is about migrants.
Something to buy. A household with surplus savings in Nepal has a bank deposit, land, gold or a stock market where the primary price carries no information. There is no retail government bond programme of scale, no corporate bond market households can access and no pension product outside the Employees Provident Fund and Citizen Investment Trust. Creating an instrument that pays a real return and can be bought in small amounts would absorb more than any exhortation to invest productively.
The gap is measurable. A saver earns 3.21% against 5.14% inflation. A government bond paying even the 91-day Treasury rate of 2.32% is worse. The instrument does not exist because nobody has built it not because households would refuse it.
Projects large enough to absorb it. Last Thursday's Long Read found 112 listed hydropower companies with a median market capitalisation of Rs 4.57 billion and 34 more queued. An economy financing its largest capital need through hundreds of micro-issues cannot deploy Rs 2,363 billion a year.
A functioning primary market. The post-listing screen found no company in either sample trading below its issue price, which means the price at which Nepali companies sell equity carries no information about quality. Capital allocated through such a mechanism is allocated by ballot rather than by judgement.
Somewhere for banks to lend. Deposits grew 13.9% and credit 6.5%. The fastest growing credit categories were import financing, construction and lending against shares. A banking system that cannot find productive borrowers will not intermediate a remittance flow into investment however large the flow becomes.
Each of those is a domestic construction project. None depends on what happens in Dubai.
One more structural feature deserves recording because it connects this piece to the rest of the month's work.
The remittance flow and the equity market meet at exactly one point: the household deposit. Rs 2,363 billion arrives, joins Rs 8,276.93 billion already sitting in banks and earns less than inflation. The stock market is half the size of that deposit base and as the last three weeks have documented, cannot price a new issue, cannot value collateral reliably and cannot express a negative view.
So the two largest financial facts about Nepal are a very large pool of household savings and a very small market that cannot absorb it. Every piece this publication has run in September has been about one side or the other of that gap.
The thing to hold on to
Nepal has built an economy in which the largest single source of foreign exchange, the largest contributor to national saving and the primary support of the external balance is work performed outside the country by people who mostly intend to come back.
That arrangement has been extraordinarily durable. It survived a pandemic with a single flat year. It grew through political instability, an earthquake, a blockade and a flood. It is now delivering more money from fewer new departures than at any point on record.
What it has not done is turn into anything. The savings rate is among the highest in the world and the fixed investment rate is 18.5 points below it. The difference accumulates as bank deposits earning less than inflation, as foreign exchange reserves and as an external surplus in a country that needs capital.
The remittance economy is often discussed as a vulnerability and the vulnerability is real. But the more immediate problem is not that the money might stop. It is that the money has been arriving reliably for a decade and Nepal has not built the machinery to use it.
Fewer people are leaving. More money is arriving. And it is sitting in a bank account losing 1.9% a year while the country it came home to argues about how to attract investment.
There is one more comparison worth making between what Nepal receives and what it would need to receive from anything else.
Foreign direct investment into Nepal has never approached the remittance figure. Tourism, the sector most often named as the alternative earns a fraction. Exports of goods run at a small multiple of nothing against imports. Nepal's external position is remittances and then everything else and the everything else is a rounding error against it.
That is not a criticism of policy so much as a statement of scale. Building a tourism industry or an export sector that replaces Rs 2,363 billion a year is not a plan; it is a generational project that would have to begin by matching a figure that is itself still growing at double digits.
Which means the realistic question is not how Nepal replaces remittances. It is how Nepal uses them while they last.
The years ahead
Three things to watch, in the order they would show up.
The renewal series. New approvals have fallen for two years and renewals have risen. The mechanism described here works while renewals outpace departures. When renewals start falling, the stock has begun to shrink and the per-departure ratio will stop rising.
The destination mix. Romania, Poland, Malta and Japan are small and growing. If their combined share keeps rising, the average Nepali migrant earns more and the flow becomes more valuable per person. If a policy change in Europe closes them, Nepal falls back on the Gulf at a moment when the Gulf is nationalising its labour market.
The exchange rate. A tenth of last year's headline growth was the rupee weakening. That works in both directions and it is the most volatile component of the number everyone quotes.
None of those is forecastable from the data. What the data does establish is the structure: a flow driven by an accumulated stock rather than by new departures, spread across more destinations than at any point in the series, arriving steadily throughout the year, and terminating in a bank account that loses value.
Disclaimer
This report has been prepared by Nepalytix for informational and educational purposes only and does not constitute investment advice, an offer, or a solicitation to buy or sell any securities.
The information contained in this report is based on sources believed to be reliable; however, Nepalytix does not guarantee its accuracy, completeness, or timeliness. Opinions, estimates, and projections expressed herein are those of the authors as of the date of publication and are subject to change without notice.
Investing in securities involves risks, including the possible loss of principal. Past performance is not indicative of future results. Readers are advised to conduct their own independent research and consult with a qualified financial advisor before making any investment decisions.
Nepalytix and its contributors may hold positions in the securities discussed in this report at the time of publication or thereafter.
Neither Nepalytix nor any of its affiliates accept any liability for any loss arising from the use of this report or its contents.