Promoters Own 61% of Nepal’s Stock Market. What Happens When They Sell?
Promoters own 61% of the value of Nepal’s listed companies but much of that wealth is either locked in or trades at a steep discount. An analysis of 88 lock-in expiries finds that stocks typically fall before promoter shares become tradable raising questions about market liquidity, investor protection and the Rs 355 billion in promoter shares still locked up.

Promoters own 61% of the value of Nepal’s listed companies. In the banks and insurers that stake sits on a separate line that trades at about half price a few days a year. Everywhere else it comes loose after three years and the share price usually falls before it does. We traced every unlock since 2016 and every promoter line that traded in the past year. Then we looked at what September’s ISIN(International Securities Identification Number) merger did to the first six companies whose promoters wanted out.
1. The other half of the market
Ask what the Nepal Stock Exchange is worth and the usual answer is the market capitalisation printed at the close: every listed share multiplied by its last price. On 14 October that figure, across the 259 companies for which we could get a full shareholding record came to Rs 4.20 trillion. It is a useful number and a misleading one. It treats every share as if it could be sold at the price the last ordinary share fetched. Most of them cannot.
Every listed company in Nepal has two kinds of shareholder. Promoters are the founders, sponsors and institutions that put up the capital before the company went public. The public bought shares at the IPO or afterwards. The two groups hold the same company, receive the same dividend per share and usually vote together. They do not hold the same asset. For the first three years after an IPO, promoter shares cannot be sold at all. In banks, finance companies, microfinance lenders and insurers they never join the ordinary share. They sit on a separate trading line with its own symbol usually the ordinary symbol with a P or PO on the end and trade there, rarely and at a deep discount.
Measured at the ordinary price, promoter shares account for Rs 2.56 trillion of the Rs 4.20 trillion or 61%. Rs 1.36 trillion of that sits in the six sectors with a separate promoter line. That is 32% of the whole market, held in shares that as we show below, change hands on a handful of days a year at about 55% of the price on the screen. The rest Rs 1.20 trillion sits in hydropower, manufacturing, hotels, investment companies and the catch-all “others”. There, once the lock-in ends, promoter shares merge into the ordinary line and can be sold like any other share.
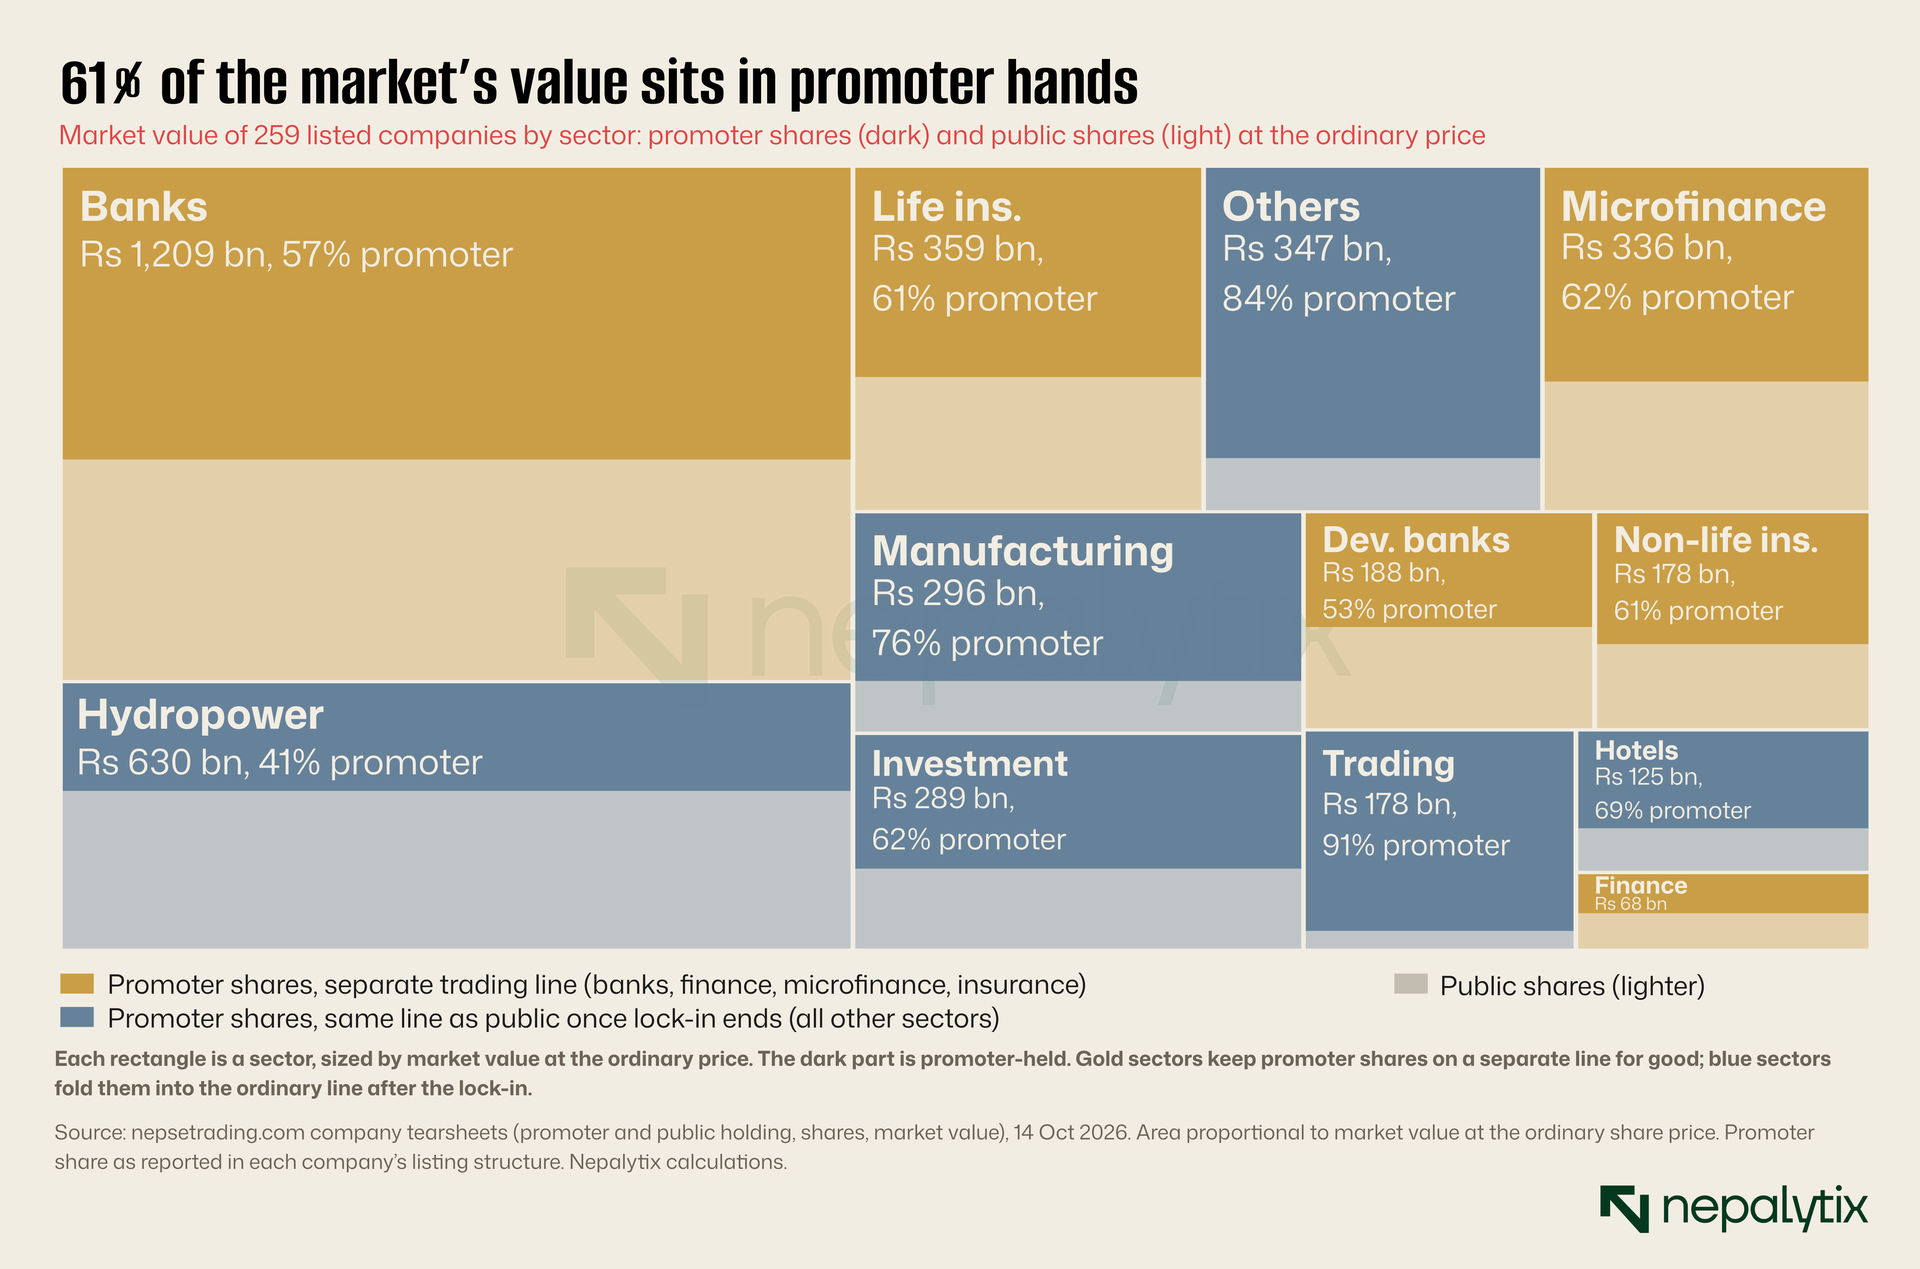
The split matters for three groups of people. For an ordinary investor it means the free float, the stock that can actually be bought and sold is much smaller than the market capitalisation suggests. That is one reason prices can move so far on so little volume. For promoters it means a large part of their wealth is either illiquid or saleable only at a large discount and that shapes how and when they try to sell. For regulators it creates a standing pressure. Promoters lobby to release their shares. The public resists because a release means new supply. Every compromise in between has to be priced by the market.
This piece is about that pressure: how large the locked and semi-locked stock is what it costs its holders, what happens to share prices when it comes loose and what the next two years of unlocks look like. It rests on four data sets. Shareholding structures come from the nepsetrading tearsheet for each listed company. Daily prices and volumes for the 59 promoter lines that traded in the past year and for their ordinary twins, come from merolagani. The full IPO register comes from ShareSansar and gives the allotment date from which each three-year lock-in runs. The lock-in schedule for the 40 companies whose promoters are still locked comes from nepsetrading.
A word on the 61% figure before going further. It is a ratio of value, not of shares and it uses the ordinary price for everything. It also includes stakes that are promoter holdings only in a legal sense. Nepal Telecom’s promoter is the government which holds 91.5% of the company. Citizen Investment Trust and Hydroelectricity Investment and Development Company are state institutions and the government is part of Nepal Reinsurance’s promoter group. Together those four account for about Rs 380 billion of promoter value roughly 15% of the total. Nobody expects the government to dump its Nepal Telecom shares on the exchange. But that is a small adjustment to a large number. Strip the state holdings out entirely and promoters still hold more than half of the market.
2. Who holds what
The promoter share is not set by the market. It is set by rules and the rules differ by sector which is why the distribution looks so different from one industry to the next.
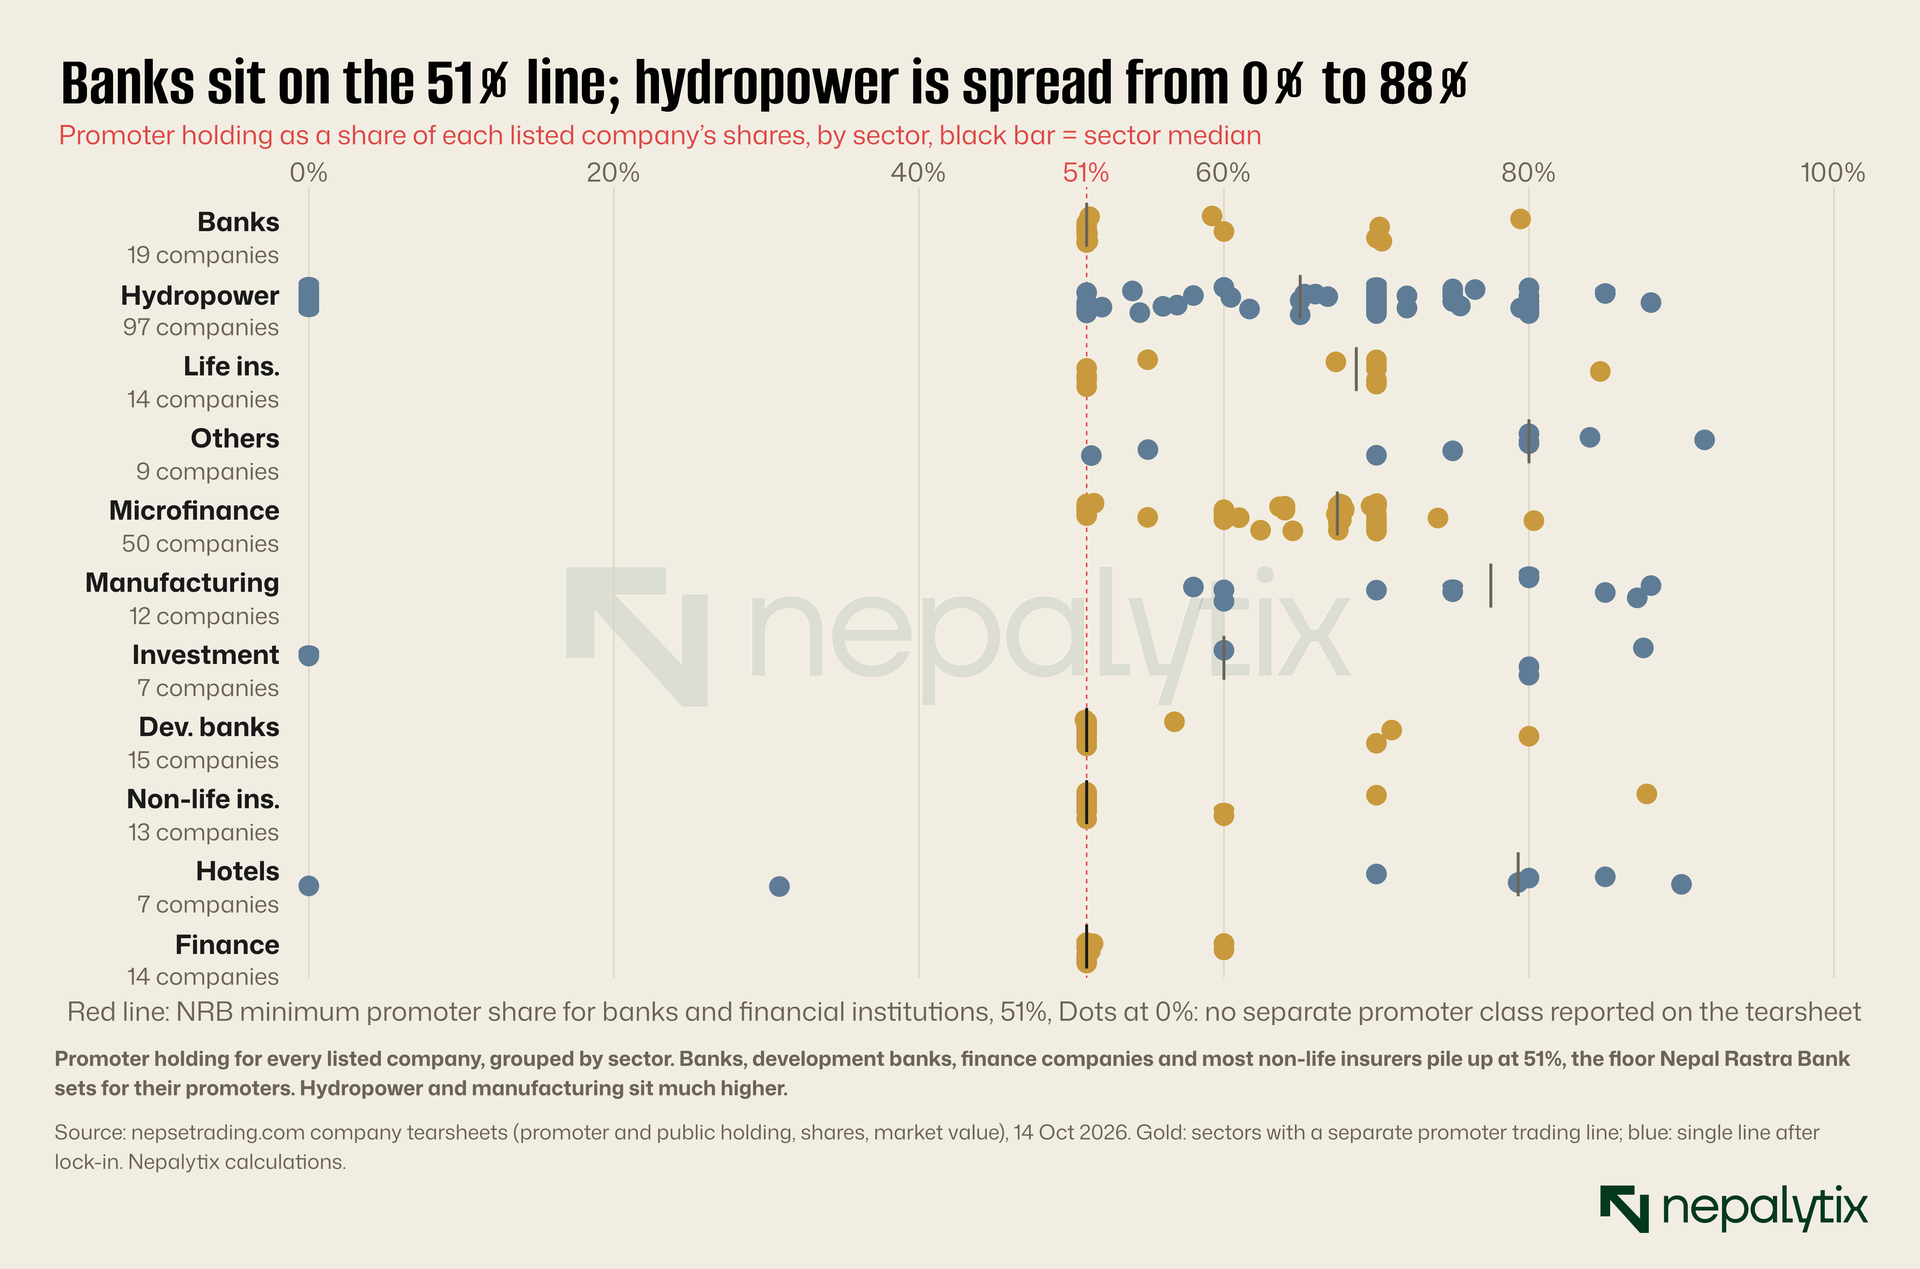
Banks and financial institutions cluster at exactly 51%. That is not a coincidence. Nepal Rastra Bank requires promoters of licensed banks and financial institutions to hold at least 51% of the capital. The ratio used to be 70:30 in favour of promoters and most institutions cut their promoter stake to the new floor as soon as the central bank allowed it. Of the 19 commercial banks, the median promoter holding is 51%. So is the median for development banks, finance companies and non-life insurers. A few banks stand above the line, mostly because a foreign or state promoter has kept a larger stake. Standard Chartered Bank Nepal is at 70%, Nepal Investment Mega Bank at 79%.
Microfinance and life insurance are higher with medians of 67% and 69%. Many microfinance lenders were set up by banks or by development projects that still own two-thirds of them.
Hydropower is the interesting case. Its median promoter holding is 65% and the companies that report a promoter stake sit anywhere between 51% and 88%. But 31 of the 97 hydropower companies report no promoter class at all. These are mostly older projects whose lock-in ended years ago and whose promoter shares have already merged into the ordinary line. Once that happens the tearsheet no longer distinguishes them. That is why hydropower’s promoter share of market value is only 41%, the lowest of any sector even though the typical hydro company still has a promoter stake of around two-thirds. Those 31 zeroes are the end state of the process we examine later in this piece: what happens when a hydro company’s promoter shares stop being promoter shares.
Manufacturing, hotels and the others are high: 76%, 69% and 85% of value respectively. These are often family or group companies that floated a minority stake. In the “others” sector the figure is dominated by Nepal Telecom. In trading, Bishal Bazar Company reports a promoter holding of 99% which is why that small sector looks almost entirely promoter-owned.
The result is a market in which the shares that trade every day are a minority of the shares that exist. For the median company, promoters hold 60% of the shares. For the median bank the public holds 49% but almost none of the other 51% ever trades. In hydropower, the sector where retail activity is heaviest, about two-thirds of a typical company’s shares sit with promoters where a promoter class is still recorded.
3. Half price, a few days a year
Start with the six sectors where promoter shares never join the ordinary line. Here the promoter line is a market of its own and its prices tell us what the restriction costs.
We matched every promoter symbol in merolagani’s company list to its ordinary share and pulled the daily price and volume history of both for the year to 14 October. Fifty-nine promoter lines had a recorded price in that period. For each we took the last promoter-line price and divided it by the ordinary share’s close on the same day.
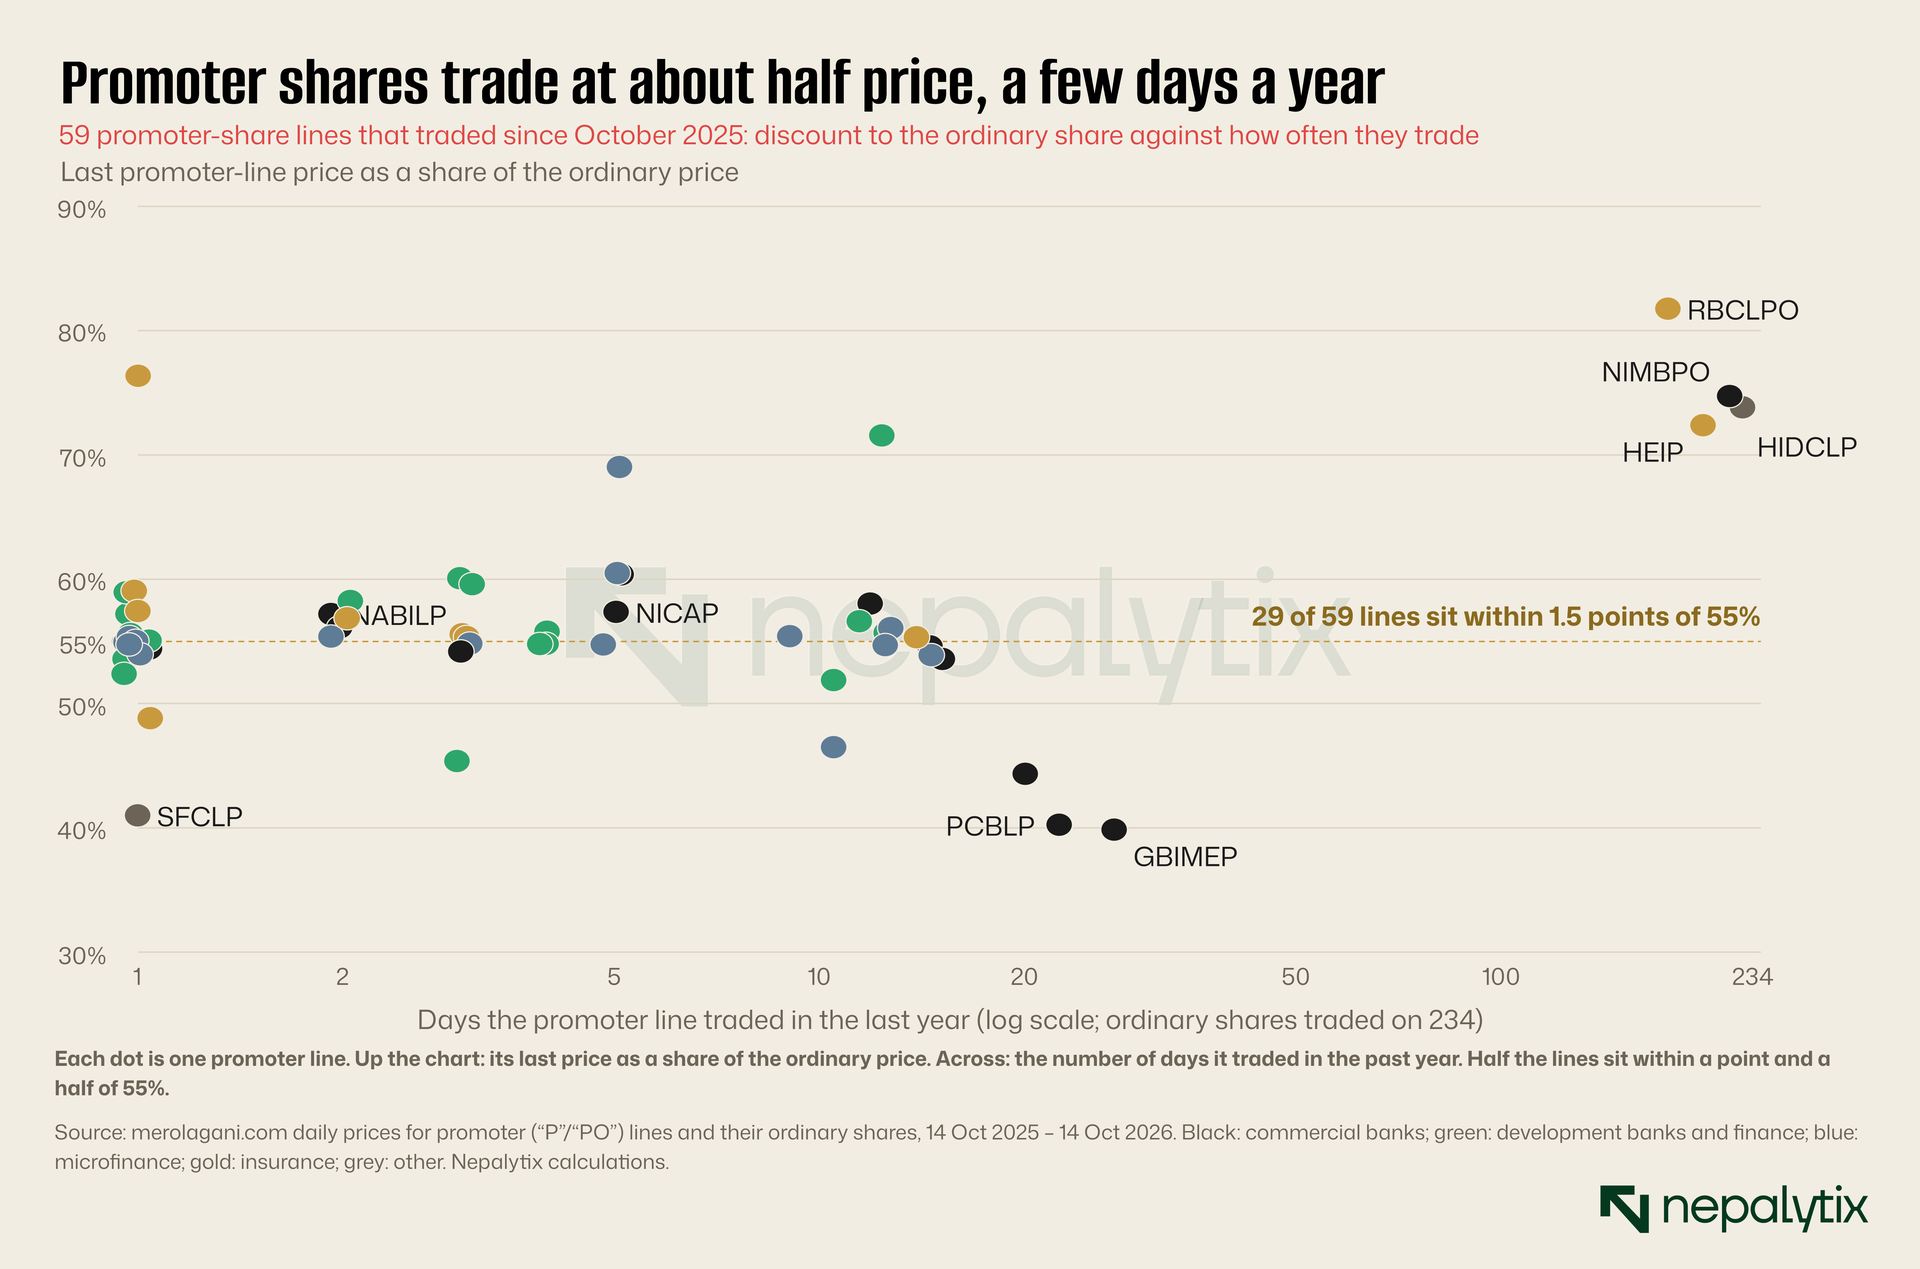
The median promoter line trades at 55.4% of the ordinary price. That number is remarkably stable. Twenty-nine of the 59 lines, almost exactly half are within 1.5 percentage points of 55%. The range runs from 40% for GBIMEP and PCBLP, the promoter lines of Global IME Bank and Prime Commercial Bank, to 82% for RBCLPO, the promoter line of Rastriya Beema Company. Nabil’s promoter shares last traded at 57% of the ordinary price and NIC Asia’s at 57%.
The clustering around 55% is not what a free market in a minority, illiquid, non-convertible security would produce. Discounts on such securities usually vary with the company’s quality, dividend yield and the size of the stake for sale. A tight cluster suggests an anchor. One plausible anchor is the old rule described by market commentators, that capped promoter-share listing prices at 50% of the ordinary price. Promoter sales in BFIs also go through a notice process that gives existing promoters first refusal. Together these mean the price is often negotiated between related parties and printed on the exchange rather than found by open bidding. The discount is real money to the seller. It is not obviously a market-clearing price.
The second axis of the chart is the more striking one. The median promoter line traded on three days in the past year. The ordinary shares of the same companies traded on all 234 sessions. Fifty-two of the 59 lines traded on 15 days or fewer. Only four traded nearly every day: HIDCLP, the promoter line of Hydroelectricity Investment and Development Company; NIMBPO, Nepal Investment Mega Bank; HEIP, Himalayan Everest Insurance and RBCLPO. These four are also the four with the smallest discounts between 72% and 82% of the ordinary price. Liquidity and price go together as one would expect: the lines that trade freely are valued closer to the ordinary share.
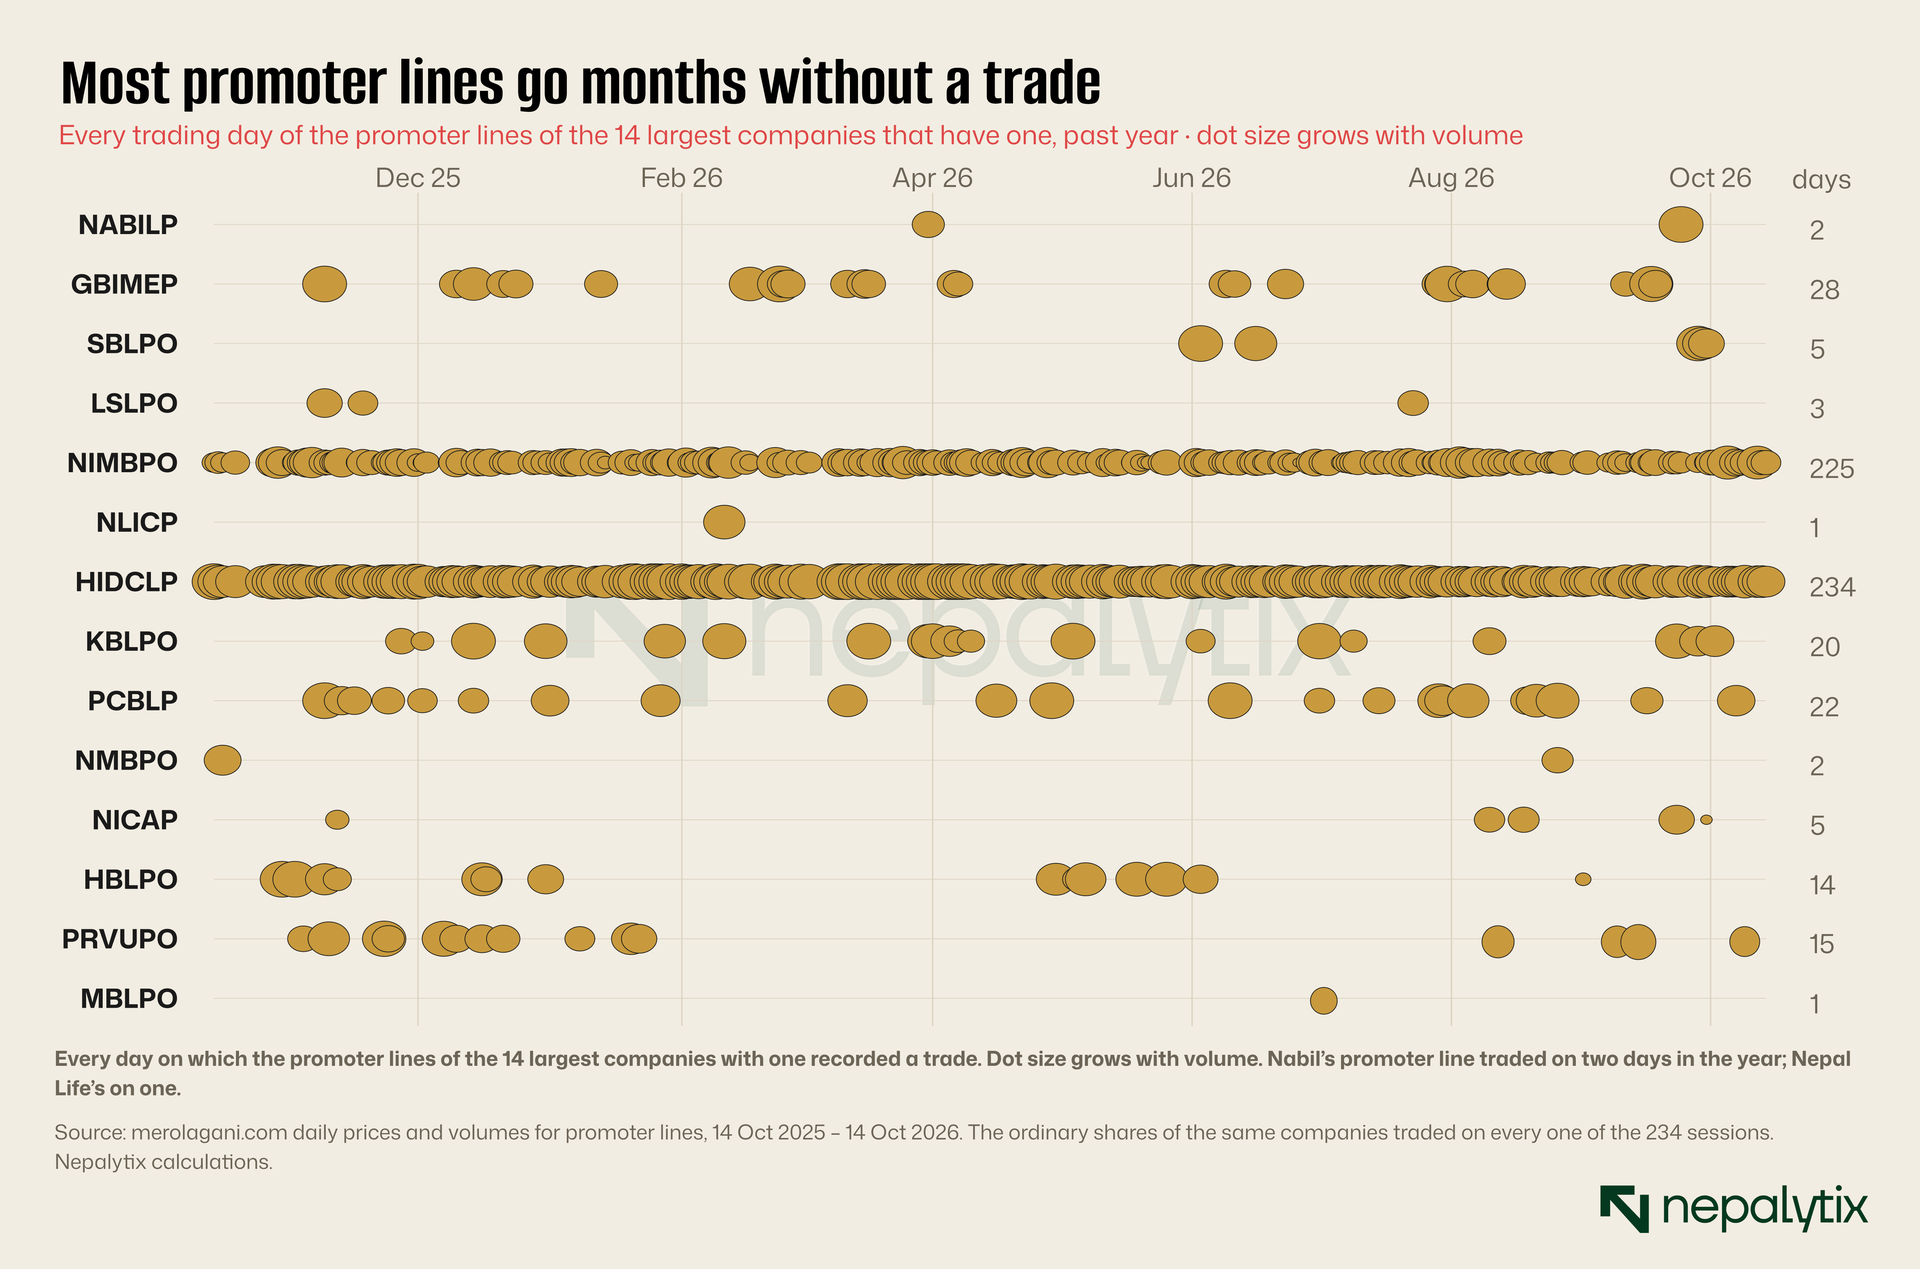
Volume tells the same story. For the median promoter line, a year’s trading volume came to 3.1% of the ordinary share’s volume. That is against a promoter stake that is usually as large as or larger than, the public float. A promoter who owns half a bank and wants to sell faces a market in which a few hundred thousand shares a year change hands at roughly half the price the newspapers quote for the bank.
Put those two facts together and the promoter stake in the six dual-line sectors looks very different from its headline value. At the ordinary price it is worth Rs 1.36 trillion. At the median promoter-line price it would be worth about Rs 750 billion and the volume that has actually traded at that price in the past year would not clear more than a small fraction of it. This is the economic case promoters make for merging the lines. It is a fair case as far as it goes. It is also as the next sections show exactly why the public resists.
4. Why there are two lines
The separation of promoter and ordinary shares has two layers: a lock-in that applies to every company and a permanent separation that applies to the financial sector.
The lock-in comes from the Securities Registration and Issue Regulation 2073. Section 38 bars promoters from selling their shares for three years after the company’s securities are allotted in its public issue. The logic is the standard one for new listings. Promoters know more about the company than the IPO subscribers. Making them keep their stake for a period after the float aligns their incentives with the public’s and stops a founder from selling out on the strength of an inflated IPO price. Three years is long by regional standards. In India, in most cases, the minimum promoter lock-in after an IPO is 18 months for the required minimum contribution and six months for the rest.
Once the three years are over, the regulation says nothing more for most companies. Promoter shares in a hydropower company, a hotel or a cement maker can then be converted into ordinary shares, credited to the same ISIN and sold on the open market. That is the process that produced the 31 hydro companies with no promoter class.
The financial sector is different. For banks and financial institutions the governing law is the Bank and Financial Institutions Act and the regulator is Nepal Rastra Bank. NRB requires promoters to hold at least 51% and to keep their identity as promoters: a promoter share sold to a member of the public remains a promoter share, held by a new promoter. The buyer of a bank promoter share therefore steps into the promoter group, with the same restrictions. Until December 2025 any promoter purchase needed NRB approval. Since then, buyers ending up with 2% or less of a bank no longer need it but they still need to be eligible to be a promoter and still go through a 35-day public notice that gives existing promoters first refusal. BAFIA also contains a provision that would let promoters sell down after ten years. NRB has never implemented it.
Insurers follow a similar logic under their own regulator. The result is that, in these six sectors, the separation is designed to be permanent. The promoter line exists precisely so that promoter shares can change hands without leaving the promoter group.
Two features of the system make it more restrictive in practice than on paper. The first is the separate ISIN. In Nepal, promoter and ordinary shares of the same company are registered as two different securities with two International Securities Identification Numbers in the central depository. That is why they trade on two lines. The neighbouring markets do it differently. India, Bangladesh and Pakistan record promoter and public shares under one ISIN and keep promoter status as a flag on the holding rather than as a separate security. In Nepal, the split exists in the plumbing not just the rulebook.
The second is the absence of any route out for financial-sector promoters other than selling to another promoter. Once a bank’s promoter shares are on their own line, the only buyers are people willing to become bank promoters on the regulator’s terms. That is a small pool and it explains much of the illiquidity in Exhibit 4.
5. The fight over one ISIN
For the companies outside the financial sector, the lock-in is supposed to end cleanly after three years. For much of the past eighteen months it did not because the plumbing got in the way.
In July 2025 CDS and Clearing, the central depository, proposed moving to a dual-ISIN system for all listed companies in which promoter shares would keep their own identifier even after the lock-in. The Independent Power Producers Association, the hydropower lobby, objected. By its estimate, the proposal would have kept 870 million shares worth Rs 87 billion in 58 companies on a separate line including 530 million shares worth Rs 53 billion in 47 hydro projects whose lock-in had already ended. Its argument was that hydro promoters, unlike bank promoters had invested on the understanding that their shares would become ordinary shares after three years.
The dispute was still open in February 2026. The Kathmandu Post reported that about a dozen companies whose lock-in had ended since January had been unable to convert their promoter shares at all. In June it reported something more telling. Hydro promoters who sat on company boards were resigning their board seats so that they could sell. Insiders face a one-year ban on trading after leaving office but promoters were willing to wait out the ban rather than stay locked. The same report cited a study by the Securities Board of Nepal, SEBON. It found promoters had already sold down in 20 of 43 hydro companies examined and recommended that promoters keep at least 30% for seven years.
SEBON resolved the main question in early September. Its decision as reported by ShareHub and Merolagani, allowed promoter shares whose lock-in had ended to be merged into the ordinary ISIN from 1 September 2026. CDSC was to start the conversion for the companies affected. The reports said the founder shares of 36 companies remained locked. Two weeks later NepseTrading reported what it called a flood of promoter shares into the secondary market and SEBON introduced a new requirement. Any holder of 5% or more of a company now has to give 15 days public notice before selling. On 6 October, investor groups met SEBON to discuss the notice rule. As of this writing no further decision has been published.
The September decision settled the plumbing for non-financial companies. It did not touch the financial sector where the separation remains a matter of NRB policy. And it did not answer the question at the heart of the dispute: what happens to a share price when a block of promoter shares two or three times the size of the public float becomes saleable? Both sides argued about that question as if the answer were obvious. Promoters argued the market would absorb the shares. Investors argued it would collapse. The data can tell us which is closer to right.
6. What happens at the unlock
We can observe the answer directly, because outside the financial sector the lock-in has been ending for years. Every company that listed through an IPO had its promoter shares locked for three years from allotment. For each company in the ShareSansar IPO register we took the latest allotment date, added three years and treated that as the unlock date. We kept companies outside the six dual-line sectors since only there do unlocked promoter shares join the ordinary line. We dropped those without enough price history to observe 60 sessions either side. That leaves 88 lock-in expiries between 2016 and September 2026. Seventy-six of them are hydropower companies which is itself a fact about the Nepali market: hydro has been the main source of new listings for a decade.
For each expiry we tracked the share price, adjusted for bonus and rights issues, from 60 sessions before the unlock to 60 sessions after. We divided it by NEPSE so that a general market fall does not show up as an unlock effect. Then we compared the result with 768 random windows of the same length in the same stocks. The comparison is the important step. Nepali small caps drift and swing a great deal. Without a control it is easy to mistake an ordinary three-month move for an event.
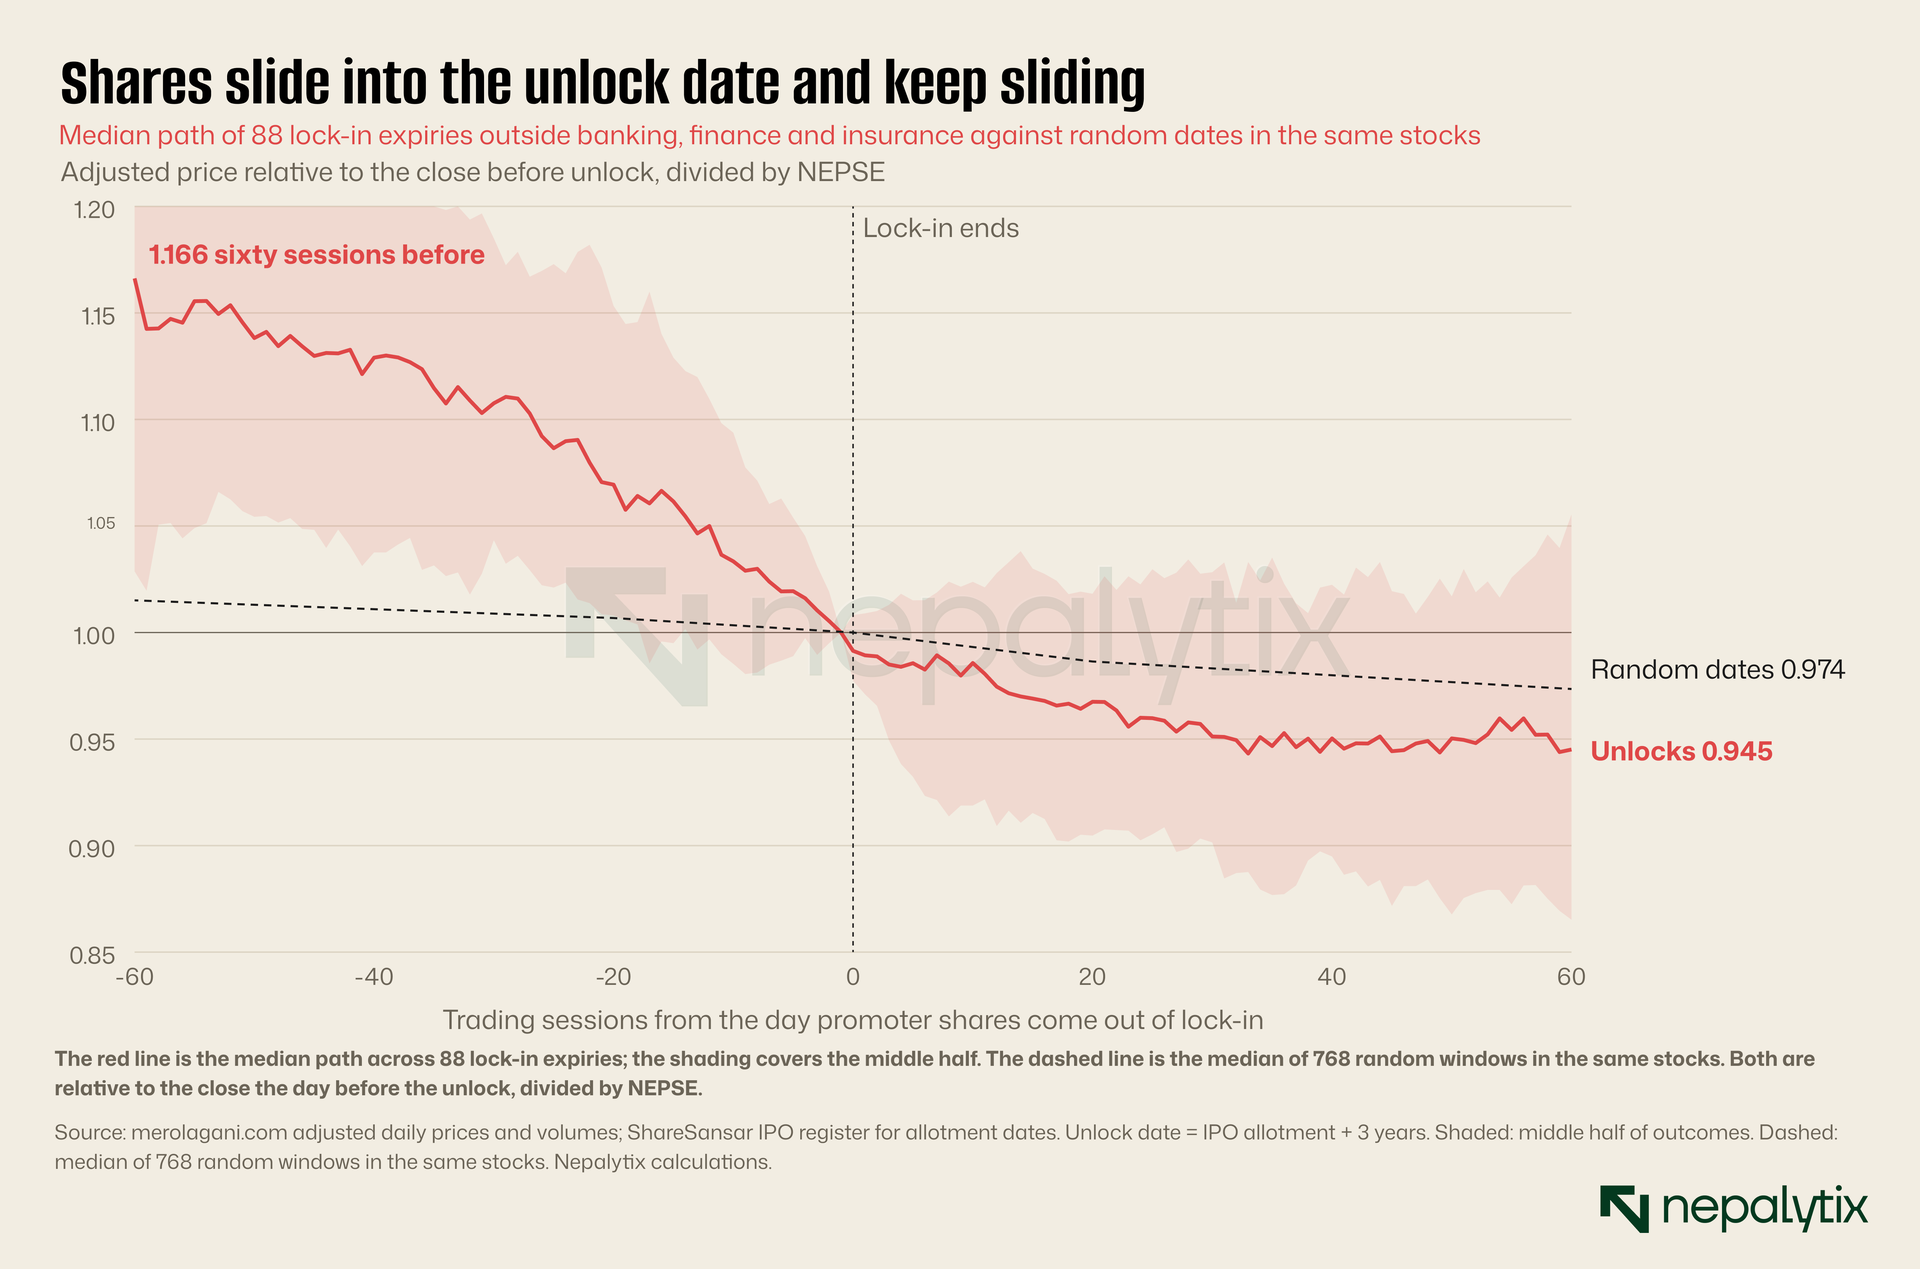
The pattern is clear and it is not what either side of the ISIN argument predicted. The median stock does not collapse when its promoter shares unlock. It slides steadily for three months before the unlock and keeps sliding more gently afterwards.
Sixty sessions before the unlock, the median stock stood 16.6% above its level on the eve of the unlock, relative to NEPSE. By 20 sessions before, it was 6.9% above. On the unlock day itself the median move was −0.9%. Twenty sessions after, the median stock was 3.2% below its pre-unlock level; sixty sessions after 5.5% below. Over the whole 120 sessions, the median stock lost 13.5% relative to the index and 86% of the 88 stocks fell.
The random windows look nothing like that. Over the same 120 sessions, the median random window lost 1.7% relative to NEPSE and 53% fell, close to a coin toss. None of the placebo draws we ran produced a median as low as the unlock median. The slide is not the background drift of small hydro stocks. It is specific to the months around the unlock.
Hydropower stocks do move together. One fair objection is that the unlock sample is mostly hydro and hydro may simply have underperformed NEPSE during these windows. We re-ran the test dividing each hydro stock by the hydropower sub-index instead of NEPSE. The shape survives. The median stock still starts 15.2% above its eve-of-unlock level 60 sessions before and ends 6.7% below it 60 sessions after.
The volume record shows that something real happens on the date.
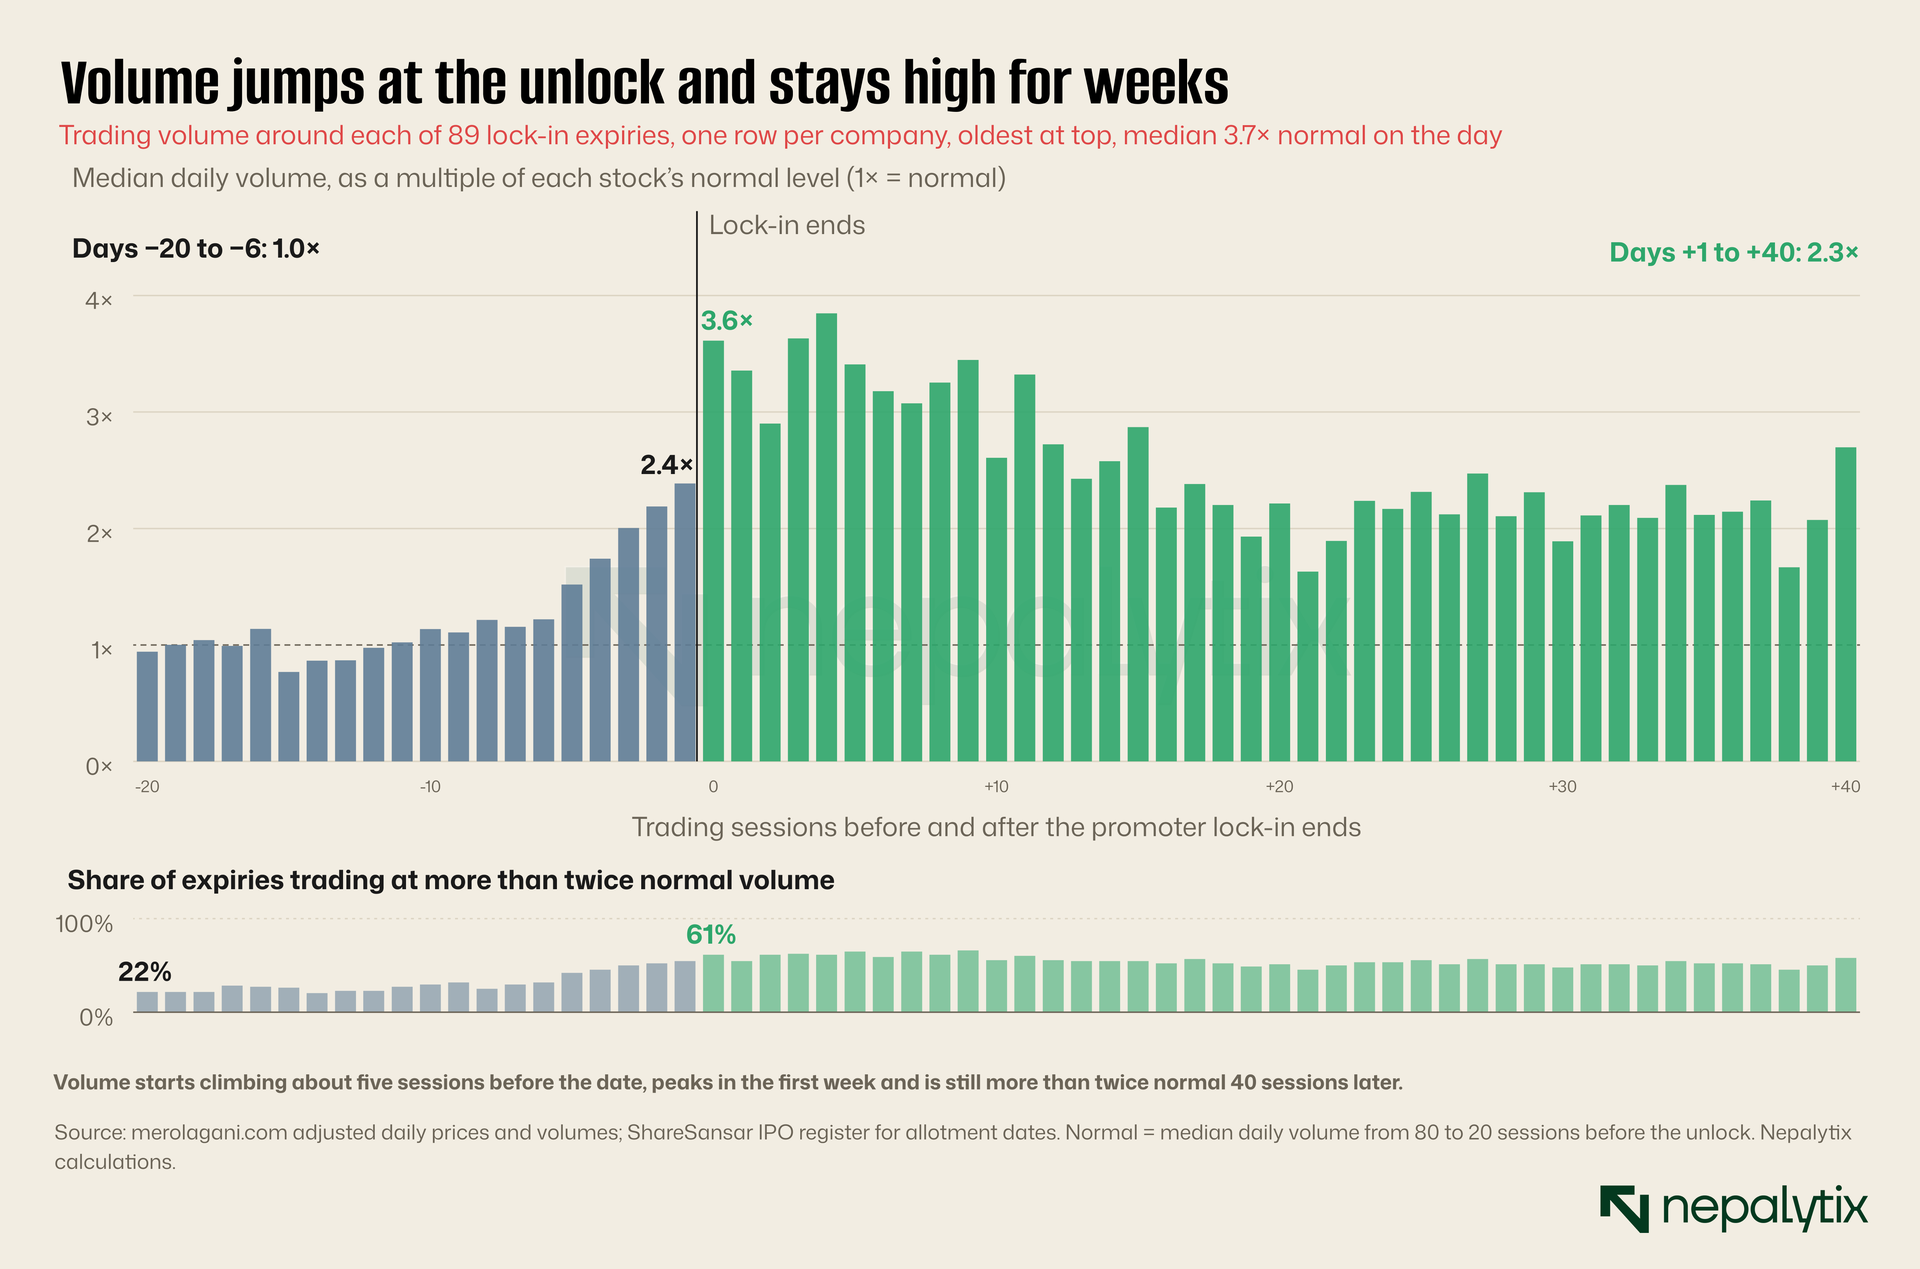
For the median stock, volume on the day before the unlock was 2.4 times its normal level. On the unlock day it was 3.6 times; the day after, 3.4 times. Five sessions after, it was still 3.4 times normal and ten sessions after, 2.6 times. In 61% of cases, volume on the unlock day was more than double the stock’s normal level. Volume starts climbing about five sessions before the date, peaks in the first week and is still more than twice normal 40 sessions later. For a stock whose float is suddenly two or three times larger, that is what one would expect: the new supply has to change hands somewhere.
The surge has been bigger in the recent cohort. Since 2024, 47% of sessions in the 40 days after an unlock have run at four times normal volume or more, against 25% before. Two things changed. The market got much more active so the volume available to absorb promoter sales rose. And the companies unlocking in 2024–26 listed in the 2021–23 IPO wave, many of them small hydro projects at the top of a speculative run. Their promoters had more reason to sell.
7. Before, not after
The most useful finding for an investor is about timing. The unlock is not a shock that arrives on the day. It is an event everybody can see coming three years ahead and the price behaves accordingly.
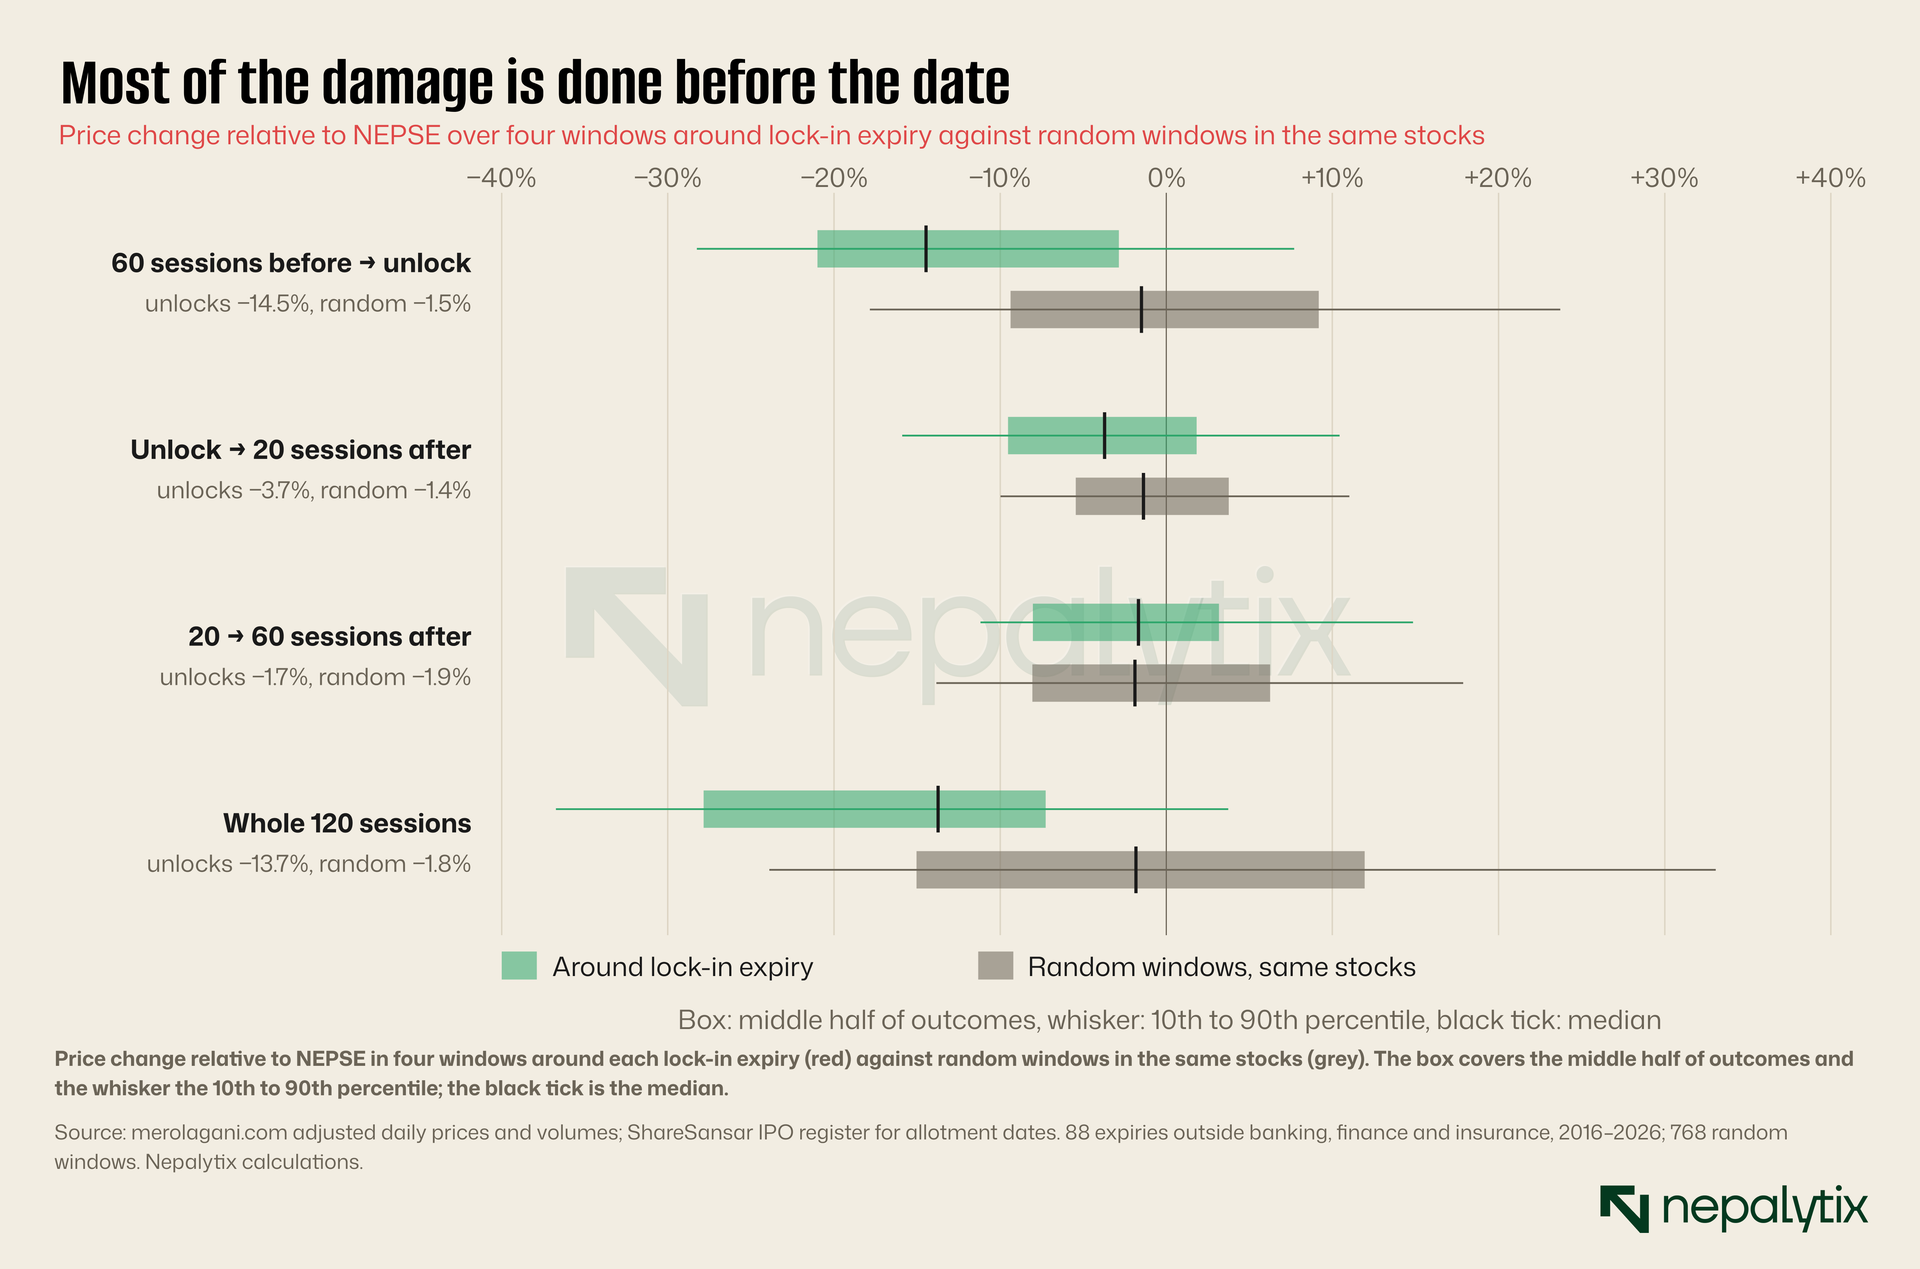
Split the 120 sessions into pieces and the timing becomes plain. In the 60 sessions before the unlock, the median stock lost 14.5% relative to NEPSE against 1.5% for random windows. In the first 20 sessions after the unlock it lost 3.7%, against 1.4% for random windows. In the next 40 sessions it lost 1.7%. That is indistinguishable from the 1.9% lost by random windows over the same span. By two months after the date, the unlock effect is over.
So most of the damage about three-quarters of it is done before the promoter shares can legally be sold. That is not as paradoxical as it sounds. The unlock date is public. It is three years after an allotment that was itself announced and widely reported. Anyone who expects promoters to sell has every reason to get out first. So does anyone who expects others to get out first. The lock-in creates a known date on which supply will rise and the market prices that supply in advance. By the time the promoter shares arrive, much of the selling they were expected to cause has already happened, done by public shareholders anticipating them.
Some of the pre-unlock decline may also have nothing to do with the unlock. Unlocks fall three years after an IPO. Our Long Read on IPO allottees found that newly listed Nepali companies tend to drift down relative to the market for some time after their listing run. A stock that is still deflating from its listing premium three years later would show a decline in the 60 sessions before its unlock whether or not anyone cared about the date. We cannot fully separate the two. The random windows are drawn from the same stocks and so carry some of the same post-listing drift which is why the placebo median is slightly negative. But they are drawn from the whole of each stock’s history not only from year three. The gap between the unlock windows and the random windows is therefore an upper bound on the unlock effect. The true effect is probably smaller but not much smaller: the volume spike in Exhibit 6 shows that the date itself matters to traders.
We ran three further tests.
Has it got worse? Yes. Of the 34 unlocks up to the end of 2023, 76% fell over the full window, with a median decline of 9.4% relative to NEPSE. Of the 54 since the start of 2024, 93% fell with a median decline of 18.2%. The post-unlock part of the window is about the same in both periods: the median stock was 4.9% below its eve-of-unlock level 60 sessions later before 2024, and 5.7% below it since. What has changed is the run-in. The recent unlock cohort is the 2021–23 IPO wave, the period in which small hydro IPOs routinely tripled on listing. These stocks had further to fall and more holders who had bought them for the listing run rather than for the business.
Does a bigger promoter stake mean a bigger fall? Not that we can detect. Among the 57 events for which the tearsheet still records a promoter holding, companies with promoter stakes of 70% or more were 5.3% below their eve-of-unlock level 60 sessions later. Those with smaller stakes were 5.5% below. The test is weak: the tearsheet records today’s holding, not the holding at the unlock and the companies with no recorded promoter class drop out entirely. But it is consistent with the timing result. If the selling is mostly anticipatory, the eventual size of the promoter overhang matters less than the fact that there is one.
Is it a few disasters? No. The worst cases are severe. TSHL lost about half its value relative to NEPSE across its 2026 unlock window, and BHL, BEDC and SMHL each lost between 40% and 46%. But the result does not depend on them. Eighty-six per cent of all events fell and the median is a fall of 13.5%. The best cases, such as KPCL and PMHPL, both of which rose about 46% relative to NEPSE, unlocked in mid-2021 when the whole hydro sector was rising fast.
The practical implication for a holder of a hydro stock approaching its third listing anniversary is uncomfortable. The time to worry is not the week of the unlock; it is the quarter before. And the evidence says that by the date itself, the expected fall has mostly happened.
8. September in practice
The unlock study covers companies that converted promoter shares in the ordinary way after three years. The September ISIN decision added a new group: companies whose lock-in had already ended but whose promoter shares had been stuck on a separate ISIN while CDSC and the hydro lobby argued. For them, conversion happened all at once and the date, 1 September was set by the regulator rather than by the company’s IPO calendar.
NepseTrading identified six companies whose promoters filed notices to sell soon after the merger. At Emerging Nepal, an investment company, 12 promoters gave notice to sell 2.62 million shares about 52% of the promoter stake. At Kalinchowk Darshan, the cable-car operator, promoters offered 1.34 million shares. Promoters of Modi Energy offered 472,000 shares, Bhagawati Hydropower about 350,000 and Upper Hewakhola 134,000. At Swet-Ganga Hydropower, the Dolma Impact Fund, a promoter announced its exit.
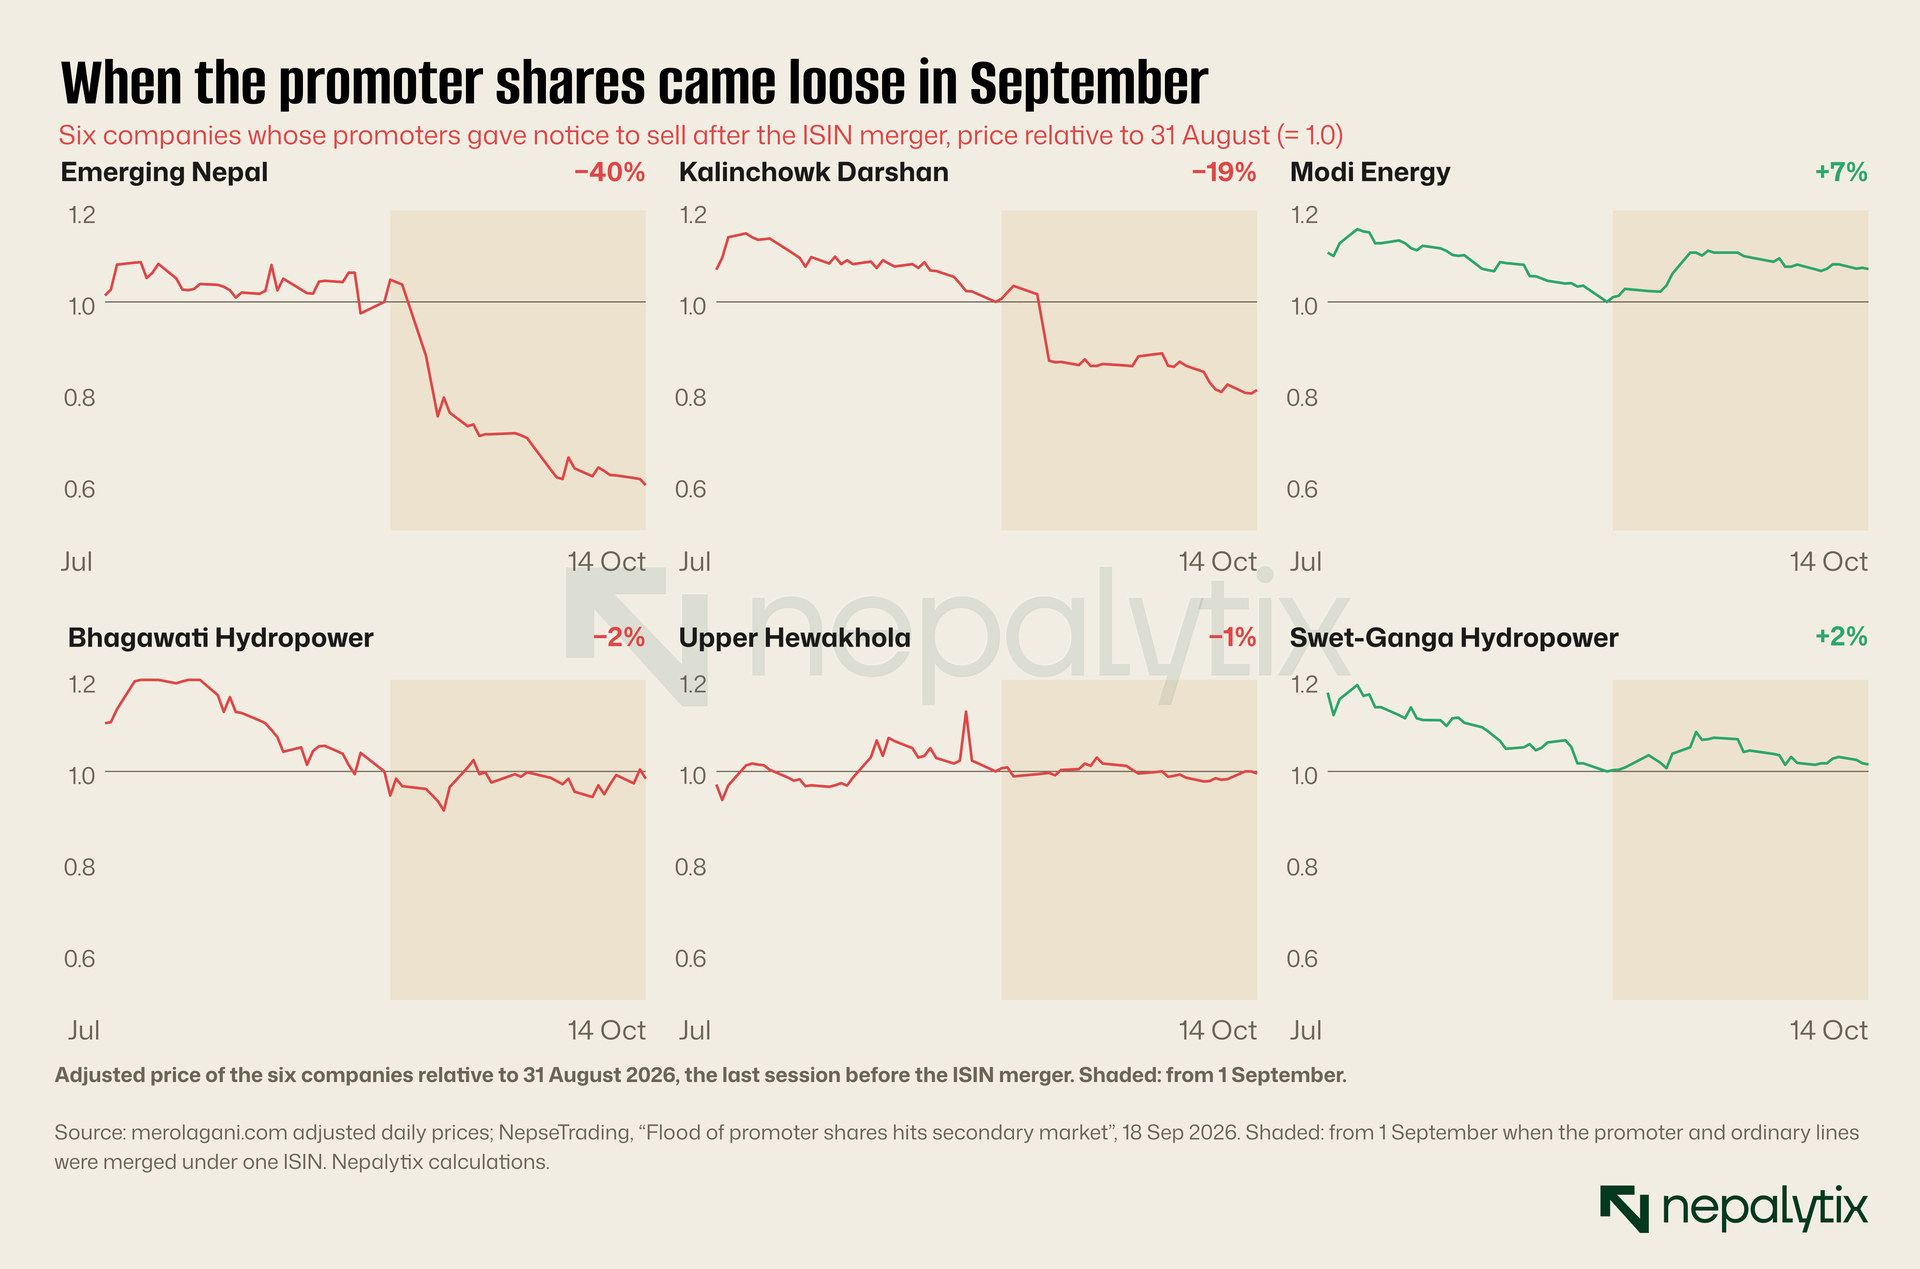
Two of the six fell hard. Emerging Nepal closed on 14 October 40.1% below its 31 August price, 42.2% below after allowing for NEPSE’s move. Its volume in the weeks after the merger was 68 times its normal level. Kalinchowk Darshan fell 19.3%, on volume 20 times normal. The other four barely moved. Modi Energy rose 7.2%, Swet-Ganga 1.5%; Bhagawati fell 1.6% and Upper Hewakhola 0.5%.
The split is instructive. Emerging Nepal and Kalinchowk Darshan were the two cases where the promoter sale was large relative to the float. At Emerging Nepal more than half of the promoter stake was on offer at once, from a dozen sellers. Kalinchowk Darshan’s was the second-largest offer of the six. The four hydro companies had smaller offers and three of them, Modi Energy, Bhagawati and Swet-Ganga had already fallen 14–20% from their July highs by 31 August as Exhibit 8 shows. That drift is the same anticipatory pattern the event study finds. By 1 September, much of the expected selling had been done by public holders.
The six cases also show why the 15-day notice rule appeared so quickly. Before September, a promoter in a non-financial company could convert and sell without warning. The ordinary market would learn of the sale only from the trades themselves. The notice rule turns every large sale into a public event with a date. On the evidence of the event study, that will tend to move the price fall earlier into the notice period rather than prevent it. It may also make large sales harder to execute which is presumably why investors and promoters alike have asked SEBON to clarify how it will work. Both sides have a point. Advance notice protects the public from being surprised. It also gives every other holder a reason to sell first.
9. The next wave
Forty companies still have promoter shares inside their three-year lock-in, according to nepsetrading’s lock-in schedule. Valued at today’s prices where the stock already trades, those shares are worth Rs 355 billion. Their release is spread over the next two and three-quarter years but unevenly.
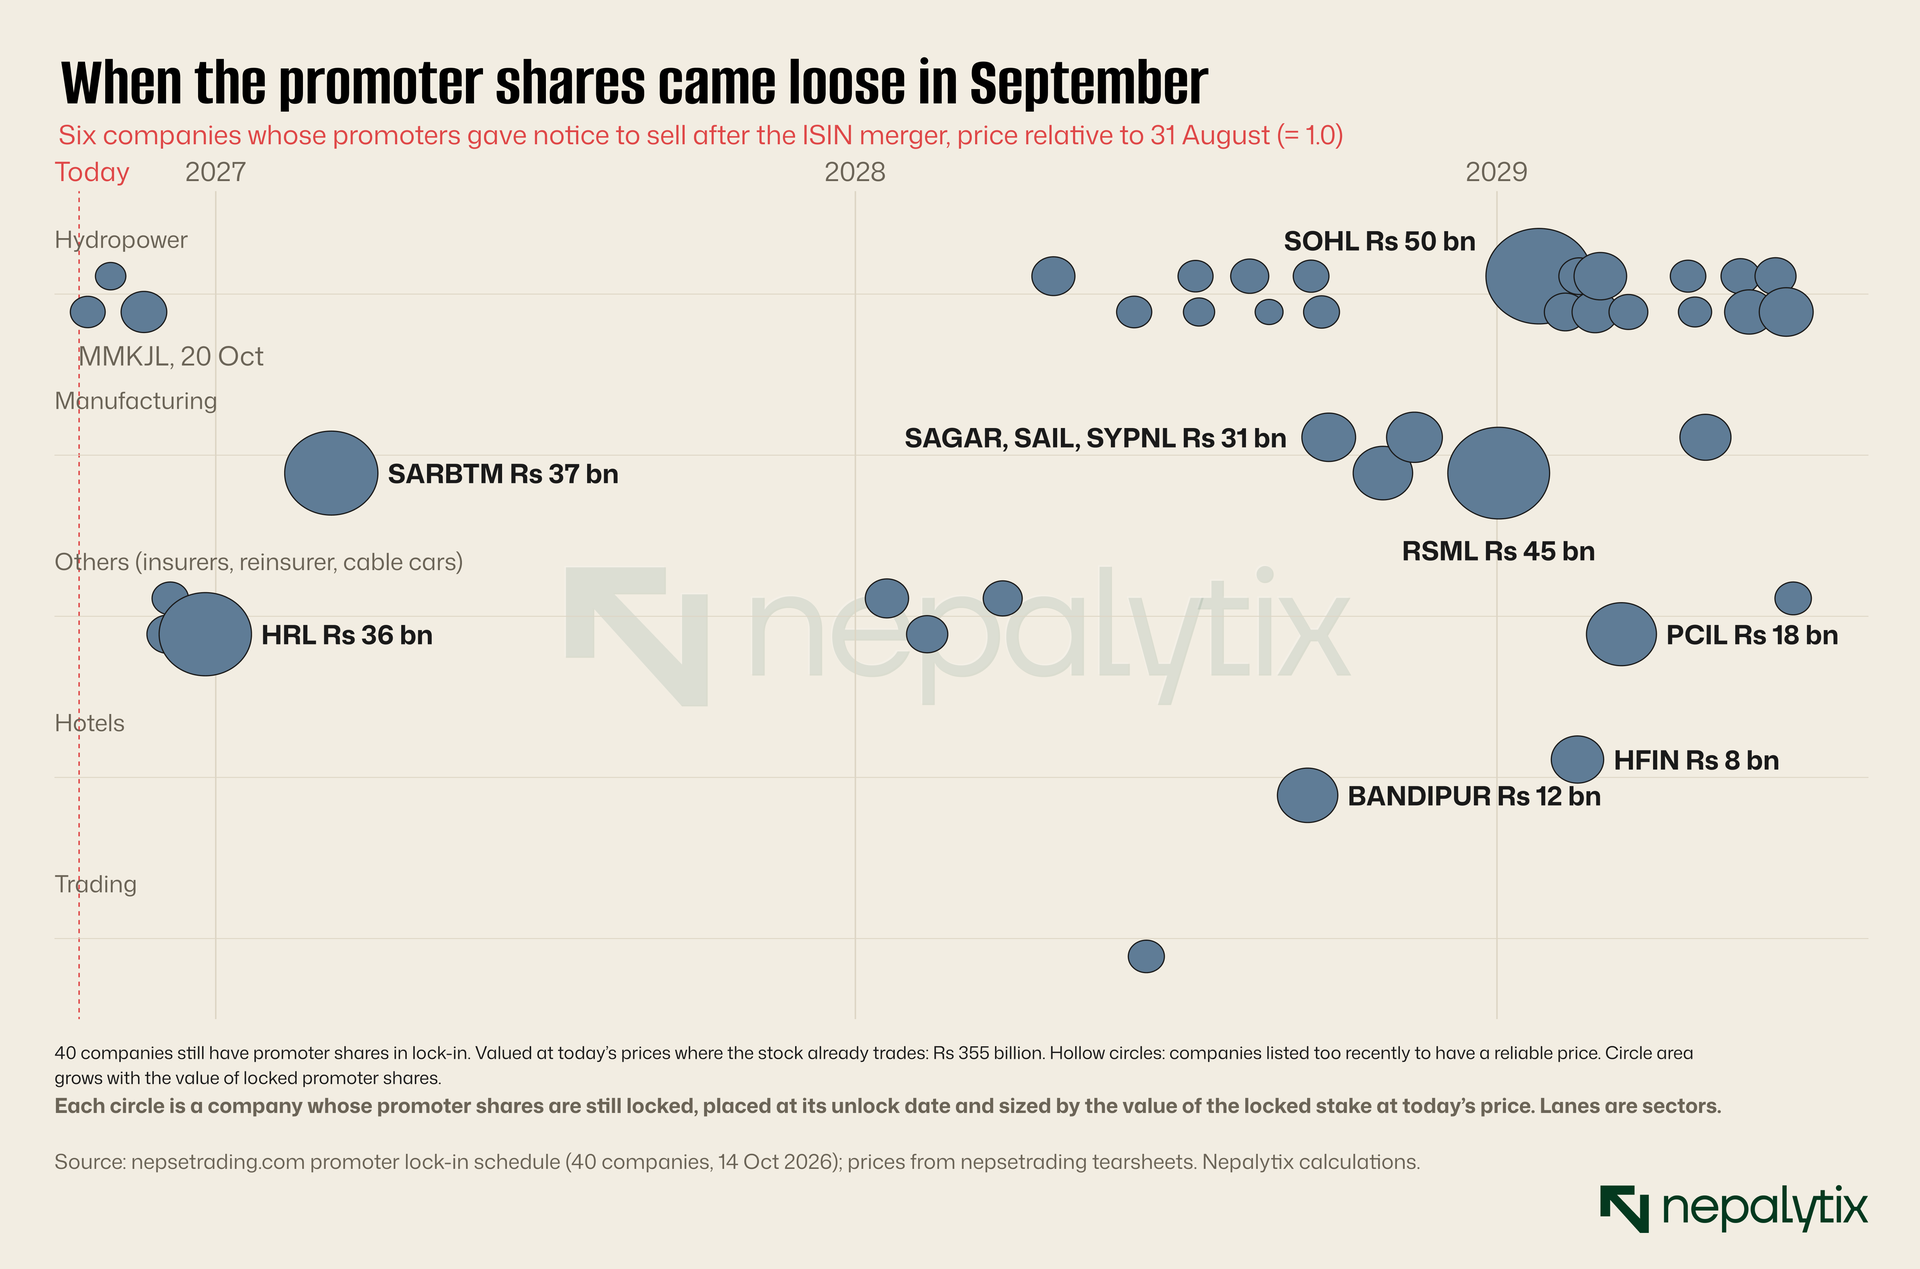
The near term is light in number and heavy in value. Six companies unlock before the end of 2026. The first is Mathillo Mailun Khola Jalvidhyut on 20 October with 7 million promoter shares worth about Rs 2.4 billion. That date falls inside the Dashain closure, which runs from 17 to 25 October so the earliest session at which the shares could trade is 26 October. Chirkhwa Hydro Power follows on 2 November and Vision Lumbini Urja on 21 November. Muktinath Krishi and Nepal Warehousing unlock on 5 and 6 December.
The large one is Himalayan Reinsurance on 26 December: 76.1 million promoter shares, 70% of the company worth about Rs 35.9 billion at the current price of Rs 472. That is 2.3 promoter shares for every public share now trading. Himalayan Reinsurance is classified under “others” in the lock-in schedule rather than under insurance. Whether its promoter shares will join the ordinary line as in other non-financial sectors, or move to a separate promoter line as with insurers, the schedule does not say. The answer matters a great deal to the stock, and holders should look for it in the company’s and the regulator’s notices before December.
Sarbottam Cement follows on 8 March 2027 with 45.5 million promoter shares worth Rs 36.7 billion: 87% of the company or 6.8 promoter shares for every public one. That is the highest ratio in the next-twelve list and one of the highest in the market.
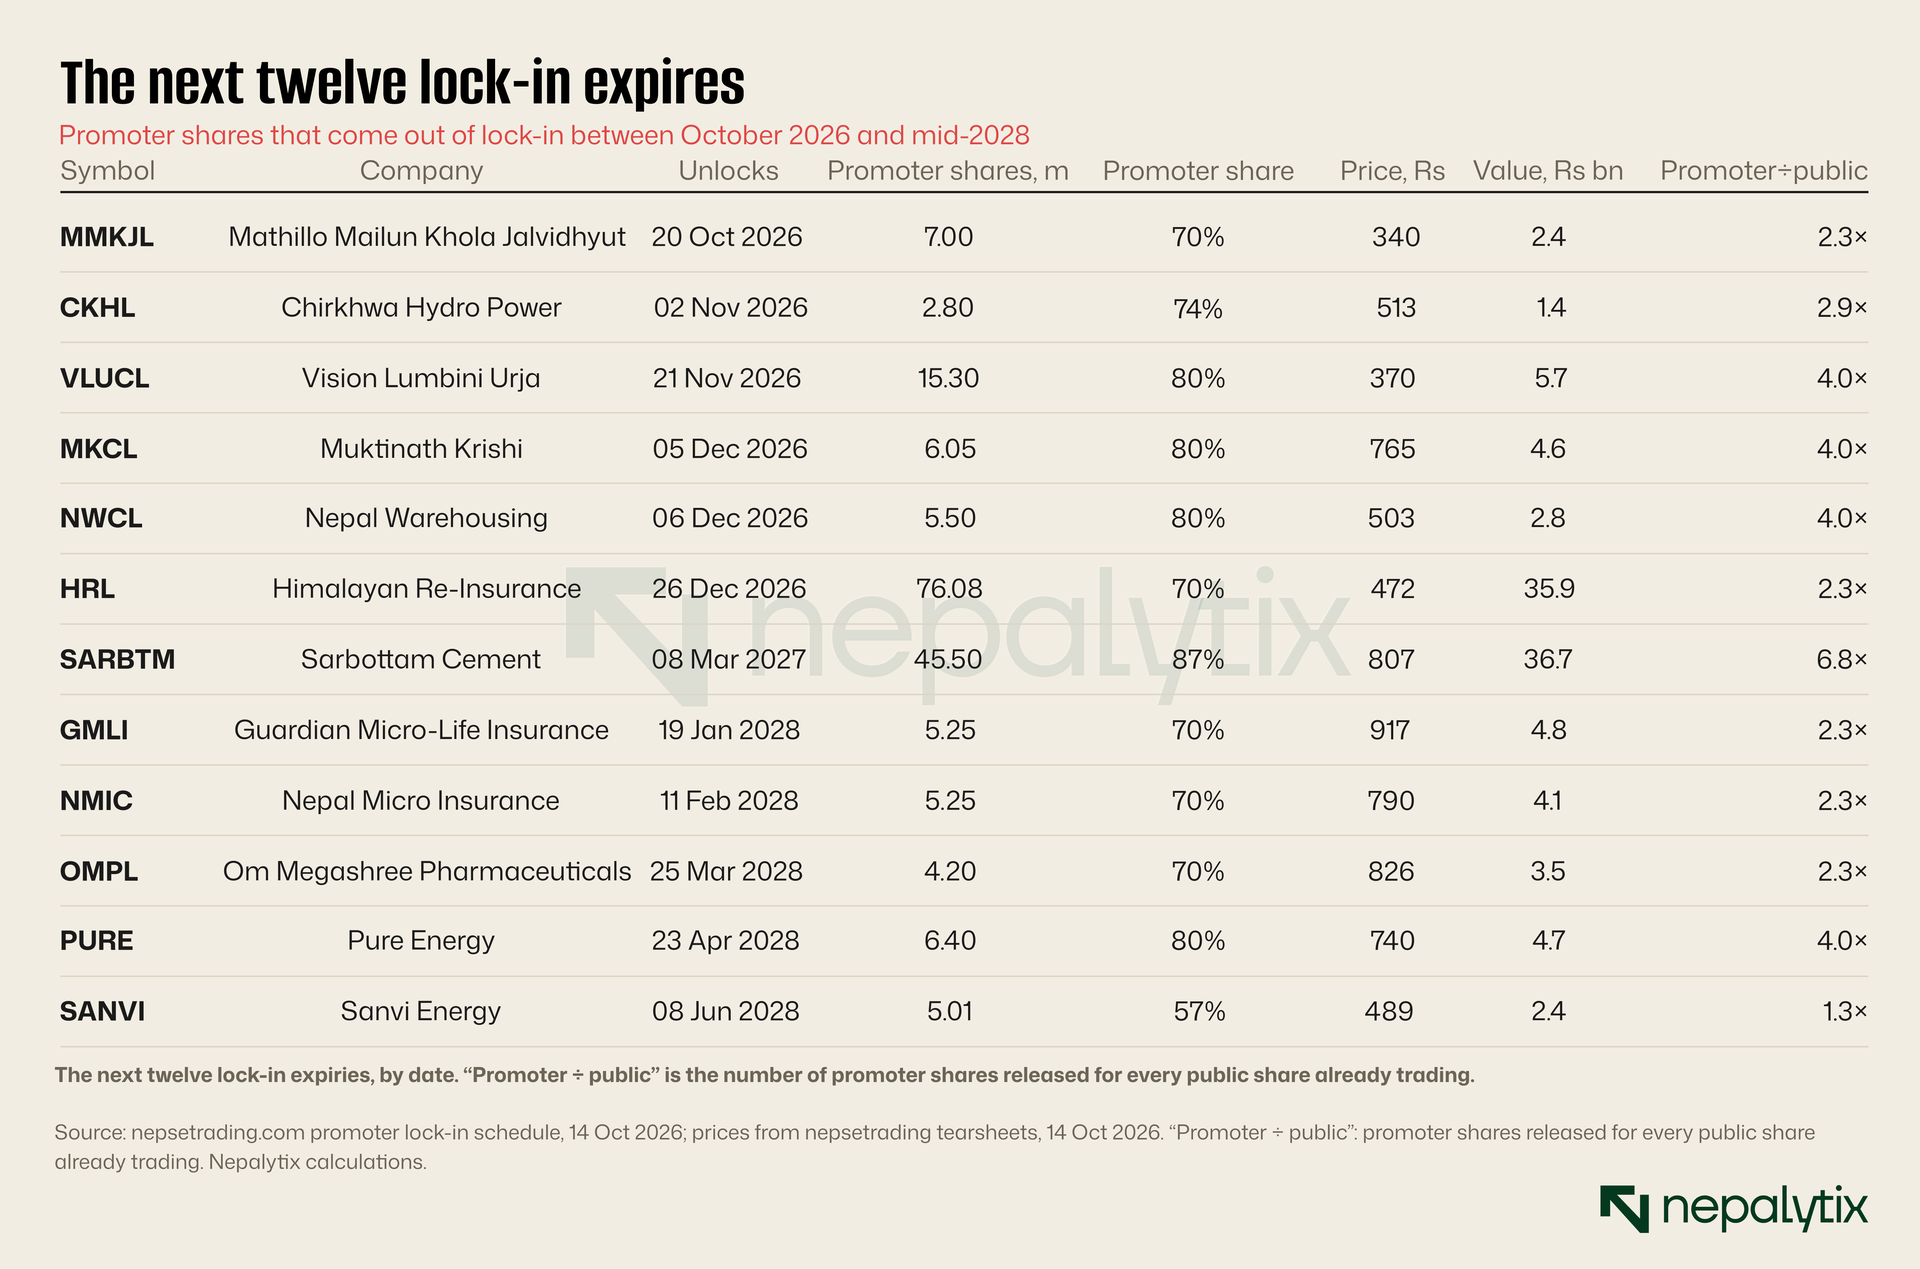
After Sarbottam, the calendar goes quiet for ten months. Then the 2025 IPO cohort starts to unlock in 2028: two micro-insurers and a pharmaceutical maker in the first quarter then a run of small hydro projects through mid-2028. The heaviest stretch is from late 2028 to mid-2029. Three manufacturers, SAGAR, SAIL and SYPNL unlock between September and November 2028 with about Rs 31 billion between them. Then come RSML on 2 January 2029 worth about Rs 45 billion and SOHL on 25 January, the single largest stake on the schedule at about Rs 50 billion. Seventeen of the 40 unlocks fall in the first half of 2029.
If the event study holds, the price pressure for each of these will arrive in the quarter before its date. For Himalayan Reinsurance, that quarter is now. For Sarbottam Cement, it begins in December. The test of the study and of whether the September changes have altered the pattern, will be what these stocks do between now and their unlocks.
10. What would help
The arrangement now in place satisfies nobody. Promoters in the financial sector hold an asset that trades at half price on a few days a year. Promoters elsewhere get three years of lock-in followed by a release that the market prices in partly at the public’s expense before it happens. Public investors see the free float swell without warning and they bear much of the price adjustment before a single promoter share is sold. And the regulator ends up arbitrating each new episode as it did in September, rather than administering a rule everyone understands.
Four changes would make the system more predictable without forcing a choice between promoters and the public.
A staged release instead of a cliff. The three-year lock-in releases the whole promoter stake on one day. The SEBON study cited in June recommended that promoters keep at least 30% for seven years. A schedule that released, say, a third of the promoter stake at three years, a third at five and the rest at seven would spread the supply across several dates. The event study suggests the price effect is concentrated in anticipation of a single, known date. Splitting that date in three should split the effect too and probably shrink it, because each tranche is smaller relative to the float.
A single ISIN with a flag. The neighbouring markets keep promoter status as an attribute of a holding not as a separate security. Nepal could do the same. Promoter shares would sit on the ordinary ISIN with a restriction flag that the depository enforces. Bank promoters would still be bound by NRB’s 51% rule and eligibility tests, but their shares would carry the same price as everyone else’s and the 45% discount would disappear from the system. The central bank would lose nothing in control. The September decision already took this route for non-financial companies. Extending it to banks requires NRB not SEBON.
Implement the BAFIA sell-down. The ten-year sale provision in the Bank and Financial Institutions Act exists and has never been brought into force. A rule that let bank promoters sell down above the 51% floor, or after ten years, on the ordinary line and subject to notice, would give the dual-line sectors a route out other than selling to another promoter at half price.
Publish the calendar properly. The data in this piece comes from three private aggregators and a register built by a news site. None of it is published in one place by the regulator or the depository. A machine-readable list of every lock-in with its unlock date, the number of shares and whether they will join the ordinary line or a promoter line would cost almost nothing. It would put every investor on the same footing as the ones who already track the dates. The 15-day notice rule is a step in this direction for large sales. A published calendar would do the same for the scheduled ones.
None of these would stop prices from falling when supply rises. They are not meant to. Promoter shares are real claims on the companies and the market should price them. The aim is to make the pricing orderly: spread across several known dates, done on one line and visible to everyone at once.
11. What this piece cannot tell you
Five limits apply to the numbers above.
The unlock dates are inferred. We take the latest IPO allotment date in the ShareSansar register and add three years. That matches the rule in Section 38 but individual companies may have converted later than the legal date. Some companies converted only after the September decision. Where the conversion came later, the true event falls after our date and our post-unlock window partly captures pre-conversion trading. That would tend to understate the effect on the actual conversion date.
The promoter percentages are current. The tearsheets record today’s shareholding. For companies whose promoter shares have already merged, the tearsheet shows no promoter class, and we cannot recover the stake at the time of the unlock. Emerging Nepal, for example now shows 0% promoter on its tearsheet. That weakens the promoter-size test in section VII and means the 61% market-wide figure is, if anything, an understatement of the promoter share before the recent conversions.
The post-IPO drift is not fully separated. As discussed above, unlocks fall three years after listing. Some of the pre-unlock decline may be the tail of the post-listing drift we documented in our IPO Long Read. The random-window comparison controls for this only in part.
Promoter-line prices are thin. A promoter line that traded on one day in the year has one price, and that price may reflect a negotiated transfer between related parties. The median discount of 45% is robust across many lines. The discount for any single line should be read as indicative.
September is six cases. The ISIN-merger exhibit shows what happened to six companies over six weeks. It is consistent with the event study but it is not independent evidence of the same weight. More conversions are under way and we will update the comparison when the next set of notices is published.
Disclaimer
This report has been prepared by Nepalytix for informational and educational purposes only and does not constitute investment advice, an offer, or a solicitation to buy or sell any securities.
The information contained in this report is based on sources believed to be reliable; however, Nepalytix does not guarantee its accuracy, completeness, or timeliness. Opinions, estimates, and projections expressed herein are those of the authors as of the date of publication and are subject to change without notice.
Investing in securities involves risks, including the possible loss of principal. Past performance is not indicative of future results. Readers are advised to conduct their own independent research and consult with a qualified financial advisor before making any investment decisions.
Nepalytix and its contributors may hold positions in the securities discussed in this report at the time of publication or thereafter.
Neither Nepalytix nor any of its affiliates accept any liability for any loss arising from the use of this report or its contents.