When Should You Sell an IPO?
We tracked 87 Nepali IPOs from their first trade. The result is striking: selling on listing day was the worst of six exit strategies tested while waiting often captured much more of the post-listing rise.

Eighty-seven par-value IPOs have listed on NEPSE since July 2019. We followed every one of them from the first trade. The answer to the question every allottee asks is the opposite of the one most of them act on. The exchange's opening rules are the reason.
An initial public offering in Nepal is for most of the people who receive shares, a lottery ticket that has already paid out. Retail applicants apply for a minimum lot usually ten shares at Rs 100 each. When the issue is oversubscribed as almost every issue is, a draw decides who receives anything. The winners have Rs 1,000 of shares credited to their accounts a few weeks later. On listing day those shares are usually worth three times what was paid for them. The question every winner then asks a broker, a relative or a social media group is the same. Do I sell now?
The conventional answer is yes. Take the profit, the argument goes; the price is high because the shares are scarce and once the scarcity passes the price will fall. Many allottees act on that view. Listing-day sell orders are common and the tiny number of shares that trade on listing day is mostly the result of allottees selling into a queue of buyers.
The question is answerable with data and it has not as far as we know been answered systematically in public. This is the listing-date table we have been proudicng in the Mon's Read series. It uses the full daily price history of every company that listed on NEPSE through a par-value IPO since the start of FY2076/77. For each company, it asks what a single allotted share would have been worth at each point after listing. It then compares selling at each of those points with the alternatives and compares the result with the market as a whole.
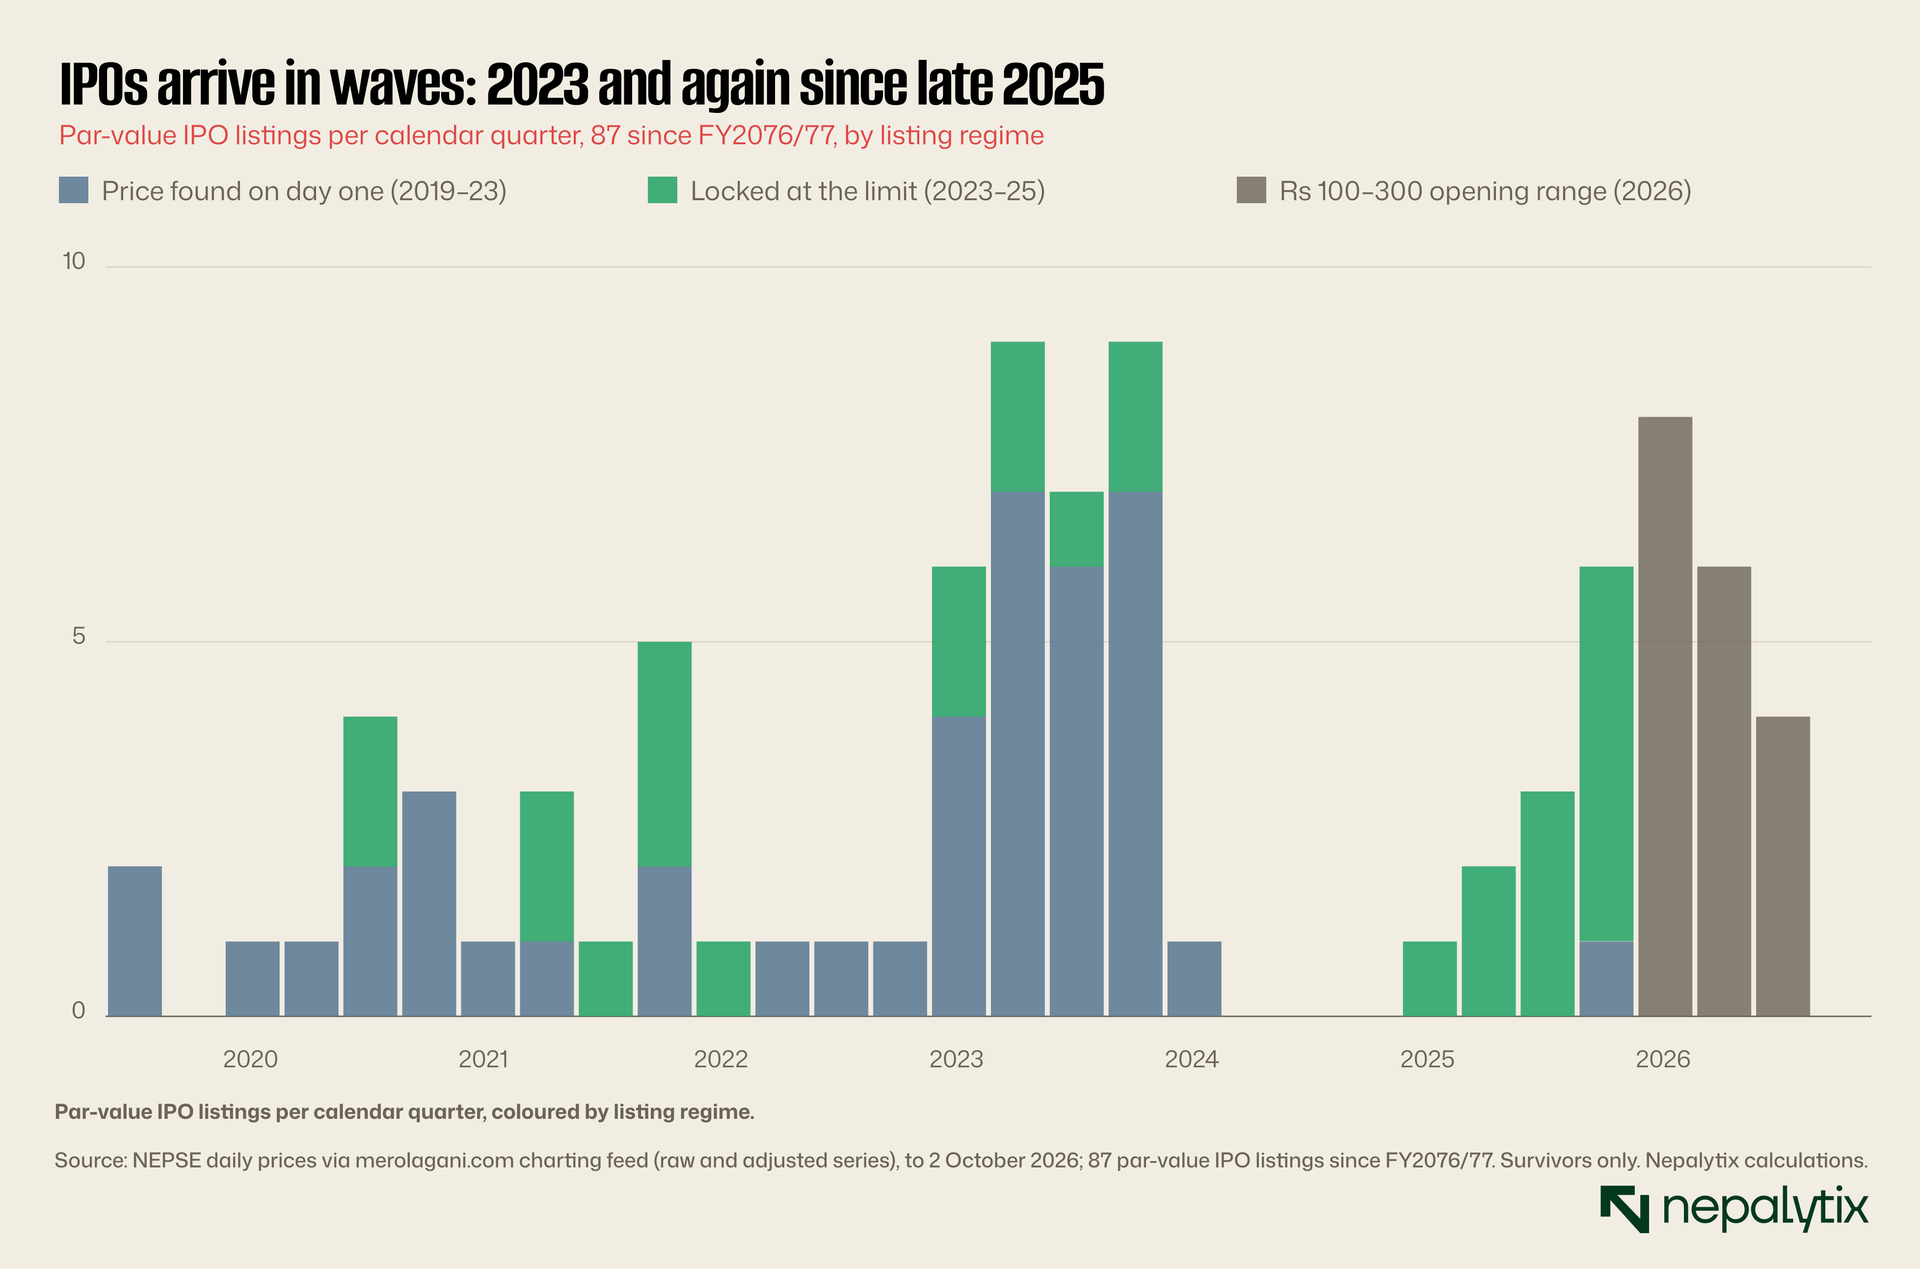
The sample is not spread evenly through time. Listings come in waves and the rules that govern listing day changed twice during the period.
The short version is that over the past seven years, selling on listing day was the worst of the common exit rules we tested. In every period we looked at, an allottee who waited did better. Usually it was much better and the advantage has grown as the exchange's opening rules have tightened. The longer version and the reasons it may not hold for every future listing, take the rest of this piece.
How a listing works now
A Nepali IPO is usually issued at par, Rs 100 a share. A minority, mostly manufacturing companies and some insurers, issue at a premium through book building. We exclude premium issues from this study because the starting point for an allottee is different. On listing day the exchange runs a pre-opening session collects buy and sell orders and sets an opening price. Two rules constrain that price.
The first is the opening range. Until early 2026, NEPSE set the opening range for a new listing at up to three times the net worth per share in the company's prospectus. For a newly built company with a net worth per share near Rs 100, that meant a ceiling close to Rs 300. In early 2026, NEPSE changed the basis to the face value. New listings now trade within Rs 100 to Rs 300 on their first day, three times the Rs 100 face value regardless of the company's net worth. The change was controversial for premium issues. A share issued well above Rs 300 could no longer open at its issue price.
For par issues the practical effect of the change was small because most newly built companies have a net worth per share close to Rs 100 and three times that is close to Rs 300 either way. What changed is that the ceiling became uniform and explicit. Every par-value listing since February 2026 has opened at or just below Rs 300. In our data the median opening price for those listings is exactly Rs 300.00 and the lowest is Rs 270.10. A company whose market value per share is Rs 1,000 and one whose market value is Rs 350 both open at about Rs 300. The opening price now carries almost no information about the company.
The second is the daily price limit. From listing day onwards, a share can move only a fixed percentage from the previous day's close. Until April 2026 the limit was 10%. On 12 April 2026, NEPSE announced amended trading regulations raising it to 15%. In the price data, the first 15% moves appear on 20 April and we use that date. The pre-opening session's own band was widened at the same time. Our data reflect both regimes and we apply the correct limit to each session when counting limit-up days.
Put the two rules together and the mechanics of a modern listing are simple. If buyers value a new share at more than Rs 300, the opening price is capped at Rs 300 or close to it. On each following day, the price can rise only 10% or 15%. If demand is strong, the share closes at its upper limit every day until it reaches a price at which enough holders are willing to sell. The result is a staircase. While the staircase lasts, very few shares change hands, because holders know that tomorrow's price will probably be higher.
This was not always how listings worked. Through 2022 and much of 2023, opening prices were more often found in a busy first session. Large volumes changed hands on day one and the price then moved freely. The difference between those two ways of listing turns out to matter more than anything else in this study.
It is worth being precise about what the cap does and does not do. It does not prevent a share from reaching a high price; it only slows the journey. A share the market values at ten times its issue price will get there but over two or three weeks rather than one morning. It does not stop trading either. Orders at the upper limit are matched whenever a holder offers shares at that price. What it does is decide who captures the climb. Under a free opening, the first trade happens near the market's valuation and the allottee who sells on day one receives roughly that. Under a binding cap, the first trades happen far below it and the allottee who sells on day one receives a fraction.
One listing, session by session
Before the aggregate numbers, it helps to watch a single listing closely. Take the hydropower company that trades as SKHL which listed on 25 March 2026 under the new Rs 100–300 opening range.
On its first day SKHL opened at Rs 300, the top of the range and closed at Rs 330, the 10% limit. Ninety shares changed hands. The next day it closed at Rs 363, again the limit on 130 shares. Then Rs 399.30 on 170 shares, Rs 439.20 on 190, Rs 483.10 on 360, Rs 531.40 on 340 and so on. For fourteen consecutive sessions after listing day, SKHL closed at its upper limit. Volume rose slowly as the price climbed and more holders were tempted to sell: 570 shares then 1,320, 2,109, 2,810, 6,090, 7,650, 8,860.
On the fourteenth of those sessions, SKHL closed at Rs 1,252.40 more than twelve times its Rs 100 issue price. Volume had jumped above 50,000 shares the session before, the first sign that supply was finally meeting demand. The next session it closed at Rs 1,251. The staircase was over.
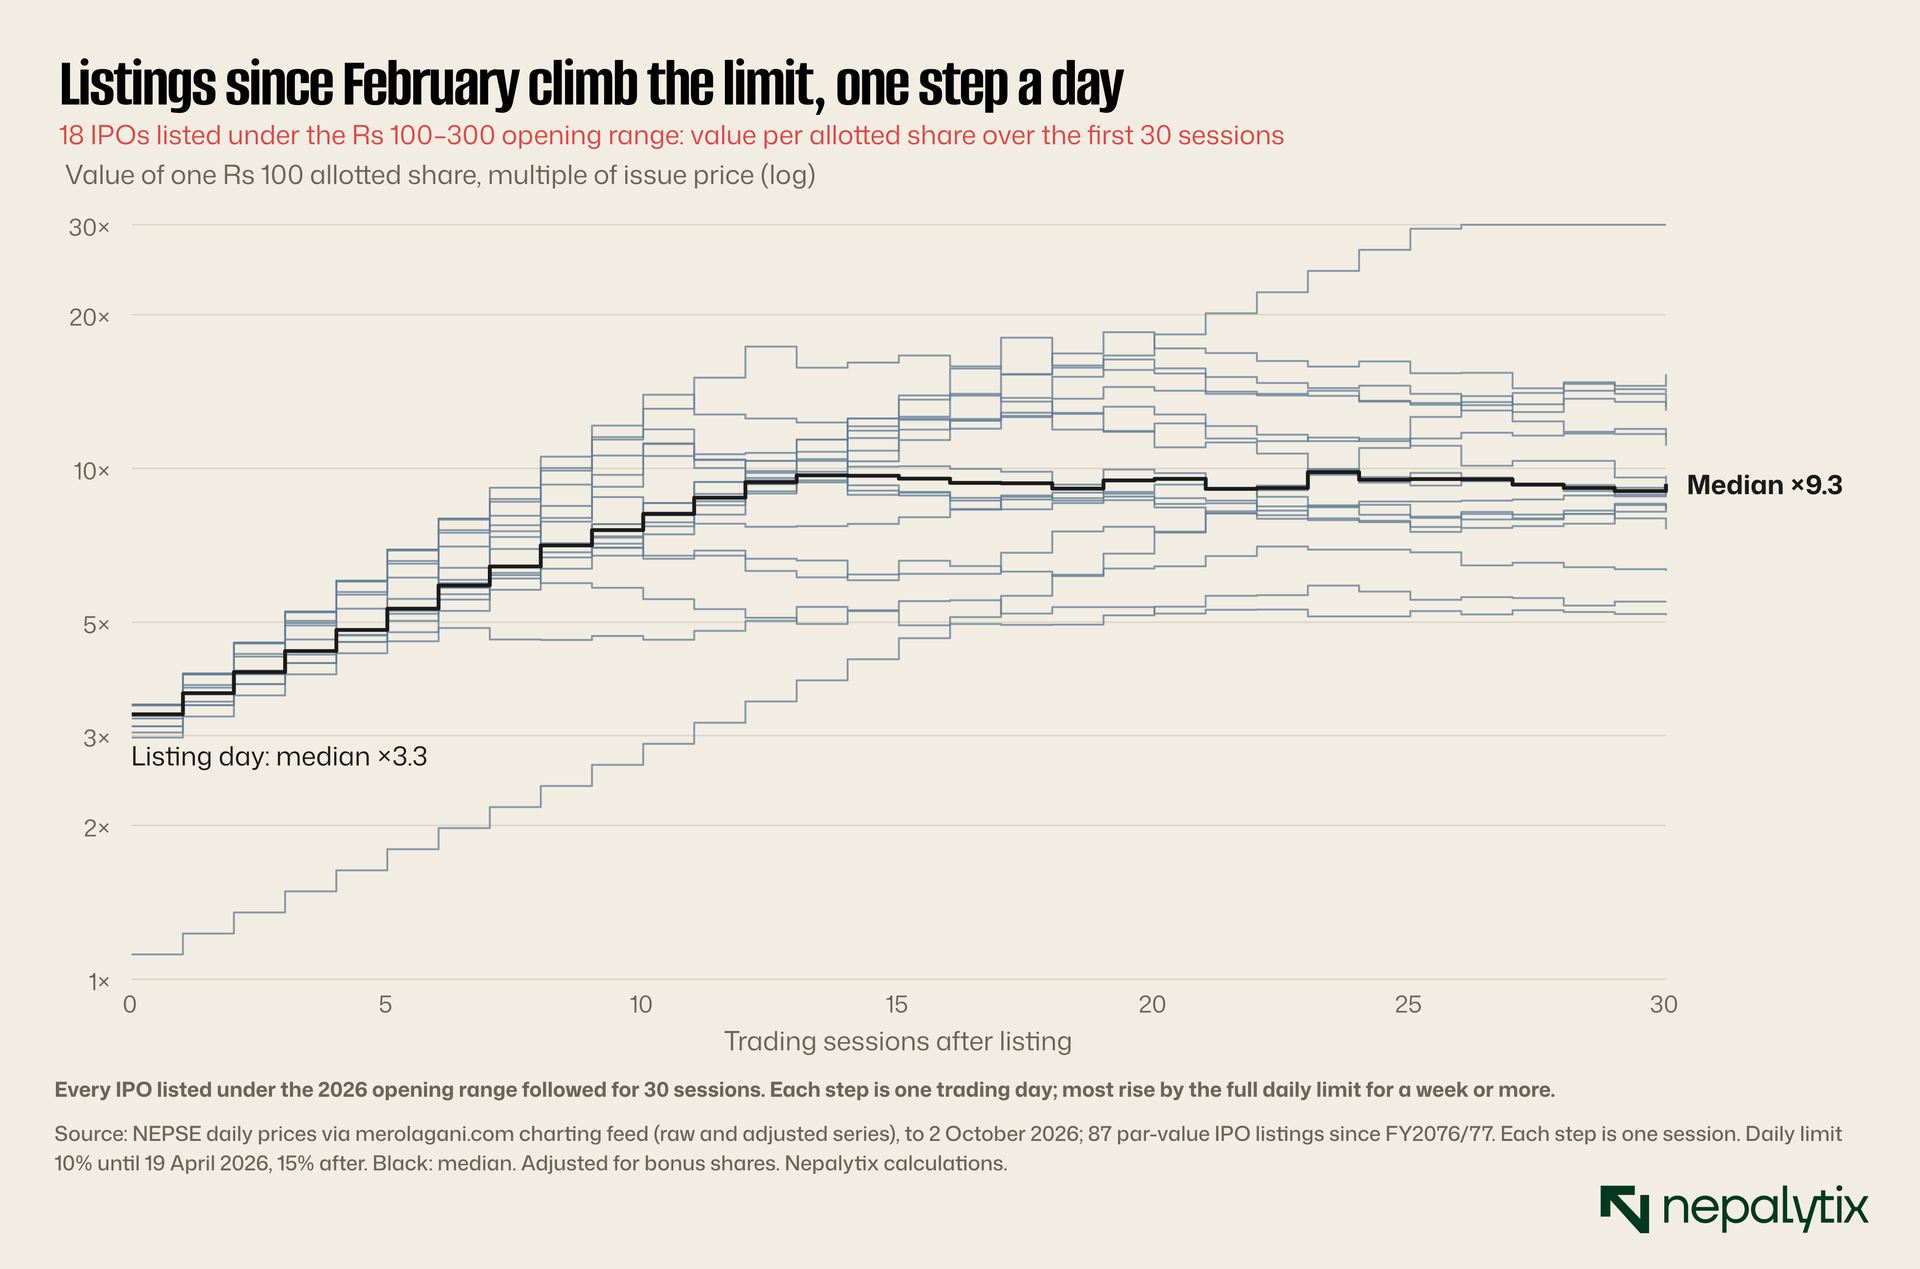
SKHL was not unusual. Every one of the 18 listings under the 2026 range is drawn above and most climb the same staircase for a week or more before their lines flatten and fan out.
An allottee with ten shares who sold at the close on listing day received Rs 3,300 before costs. One who sold at the close on the day the run ended received Rs 12,524. The difference Rs 9,224 on a Rs 1,000 investment went to whoever bought on listing day and held for two and a half weeks.
The story does not end there. By 2 October 2026, six months later, SKHL closed at Rs 716 down 43% from the end of its run. An allottee who held through the summer received less than one who sold when the run ended though still more than twice as much as one who sold on listing day.
Two other listings from the same month show the range. SOHL, another hydropower company listed ten days earlier on 15 March, also at Rs 300. Its run lasted eight sessions and ended at Rs 707.10. It traded more than 600,000 shares on the day the price first broke and drifted to Rs 620 by October. BJHL listed on 22 March opened at Rs 270.10 and ran for twelve sessions to Rs 931.70. It paused for a day rose another two sessions to Rs 1,191.80, and closed at Rs 575 on 2 October.
All three follow the same arc: a capped open, a staircase lasting one to three weeks on almost no volume, a sudden surge in trading when the price stops rising and then a long, uneven drift from the peak. In all three, listing day was the worst time to sell. In all three, the end of the run was better than six months later. That second pattern does not hold across the whole sample as we show below but it is common among the 2026 listings.
Building the table
The raw material is the daily price history of every listed equity, raw and adjusted for bonus and rights issues from the merolagani.com charting feed to 2 October 2026. For each company we take the date of its first trade. Of 264 listed equities, 238 returned a usable price history. Of those, 102 first traded on or after 17 July 2019, the start of FY2076/77.
Not all 102 are IPOs. Some are new symbols created by mergers, particularly among microfinance institutions, insurers and banks. Merged companies start trading at a price derived from the companies that merged, not from an issue price. Others are premium IPOs whose allottees paid more than Rs 100. Neither belongs in a study of par-value allottees.
We separated them with two rules, set before any outcomes were calculated. First, any listing whose opening price was above Rs 450 is excluded. That is half as much again as the Rs 300 ceiling that applied to par issues for most of the period. It removes premium issues and merger relistings which opened at prices ranging up to Rs 1,346. Ten listings fail this test. Second, any listing in a financial sector, meaning banks, development banks, finance companies, microfinance institutions and insurers is excluded unless it shows the unmistakable pattern of a capped IPO. That pattern is at least three consecutive limit-up sessions after a listing day on which fewer than 2,000 shares changed hands. Five listings fail that test.
That leaves 87 par-value IPOs: 58 hydropower companies, nine manufacturers, eight in the exchange's "others" category, four investment companies, three hotels, two microfinance institutions, two life insurers and one development bank. Every exclusion is listed in the appendix so readers can check the classification.
For each IPO we build a single number for each trading day: the value, on that day, of one share allotted at Rs 100. We use the adjusted price series rescaled so that it matches the raw price on listing day. A holder who received bonus shares after listing is credited with them. A 10% bonus means the original allotted share has become 1.1 shares. Cash dividends are not included so the values slightly understate what holders received. Most of these companies paid little cash.
We then classify each IPO into one of three listing regimes. "Price found on day one" covers listings, mostly from 2019 to 2023 in which the share did not lock at its limit after listing: either it traded heavily on the first day or its limit-up run lasted fewer than three sessions. "Locked at the limit" covers listings before the 2026 rule change in which the share closed at its upper limit for at least three consecutive sessions after a listing day with fewer than 2,000 shares traded. "Rs 100–300 opening range" covers all listings since February 2026. Forty-two IPOs fall in the first group, 27 in the second and 18 in the third.
The regime boundaries are not perfectly sharp. Some 2023 listings found their price on day one and others locked depending on the issue and the market's mood that month. A few listings locked for only one or two sessions and we count them in the first group. We tested other thresholds, two sessions instead of three and 5,000 shares instead of 2,000. Those choices move a handful of listings between groups. The medians for the locked group change by a few tenths of a multiple and none of the conclusions changes.
Finally, to separate an IPO's own performance from the market's, we compare each IPO's return from its listing-day close with the return on the NEPSE index over exactly the same days.
The staircase
The 18 listings under the 2026 opening range, shown in plate 2, are the clearest picture of how a modern listing behaves.
On listing day the median allotted share was worth 3.3 times its issue price. That is the opening cap, plus the first day's limit move. Over the next 30 sessions the median rose to 9.3 times. Most of the climb came in a series of limit-up closes, one step a day, in the first two to three weeks. After that the lines flatten and spread out. Some listings continue upward, and a few fall back.
The length of that run is the most distinctive feature of a modern listing and it changed abruptly in 2023.
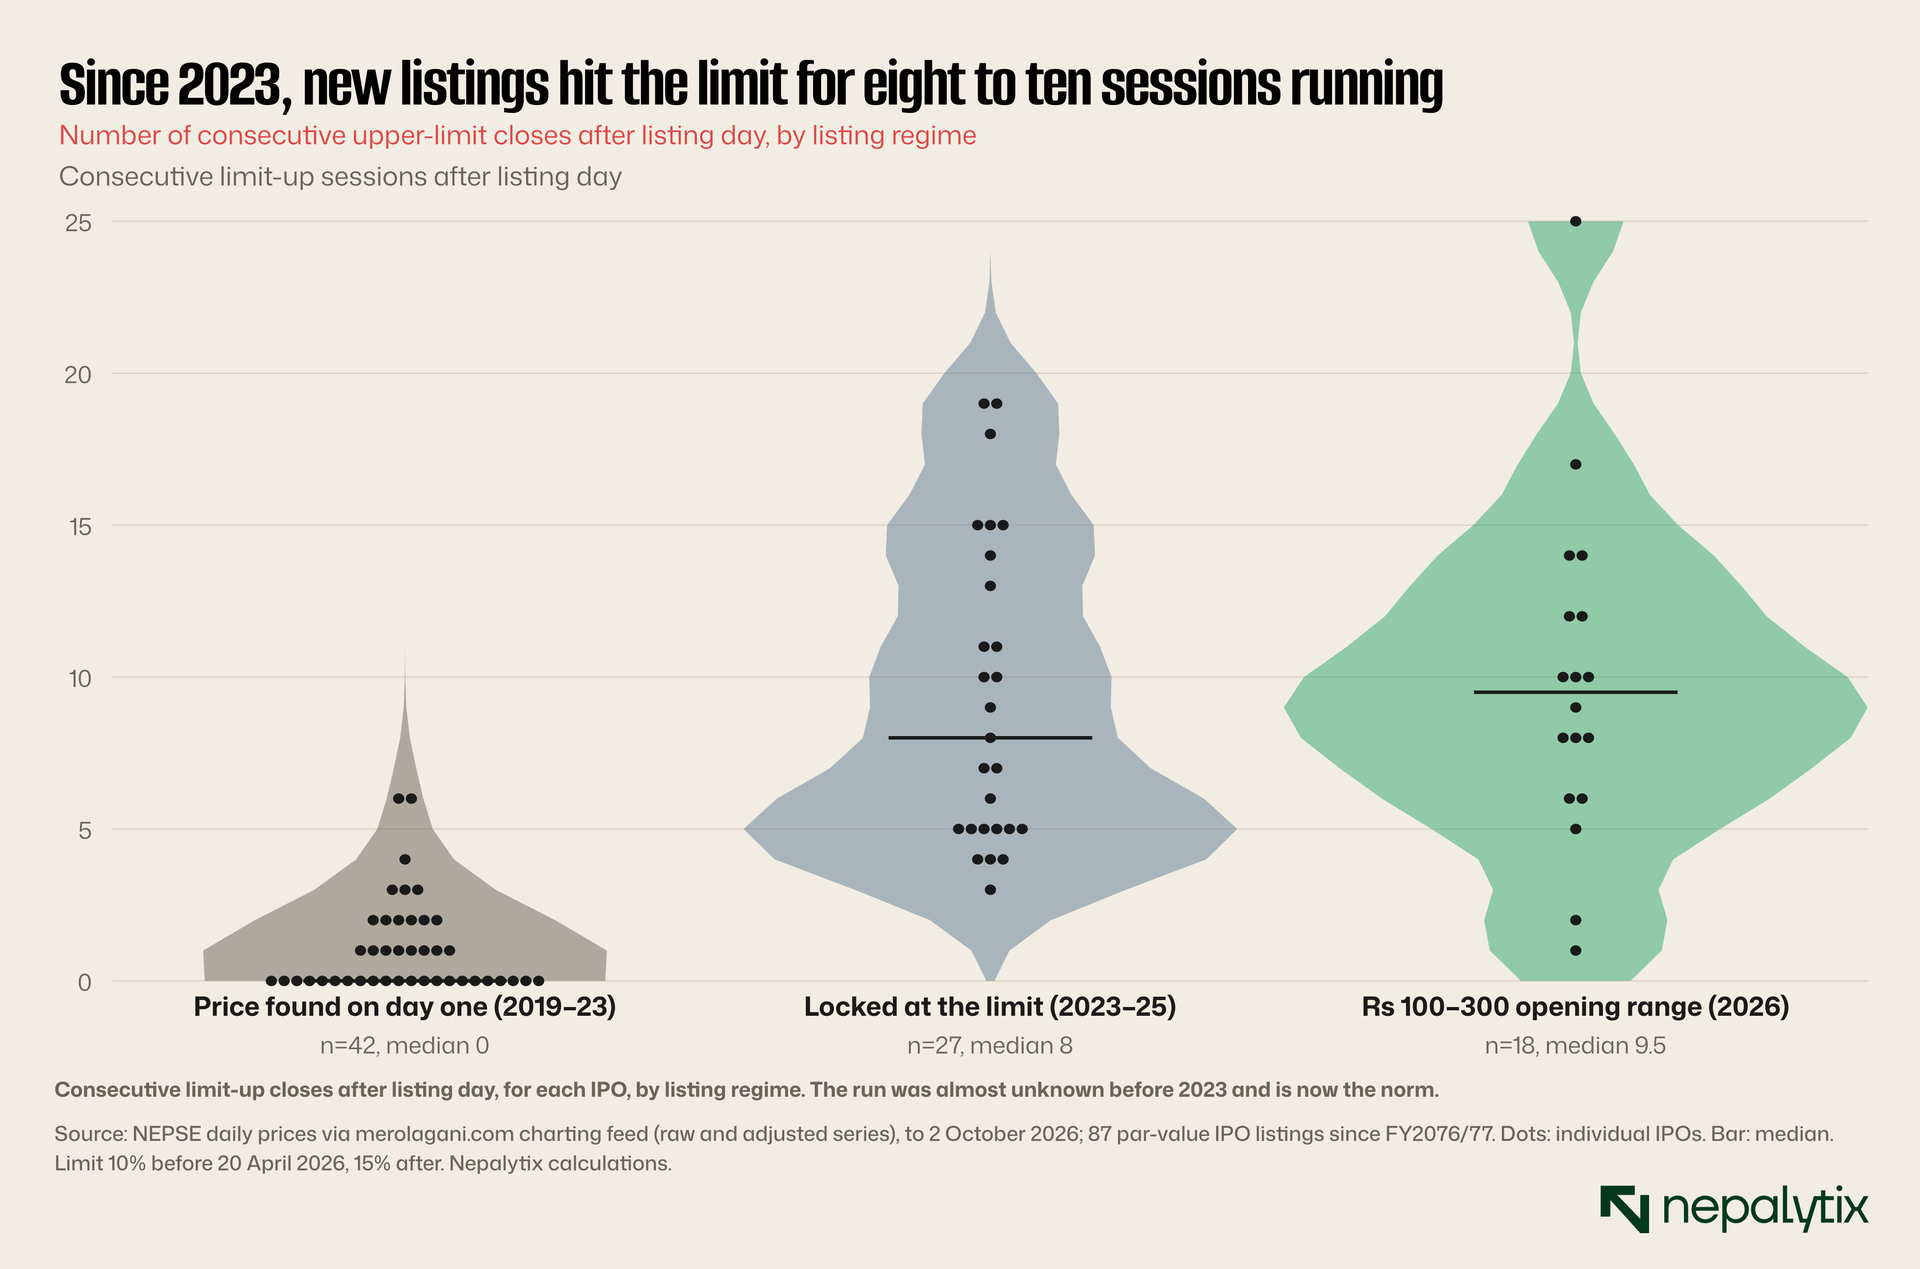
Among the 42 listings in which the price was found on day one, the median run of limit-up sessions after listing was zero. Most such listings traded freely from the start. Among the 27 listings that locked at the limit before 2026, the median run was eight sessions and several ran for 15 or more. Among the 18 listings under the Rs 100–300 opening range, the median was nine and a half sessions and one ran for 25.
The run and the listing-day volume are two sides of the same thing.
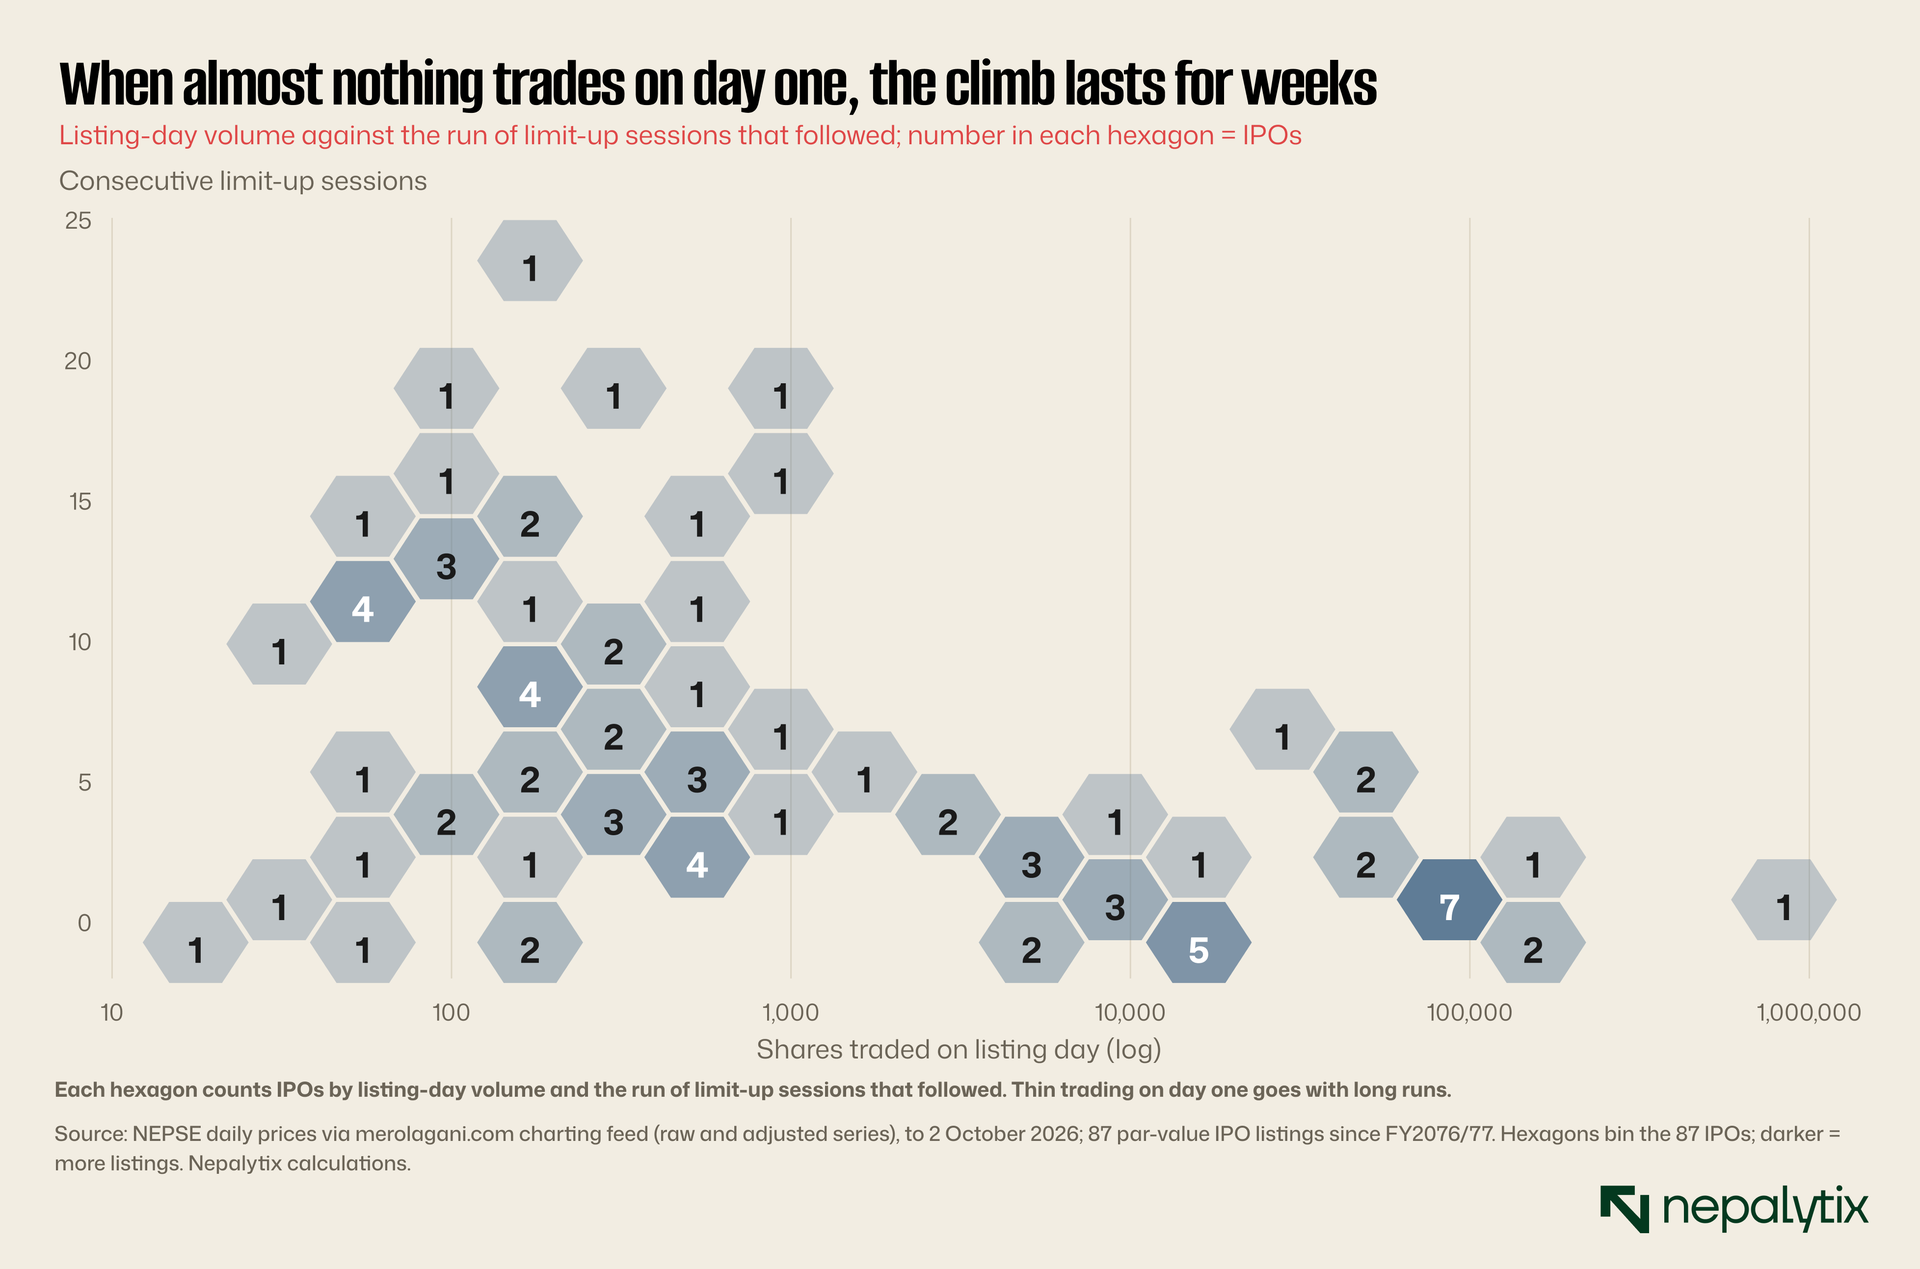
Where hundreds of thousands of shares changed hands on listing day, the run that followed was usually zero or one session. The price had been found and holders who wanted to sell had sold. Where a few hundred shares or fewer traded on listing day, the run was usually long. A queue of buyers sat at the upper limit, and very few holders sold into it. The median listing-day volume among the locked listings was 250 shares. Among the 2026 listings it was 145. Among the listings where the price was found on day one, it was 13,697.
In other words, the opening cap is binding. A share valued by the market at say Rs 900 can open at no more than Rs 300. Getting from Rs 300 to Rs 900 takes about a dozen sessions at a 10% limit or eight at 15%. During that time, every holder who sells is selling below the price the market will reach in a few days. Every listing-day seller in a locked listing gave away the difference.
What allottees made
The staircase is the most visible part of a listing but the question an allottee cares about is broader. What would an allotted share have been worth if sold at any given point and how does that compare with selling on day one?
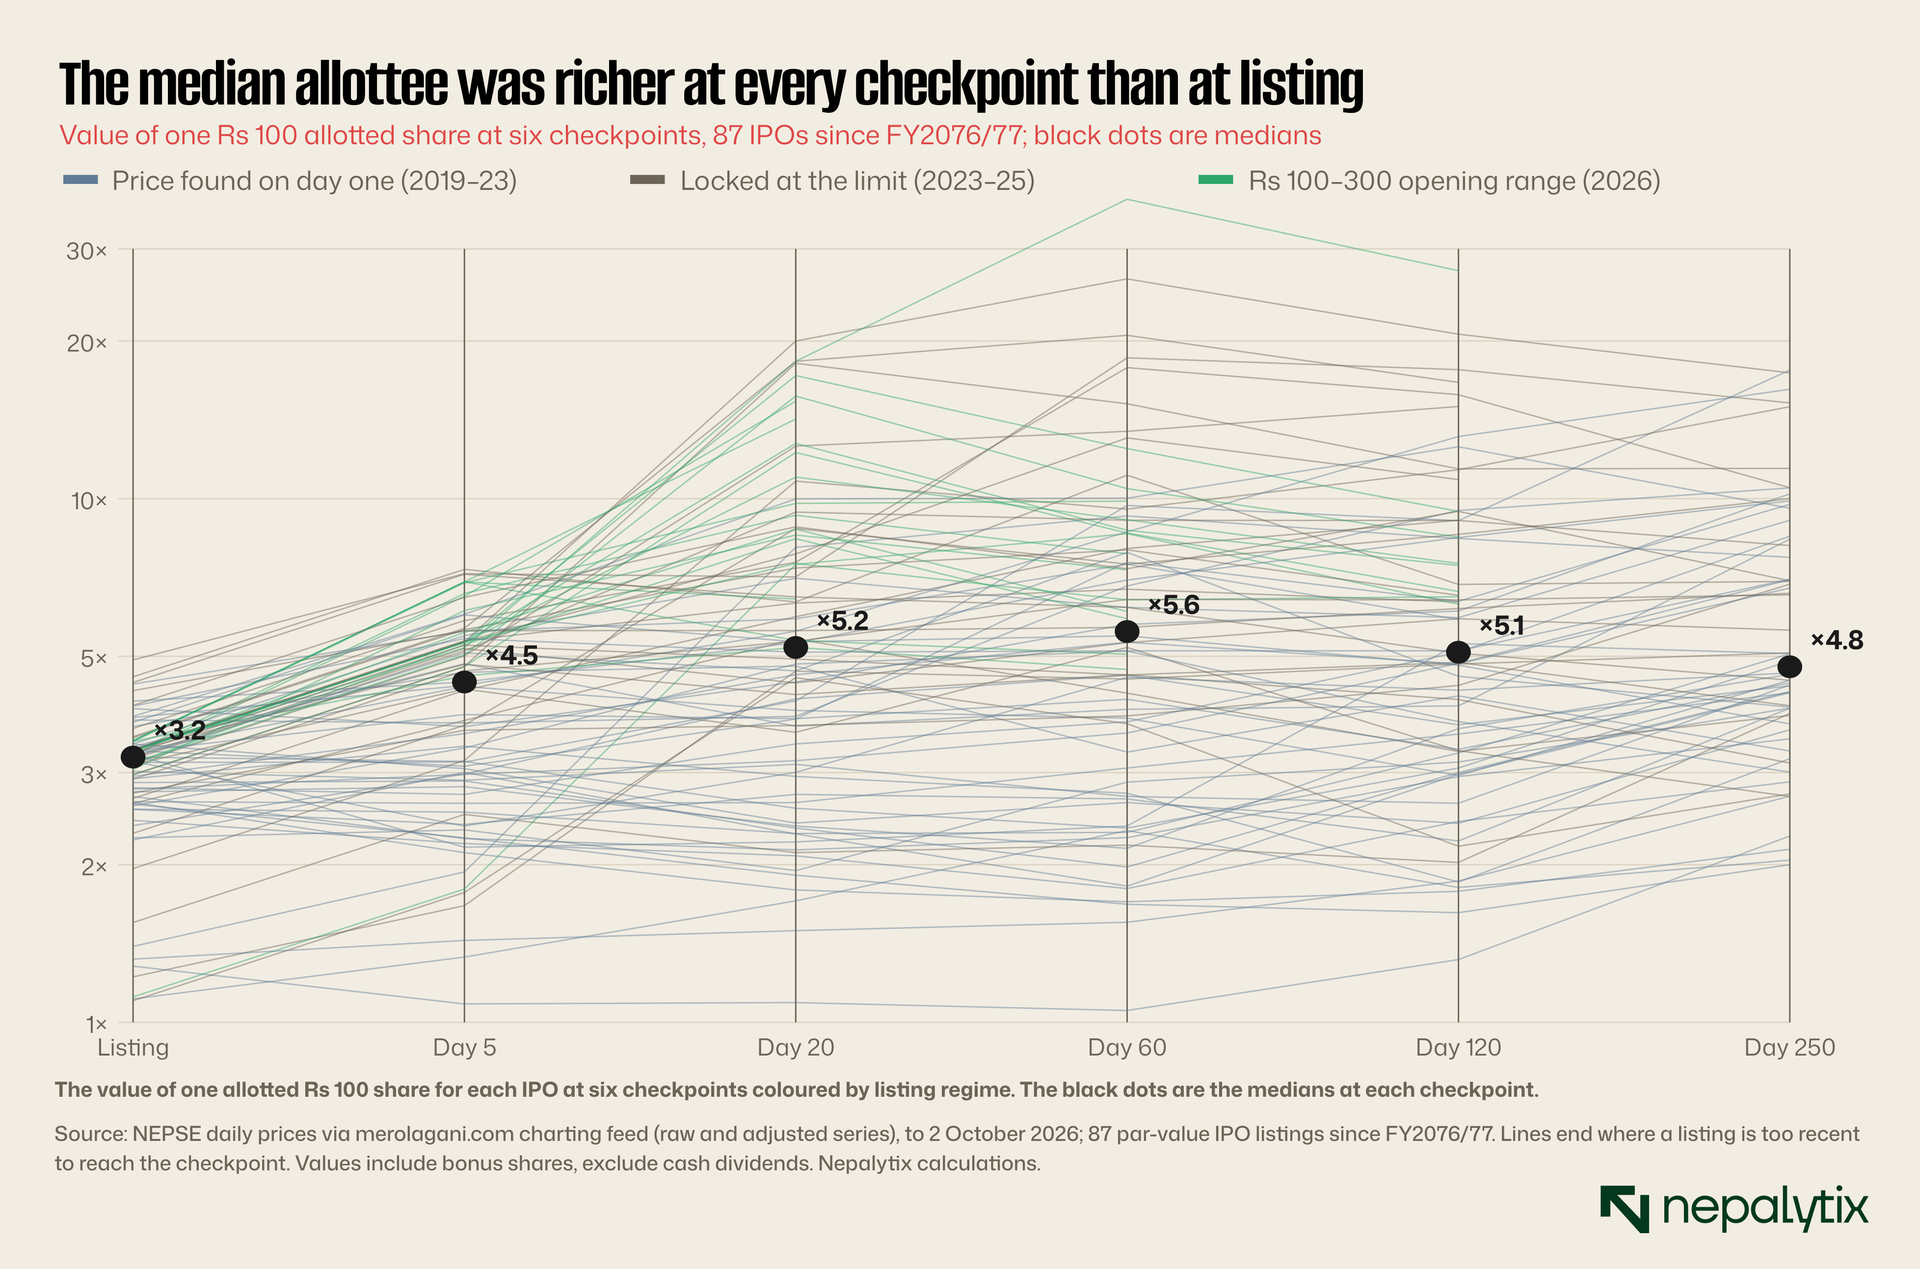
Across all 87 IPOs, the median allotted share was worth 3.2 times its issue price at the close of listing day. By day 5 it was 4.5 times, by day 20 5.2 times and by day 60 5.6 times. It eased to 5.1 times by day 120 and 4.8 times by day 250 among the IPOs old enough to have reached those points. At every checkpoint the median allottee was better off than on listing day.
No IPO in our sample was worth less than its issue price at day 250. Among the 62 IPOs that have traded for at least 250 sessions, the lowest value at that point was 2.0 times the issue price and the highest 17.6 times. Nine were worth more than ten times. This is a survivor sample and we come back to that but within it, losses against the issue price were absent.
The spread around those medians is wide. At day 20 the middle half of listings ran from 3.2 to 8.4 times the issue price. At day 60 it was 3.6 to 8.6 times and at day 250 3.9 to 8.4 times. Selling on listing day was not always the worst choice for an individual listing. In 14 of the 87 IPOs, the listing-day close was higher than the value 20 sessions later. In those cases an allottee who sold immediately did better than one who waited three weeks. But that happened in one listing in six. In the other five, waiting paid.
In rupees, for a typical ten-share allotment, the medians among IPOs with at least 250 sessions of history were: Rs 3,060 if sold at the listing-day close, Rs 3,646 at the end of the limit-up run, Rs 4,130 at day 20, Rs 4,580 at day 60 and Rs 4,775 at day 250. Those are amounts for an outlay of Rs 1,000 before brokerage and capital gains tax. The difference between selling on listing day and selling at day 60 was at the median about Rs 1,500 for ten shares. For the locked and capped listings, it was considerably more.
The more useful comparison is between exit rules. We applied six rules to every IPO with at least 250 sessions of history: sell at the close of listing day; sell at the end of the limit-up run; sell at day 20; day 60; day 120; or day 250. The median outcomes were 3.1 times the issue price for selling on listing day, 3.7 times at the end of the run, 4.1 times at day 20, 4.6 times at day 60, 4.5 times at day 120 and 4.8 times at day 250. The means were higher across the board, pulled up by the best performers: 3.0, 4.6, 4.9, 5.7, 5.6 and 6.4 times.
The ranking is not perfectly stable across periods, and it should not be. In the 2019–21 cohort, day 60 was the best exit. In the 2022–23 cohort, waiting a full 250 days was best. In the small 2024–25 cohort of six IPOs, day 120 was best, narrowly ahead of the end of the run. One result holds in every cohort: selling at the close of listing day was the worst of the six. The gap between listing day and the best rule was 1.8 times the issue price in 2019–21, 1.9 times in 2022–23 and 6.0 times in 2024–25.
The regimes explain much of the variation. Among listings where the price was found on day one, the median allotted share was worth 3.0 times its issue price on listing day and 3.3 times at day 20. Waiting helped, but modestly. Among locked listings, the median was 3.2 times on listing day and 6.4 times at day 20, roughly double. Among the 2026 listings it was 3.3 times on listing day and 9.6 times at day 20. The tighter the cap relative to the market's valuation, the more a listing-day seller gave up.
When does a new listing usually peak? Among the 62 IPOs with at least 250 sessions of history, the highest value within that first year came, at the median, on session 168, roughly eight months after listing. A quarter peaked by session 61 and a quarter after session 214. The median peak was 6.7 times the issue price. By session 250 the median listing stood at 81% of its first-year peak. So the typical pattern is not a quick spike and a collapse. It is a rise that continues, unevenly, for months, followed by a partial giveback.
That shape has a practical implication. There is no single day on which selling is reliably best because the peak is spread over most of the first year. A rule such as "sell at day 60" or "sell at day 250" captures most of the typical gain without needing to identify the peak. A rule such as "sell on listing day" captures the least. An allottee who wants a simple rule that has worked across all three listing regimes would do better with almost any fixed holding period than with none.
None of these medians is a forecast for an individual listing. The spread around them is too wide for that. But the pattern is consistent enough across 87 listings, three regimes and seven years to treat the listing-day sale as a costly default rather than a prudent one.
Against the market
An allotted share that triples on listing day and keeps rising might simply be riding a rising market. The period we study includes the 2021 bubble, the decline that followed, and the recovery since 2024. The NEPSE index more than doubled between July 2019 and its peak in 2021, fell back and has risen again since 2024. To check, we compare each IPO's return from its listing-day close with the index return over the same days.
The comparison starts from the listing-day close rather than from the Rs 100 issue price. That is deliberate. The gain from Rs 100 to the listing price is the lottery prize. An allottee receives it whatever they do next and no market comparison applies to it. The question here is what happens after listing day: whether holding a new listing beat simply owning the market over the same weeks.
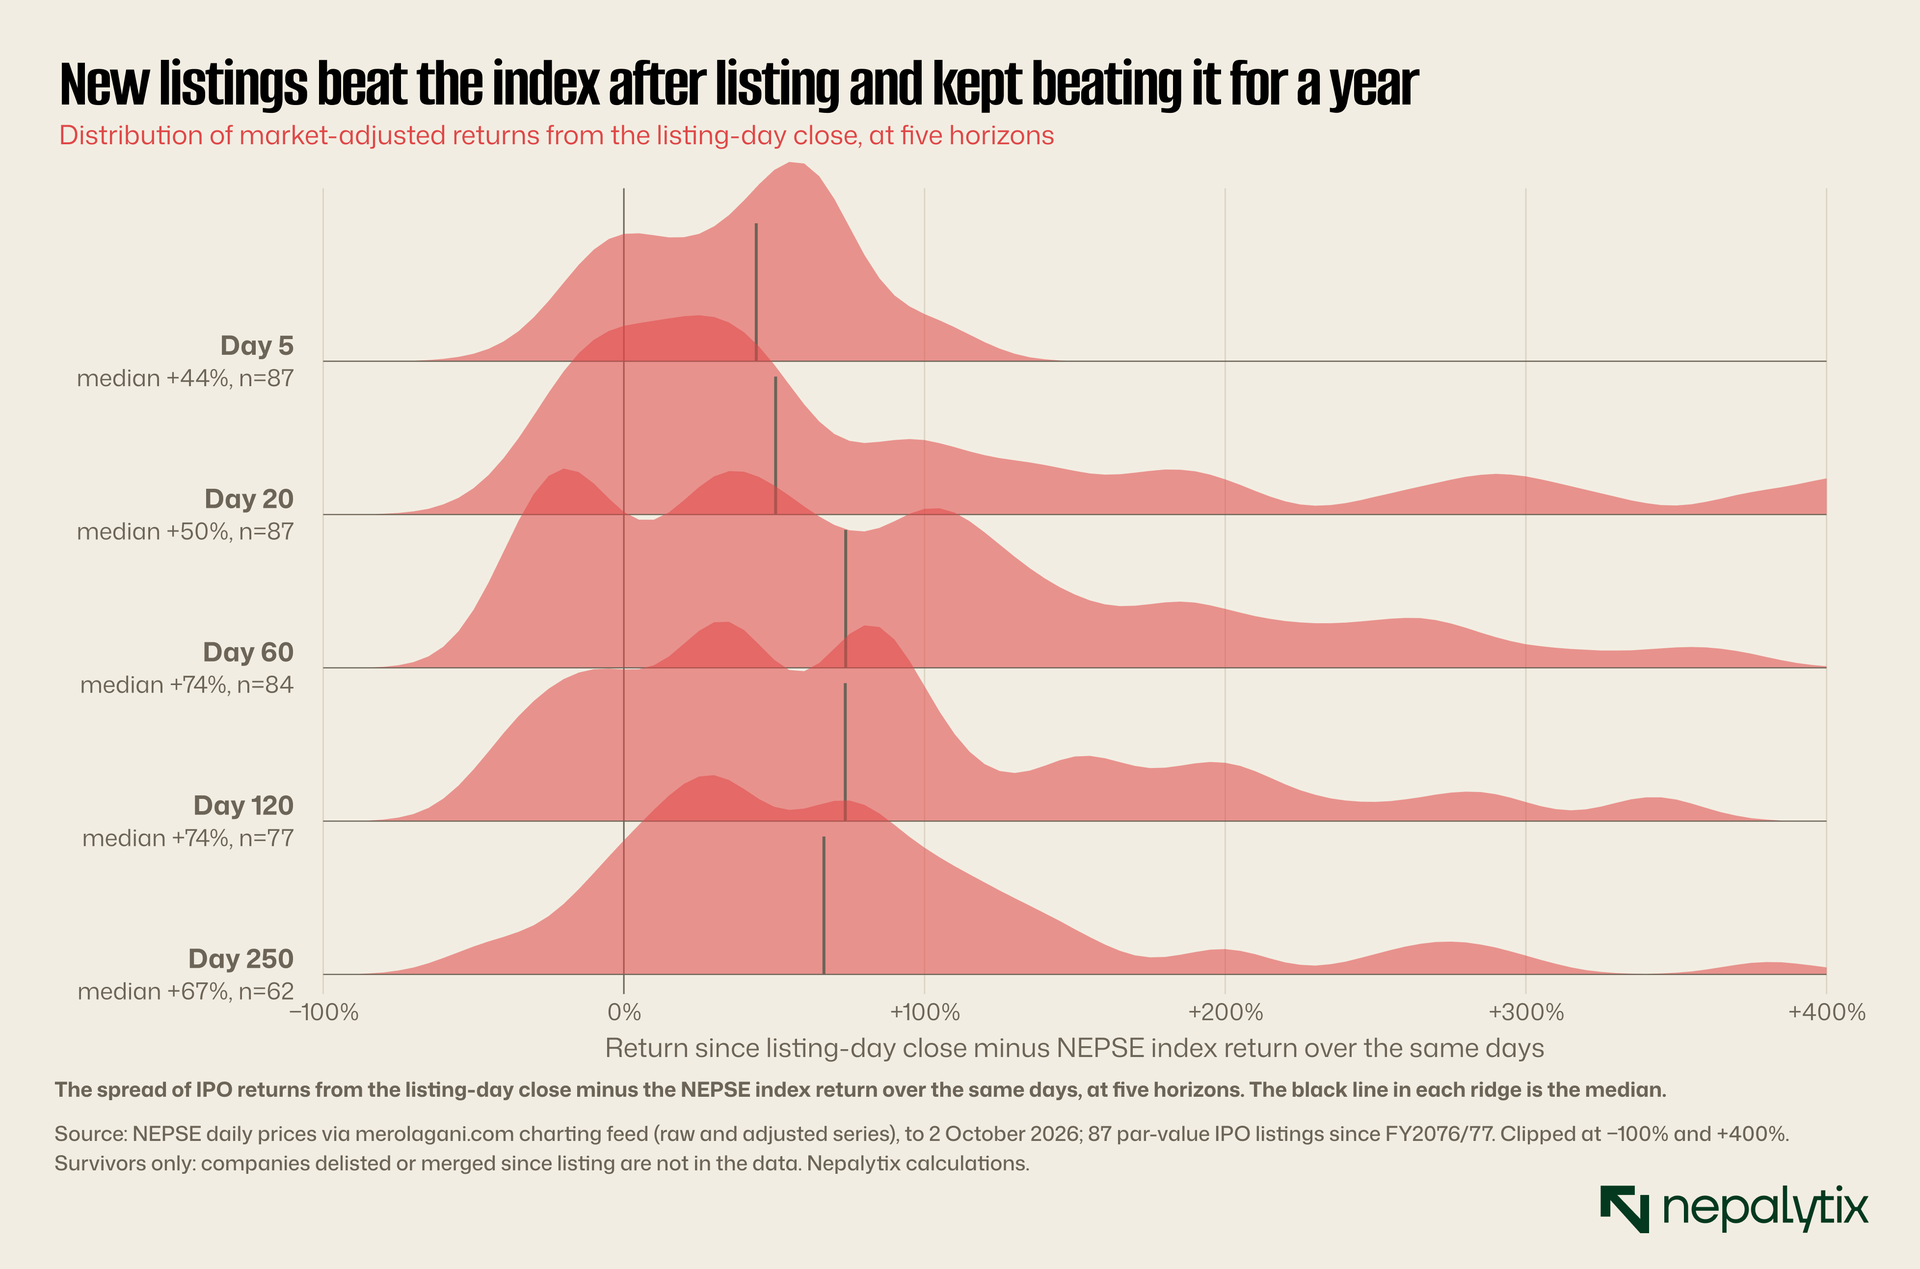
The IPOs beat the index by a wide margin. The median market-adjusted return from the listing-day close was 44% by day 5, 50% by day 20, 74% by day 60 and 74% by day 120. By day 250 it was 67%. At day 250, 89% of the IPOs old enough to measure had beaten the index since listing. That is not the market carrying new listings upward. It is new listings rising much faster than the market for months.
The regime matters here too. For listings where the price was found on day one, the median market-adjusted return was 9% by day 20 and 31% by day 120: real but modest. For locked listings it was 107% by day 20 and 94% by day 120. For the 2026 listings it was 224% by day 20 and 172% by day 120 among the eight old enough to measure. The locked and capped listings are where the gains concentrate. They concentrate there because the cap holds the listing-day price far below the price the market settles on.
Is any of the gain available to someone who waits until the staircase ends? The question matters because the end of the run is the first point at which an allottee can sell into a market that is clearing freely. Measured from the close on the last limit-up day, the median market-adjusted return over the following 250 sessions was 16%, and 67% of IPOs beat the index over that period. The advantage shrinks once the staircase ends, but on this sample it does not disappear.
Two features of the market-adjusted results deserve emphasis. First, the gains after listing are not a short-term blip that reverses. The median market-adjusted return at day 250 was a little below its peak at day 60 to 120, but still two-thirds above the index. Second, the share of IPOs beating the index rose with the horizon from about 80% at day 20 to 89% at day 250. If the post-listing rise were simple overreaction, one would expect the opposite: a growing share of listings falling back below the market as the excitement faded. The survivor bias discussed below works in the same direction so this result should be read with care. But it is not what an overreaction story predicts.
The day-five figure is also telling. Within five sessions of listing, the median IPO had already outperformed the index by 44%. Almost all of that is the staircase. A seller on listing day forgoes it entirely. A seller who waits even one week captures most of it in the locked listings.
Hydropower and the rest
Hydropower dominates the sample with 43 of the 62 IPOs that have traded for at least 250 sessions. The results differ between hydropower and everything else and the difference is worth stating plainly.
Among the 43 hydropower IPOs, the median allotted share was worth 2.9 times its issue price at the listing-day close and 4.3 times at day 250. The median market-adjusted return from listing to day 250 was 49%. Among the 19 other IPOs, manufacturers, investment companies, hotels, insurers and the exchange's "others", the median was 3.3 times at listing and 8.4 times at day 250. The median market-adjusted return was 103%.
The non-hydropower group is small and varied, and a few strong performers lift its median. But the direction is consistent with what one would expect. Hydropower IPOs come in large numbers, often several in a month, and the market has been asked to absorb a steady supply of very similar companies. Non-hydropower IPOs are rarer, more varied and more likely to be the only listing of their kind in a given quarter. Scarcity, again, shows up in the price.
For hydropower allottees the practical lesson is the same with smaller numbers. Listing day was still the worst exit on the median, and waiting still beat the index. But the gains from waiting were roughly half as large as for other sectors. A hydropower allottee also needs to remember what Upper Tamakoshi piece showed about the sector's cash flows: most of these companies will not pay meaningful cash dividends for years so the share price is the only return available.
The waves
The pace of listings has been uneven, and the regime has shifted with it.
Listings were steady but thin from 2019 to 2022: one to five a quarter mostly hydropower mostly with the price found on day one. In 2023 there was a wave of 31 listings again mostly hydropower as projects financed in the boom reached completion. The locked pattern began to appear during that wave. In 2024 the pipeline nearly stopped with one par-value listing in our sample all year. It resumed in 2025 and all but one of the 2025 listings locked at the limit. Since February 2026 there have been 18 listings under the new opening range, an unusually fast pace.
The concentration in hydropower is striking: 58 of the 87 IPOs. That reflects the structure of Nepal's capital market. Hydropower projects are financed partly through public offerings to local residents and the general public once they near completion. The listing table is therefore largely a table of hydropower companies in their first months as public companies. As Tuesday's note on Upper Tamakoshi showed, the market's valuation of such companies often has little to do with the cash they can return. That may explain part of the post-listing rise. It does not change what an allottee would have earned by holding.
Why the staircase exists
The pattern in the data is the predictable result of three features of the market.
The opening cap is below the clearing price. If the market values a new share at Rs 800 and the opening price is capped at Rs 300, the share cannot open at its clearing price. The pre-opening session matches whatever orders exist within the band. Buyers who would pay Rs 800 sit at Rs 300 and are rarely filled because few holders will sell at Rs 300 when the price is clearly going higher.
The daily limit spreads the adjustment over weeks. With a 10% limit, getting from Rs 300 to Rs 800 takes eleven sessions. With 15%, it takes seven. During that time the share is effectively untradeable. The queue at the upper limit grows faster than the supply of sellers.
The supply is tiny and dispersed. A typical hydropower IPO allots ten shares each to tens of thousands of retail winners, plus a quota for local residents. Promoter shares are locked in. The free float on listing day is small, and held in lots too small for most holders to monitor actively. Many allottees do not sell for weeks or months simply because they do not check their accounts.
Under these conditions, selling on listing day is a transfer from the seller to whichever buyer in the queue is filled. The buyer pays the capped price and receives a share the market will soon value at two or three times as much. The listing-day seller is not taking a profit. The seller is giving most of it away.
Who are the buyers? The data cannot say because NEPSE does not publish trades by investor type. But the structure suggests an answer. A buyer who places an order at the upper limit early on listing day and renews it each morning will be filled whenever an allottee sells. That buyer needs no view on the company's value only on the fact that the price will keep rising while the queue persists. The strategy requires attention, a funded trading account and a willingness to hold for a few weeks. Those are characteristics of active traders and brokers clients not of the typical lottery winner with ten shares. The opening rules create a predictable transfer and the people best placed to collect it are those who watch the market most closely.
The exchange's motives for the cap are understandable. The 2026 change to face value was partly a response to technical and regulatory problems with the net worth basis. A cap also protects buyers from paying an absurd opening price for a share whose value nobody yet knows. But a cap set below the clearing price does not protect anyone. It redistributes value from the least sophisticated holders, those who sell first to the most patient buyers.
The case for selling early
The data favour holding. There are still good reasons to be cautious about turning that into advice and an allottee should weigh each of them.
Survivorship. Our price histories cover only companies that are listed today. A company that listed in 2020 and has since been delisted, suspended or merged is not in the data. If such companies did badly after listing, as delisted companies usually do, our results overstate the gains from holding. We have no reason to think the bias is large for recent listings, most of which are still young. For the older cohorts it could be material and readers should treat the long-horizon results, day 250 and beyond with more caution than the short ones.
There is a second gap. Twenty-six listed companies returned no usable price history from our source and some of them may be recent listings. If they behaved differently from the 87 we could measure, the medians would move. We have no indication that they did but we cannot rule it out. The appendix lists every company we did include so the sample can be checked and extended.
The market. The index adjustment removes broad market moves but not everything. Hydropower stocks as a group have been the market's favourite for much of the period. Some of the post-listing gain may be sector momentum. An allottee in a less favoured sector might see less.
The timing of the listings bears on this.
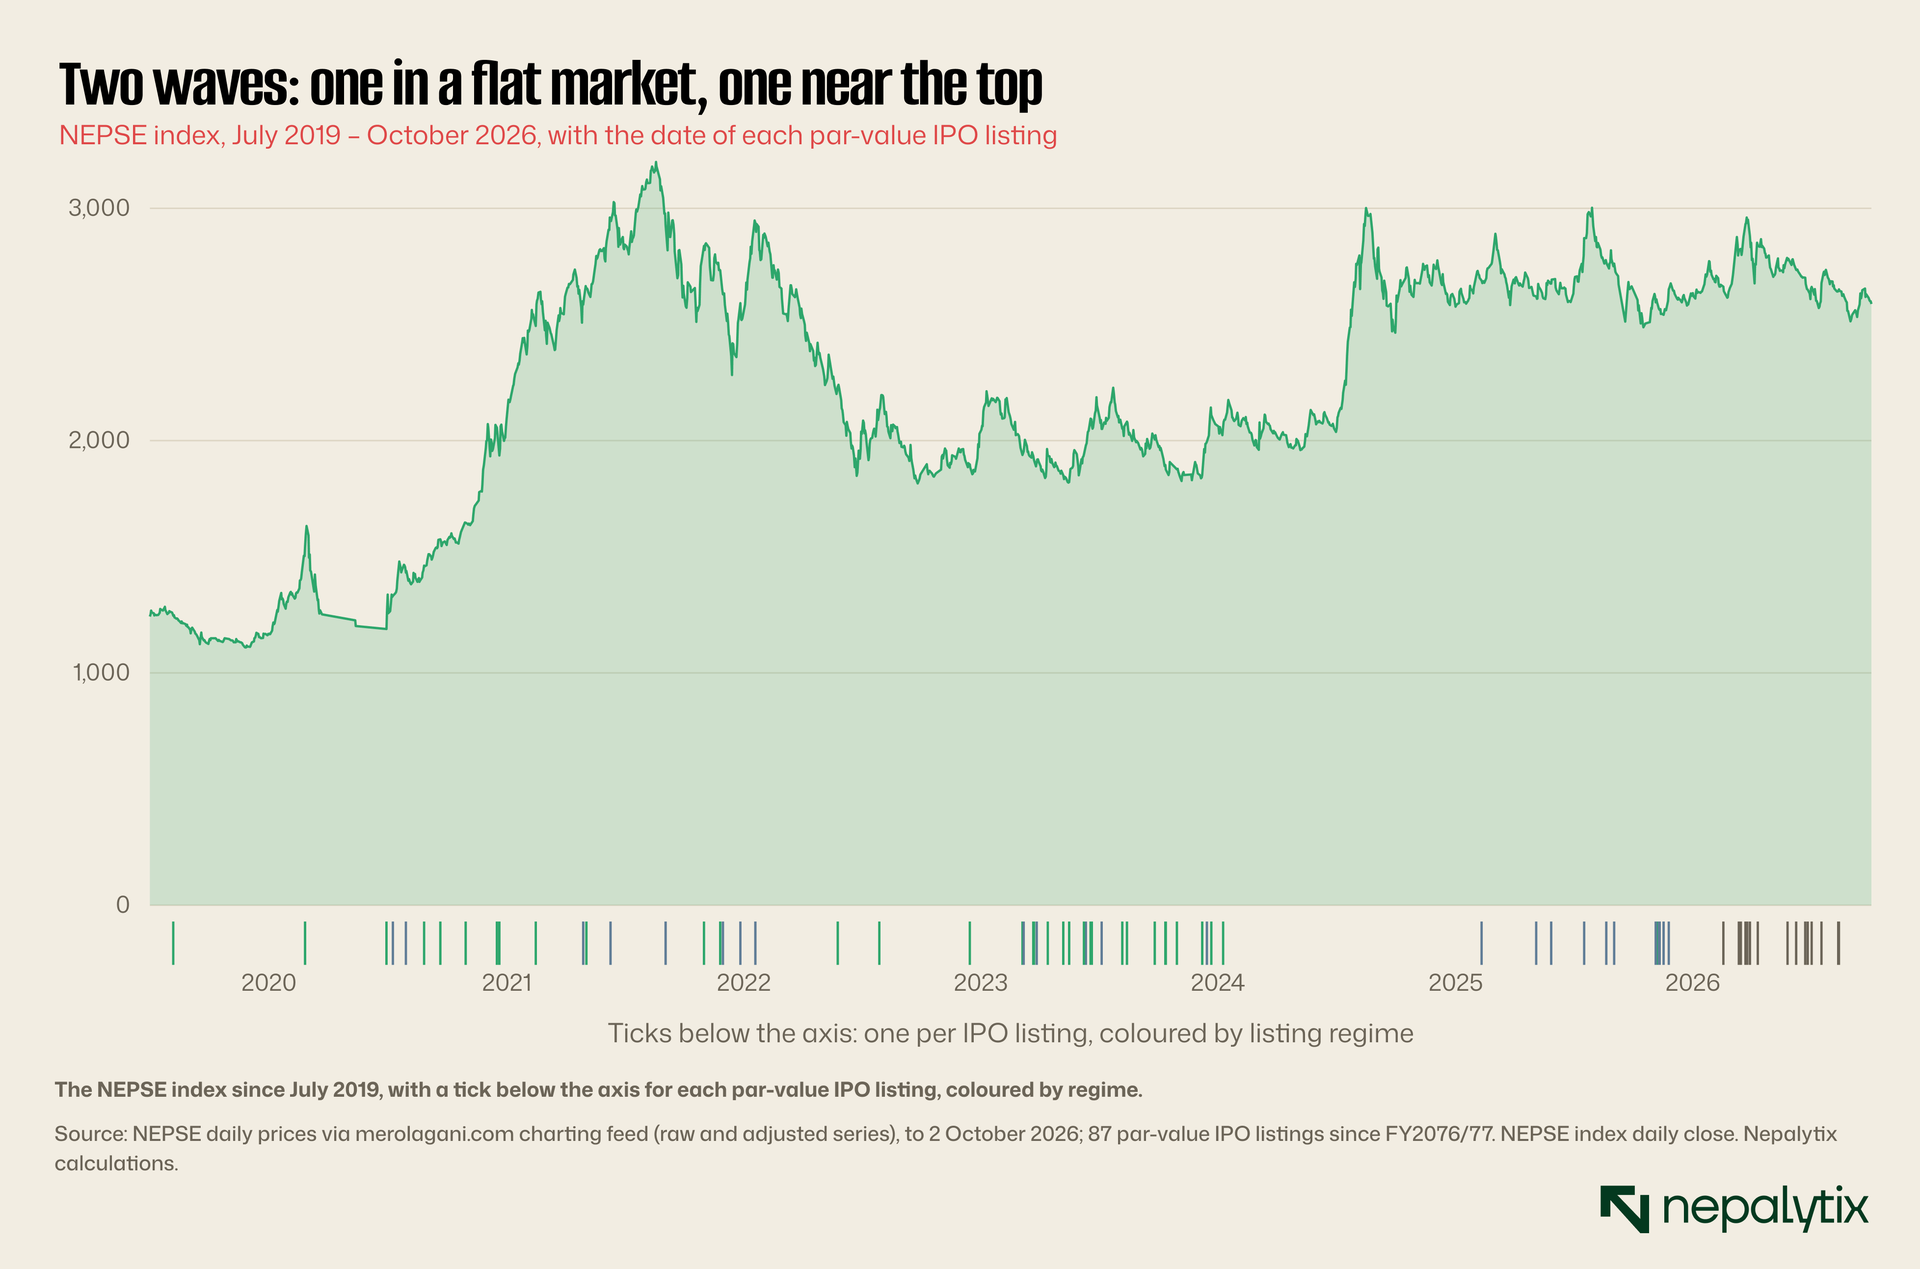
The 2023 wave of listings came in a flat market, with the index around 1,900 to 2,100. The 2025–26 wave came with the index near its highs, above 2,600. Neither wave was timed to a market peak in any obvious way. Listings depend on regulatory approvals and on the pipeline of hydropower projects reaching commercial operation as much as on market conditions. That matters for interpreting the results. The IPO advantage does not come from listing at a market low.
The drawdown. Holding is not a smooth ride. Measured from the end of the limit-up run, the median IPO fell 20% from that level at some point within the next 120 sessions. For a holder who needs the money or cannot tolerate the swing, that matters. Thirteen of the 61 IPOs with enough history were worth less 250 sessions after the run ended than on its last day.
The 2026 listings make the point sharply. SKHL, BJHL and SOHL all fell 12% to 43% from the end of their runs by October. Among recent listings, the end of the run has more often been the best moment to sell than any later date. It is too soon to say whether that will remain true over a full year.
The regime can change again. The largest gains have come from the gap between the opening cap and the clearing price. If NEPSE widens the opening range, or moves to a genuine opening auction, that gap will narrow and with it much of the advantage of waiting. The 2026 rule change shows that these rules are not fixed.
Size. For most allottees the sums are small. Ten shares at Rs 300 are worth Rs 3,000 on listing day. The difference between selling on day one and selling at day 20 might be Rs 3,000 to Rs 6,000. For many people that is not worth monitoring a position for weeks or bearing the risk of the subsequent fall. That is a rational choice. It is not, however, the same as believing that listing day is the best time to sell.
What an allottee can take from this
None of this is investment advice and past listings do not determine future ones. But the data support a few clear observations for anyone holding newly allotted shares.
The ranking of exit rules by listing period is the most direct summary of the evidence.
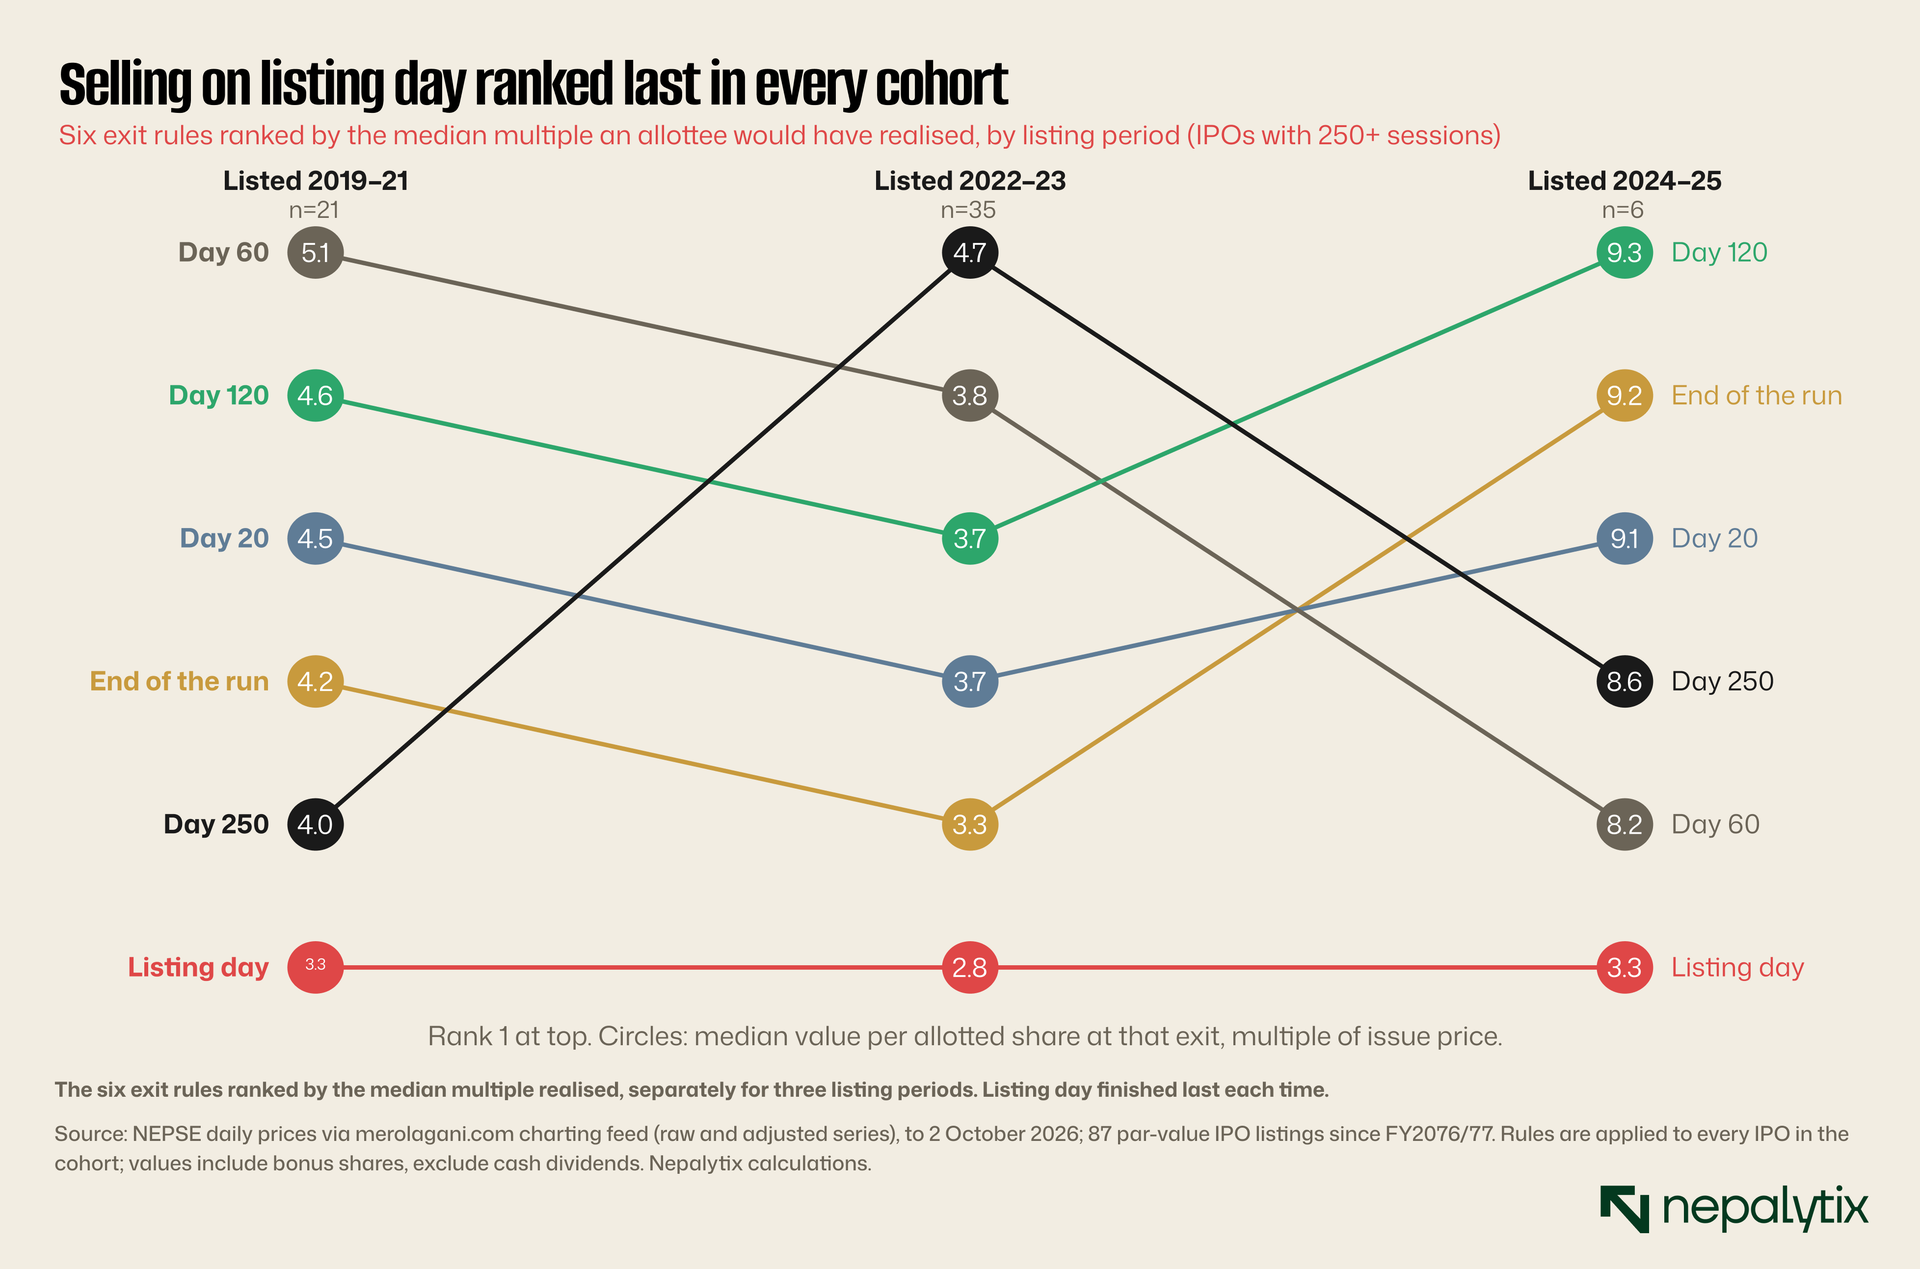
Across all three periods, the rule that came last was the one most allottees follow. The rule that came first varied: day 60 for the oldest listings, day 250 for the 2022–23 wave, day 120 for the six 2024–25 listings with enough history. No single holding period is reliably best. What is reliable is that listing day is worst.
Check whether the share is locked. If a new listing closes at its upper limit on day one with only a few hundred shares traded, the opening price is almost certainly below where the market will settle. In the 45 locked and capped listings in our data, the median allotted share was worth roughly two to three times as much 20 sessions later. Selling into a locked queue on day one has been the costliest decision available.
Watch for the end of the run. The first session on which a new listing fails to close at its upper limit is the first real signal of where the market values it. On our data, holding past that point still beat the index more often than not. The advantage after that point is smaller and more variable and an allottee who wants certainty can reasonably sell then.
Be more cautious where the price was found on day one. When a listing trades heavily on its first day, the cap has not bound, and the gains from waiting have historically been far smaller. The median market-adjusted gain from listing was 9% by day 20 in that group.
Use the end of the run as a decision point, not a reflex. When a locked listing first fails to close at its limit, volume usually jumps, as it did for SKHL, BJHL and SOHL. That is the market finding its price. An allottee who has held through the staircase can decide calmly at that point whether to keep the shares, knowing the evidence: on our sample, holding for another year beat the index about two times in three but recent listings have more often drifted down from that level than risen above it. A sensible middle course for a larger holding is to sell part at the end of the run and keep the rest.
Size the decision to the stake. For a ten-share allotment, the expected gain from waiting is real but small in rupees. For a larger holding, through a local-resident quota or several family accounts, it can be substantial.
What we still do not know
The listing table answers the question it was built for but it leaves several related ones open.
Subscription and allotment. We have not linked each IPO to its subscription ratio or the share of applicants who received shares. It is plausible that heavily oversubscribed issues show longer staircases because unmet demand from the lottery moves straight into the listing-day queue. Testing that requires the issue managers allotment reports which we have not yet compiled.
Cash dividends. Our values include bonus shares but not cash dividends. For most of these companies cash payments in the first year are small or zero as Wednesday's piece on bonus shares showed. Including them would raise the long-horizon values slightly. It would not change the ranking of exit rules.
Costs and tax. Brokerage commissions and capital gains tax reduce the proceeds of any sale and the tax rate can depend on the holding period. A holder who sells within a year may face a different rate from one who holds longer. That would modestly favour holding further but we have not modelled it.
Order flow. The exchange does not publish the depth of the queue at the upper limit, the identity of buyers, or the share of listing-day volume that comes from allottees. With that data, the transfer from listing-day sellers could be measured directly rather than inferred.
Future regimes. The 2026 listings are recent and none has yet traded for 250 sessions. Their first months have been the most extreme in the sample. Whether they hold their gains over a full year is the most important open question and we will revisit it as the data come in.
Promoter lock-in expiry. Promoter shares in Nepali IPOs are locked in for a period after listing. When the lock-in ends, a large block of shares can come to market. We have not marked lock-in expiry dates in the listing table. If expiries coincide with the drift down from post-listing peaks that some listings show, an allottee would want to know the date in advance. This is the next addition we plan for the table.
Delisted and merged companies. Reconstructing the histories of companies that are no longer listed would remove the survivor bias. It requires archived price data that the feed we used does not provide. We would welcome readers who hold such data and will credit any contribution.
What the exchange should do
The staircase is a market design choice and it can be changed.
The cleanest fix is a genuine opening auction for new listings. The exchange would collect orders over a longer pre-opening period perhaps several days with no cap or a much wider one and open at the price that clears the most volume. Many exchanges use such auctions precisely to avoid the problem the data show: a price held below its clearing level for weeks during which uninformed holders sell to informed buyers. If NEPSE is concerned about manipulation in thin opening auctions, it can require minimum participation or extend the auction until it does.
A smaller change would help even without an auction. The exchange could widen the daily limit for newly listed shares during their first weeks so the staircase is shorter. Or it could publish each day, the size of the unfilled buy queue at the upper limit so holders can see what they are selling into.
The worst option is the current one: a cap set at an arbitrary multiple of face value, unrelated to the company's value, followed by a daily limit that stretches the adjustment over weeks. It does not protect buyers who are the ones gaining. It costs sellers who are mostly small retail allottees acting on the conventional advice to take the profit. A rule that consistently transfers value from the least sophisticated investors to the most patient ones deserves another look.
There is a fairness argument as well as an efficiency one. The IPO system in Nepal is designed to spread ownership widely. The lottery, the minimum lot, the quotas for local residents and employees all exist to put shares in the hands of ordinary people. An opening rule that predictably extracts value from those same people in their first weeks as shareholders works against that purpose. If the policy aim is wide ownership at fair prices, the listing mechanism should let the first price be a fair one.
Until the rules change, the most useful thing the exchange and the securities board could do is explain them. A short notice to allottees, sent with the allotment, setting out how the opening range and daily limit work would cost almost nothing. A summary of what has historically happened after listing would cost little more. Investors who understand that a locked queue at the upper limit is a sign of excess demand, not a peak would make better decisions on day one.
Disclaimer
This report has been prepared by Nepalytix for informational and educational purposes only and does not constitute investment advice, an offer, or a solicitation to buy or sell any securities.
The information contained in this report is based on sources believed to be reliable; however, Nepalytix does not guarantee its accuracy, completeness, or timeliness. Opinions, estimates, and projections expressed herein are those of the authors as of the date of publication and are subject to change without notice.
Investing in securities involves risks, including the possible loss of principal. Past performance is not indicative of future results. Readers are advised to conduct their own independent research and consult with a qualified financial advisor before making any investment decisions.
Nepalytix and its contributors may hold positions in the securities discussed in this report at the time of publication or thereafter.
Neither Nepalytix nor any of its affiliates accept any liability for any loss arising from the use of this report or its contents.