How to Read a Life Insurer’s Accounts
Nepal’s 12 listed life insurers earned Rs 5.09 billion in FY 2082/83, down 2.43% year-on-year. But growing life funds tell a bigger story. Here’s how to read an insurer’s financial health beyond profits.
The 12 listed life insurers profit fell 2.43% in FY 2082/83 while the life funds at six of them grew by double digits. Profit is the least reliable number on the page.
Two numbers from the same set of statements. The 12 listed life insurers earned a combined Rs 5.09bn in FY 2082/83, down 2.43% from Rs 5.22bn. Over the same year, Nepal Life’s life fund, the money it holds against its promises to policyholders, rose from Rs 233.73bn to Rs 273.56bn, up 17.0%. Himalayan Life’s profit fell 41.9% while its fund grew 16.2%. Sun Nepal Life’s profit fell 22.8% while its fund grew 27.7%.
A life insurer collects money now and pays it over decades. The profit line is what is left after the insurer has set aside what it owes, paid its costs and handed the government its share. It is a small residual of a very large flow, and it moves for reasons that often have little to do with whether the business is healthy. In non-life insurance, as our guide of 30 August explains, premium and claims run through the books within a year or two. In life insurance the two are separated by decades and profit becomes much harder to read. This guide follows the money in the order it moves and at each step names the number that matters and the number that misleads.
THE SHORT VERSION
Read premium by type, not in total. Divide premium by policies before you compare two insurers. Read the life fund before you read profit. And treat profit as provisional: split it into pre-tax profit and tax before you believe a growth rate and remember that every Q4 figure here comes before the actuarial valuation.
The figures are from the unaudited Q4 FY 2082/83 statements which carry a warning most readers skip. IME Life’s says its numbers may change after actuarial valuation and statutory audit and Nepal Life’s carries the same condition. Dividends and bonus shares are decided after that valuation. Everything below is therefore a first read and I say where it rests on three full statements rather than all twelve.
What a life insurer is actually selling
A policyholder pays premium for years and the insurer promises a payment later: on death, on maturity or on surrender. Between the premium coming in and the promise being paid, the insurer invests the money. That gap is the business. The premium is not the insurer’s income in the way a bank’s interest is. Most of it is a liability the day it arrives.
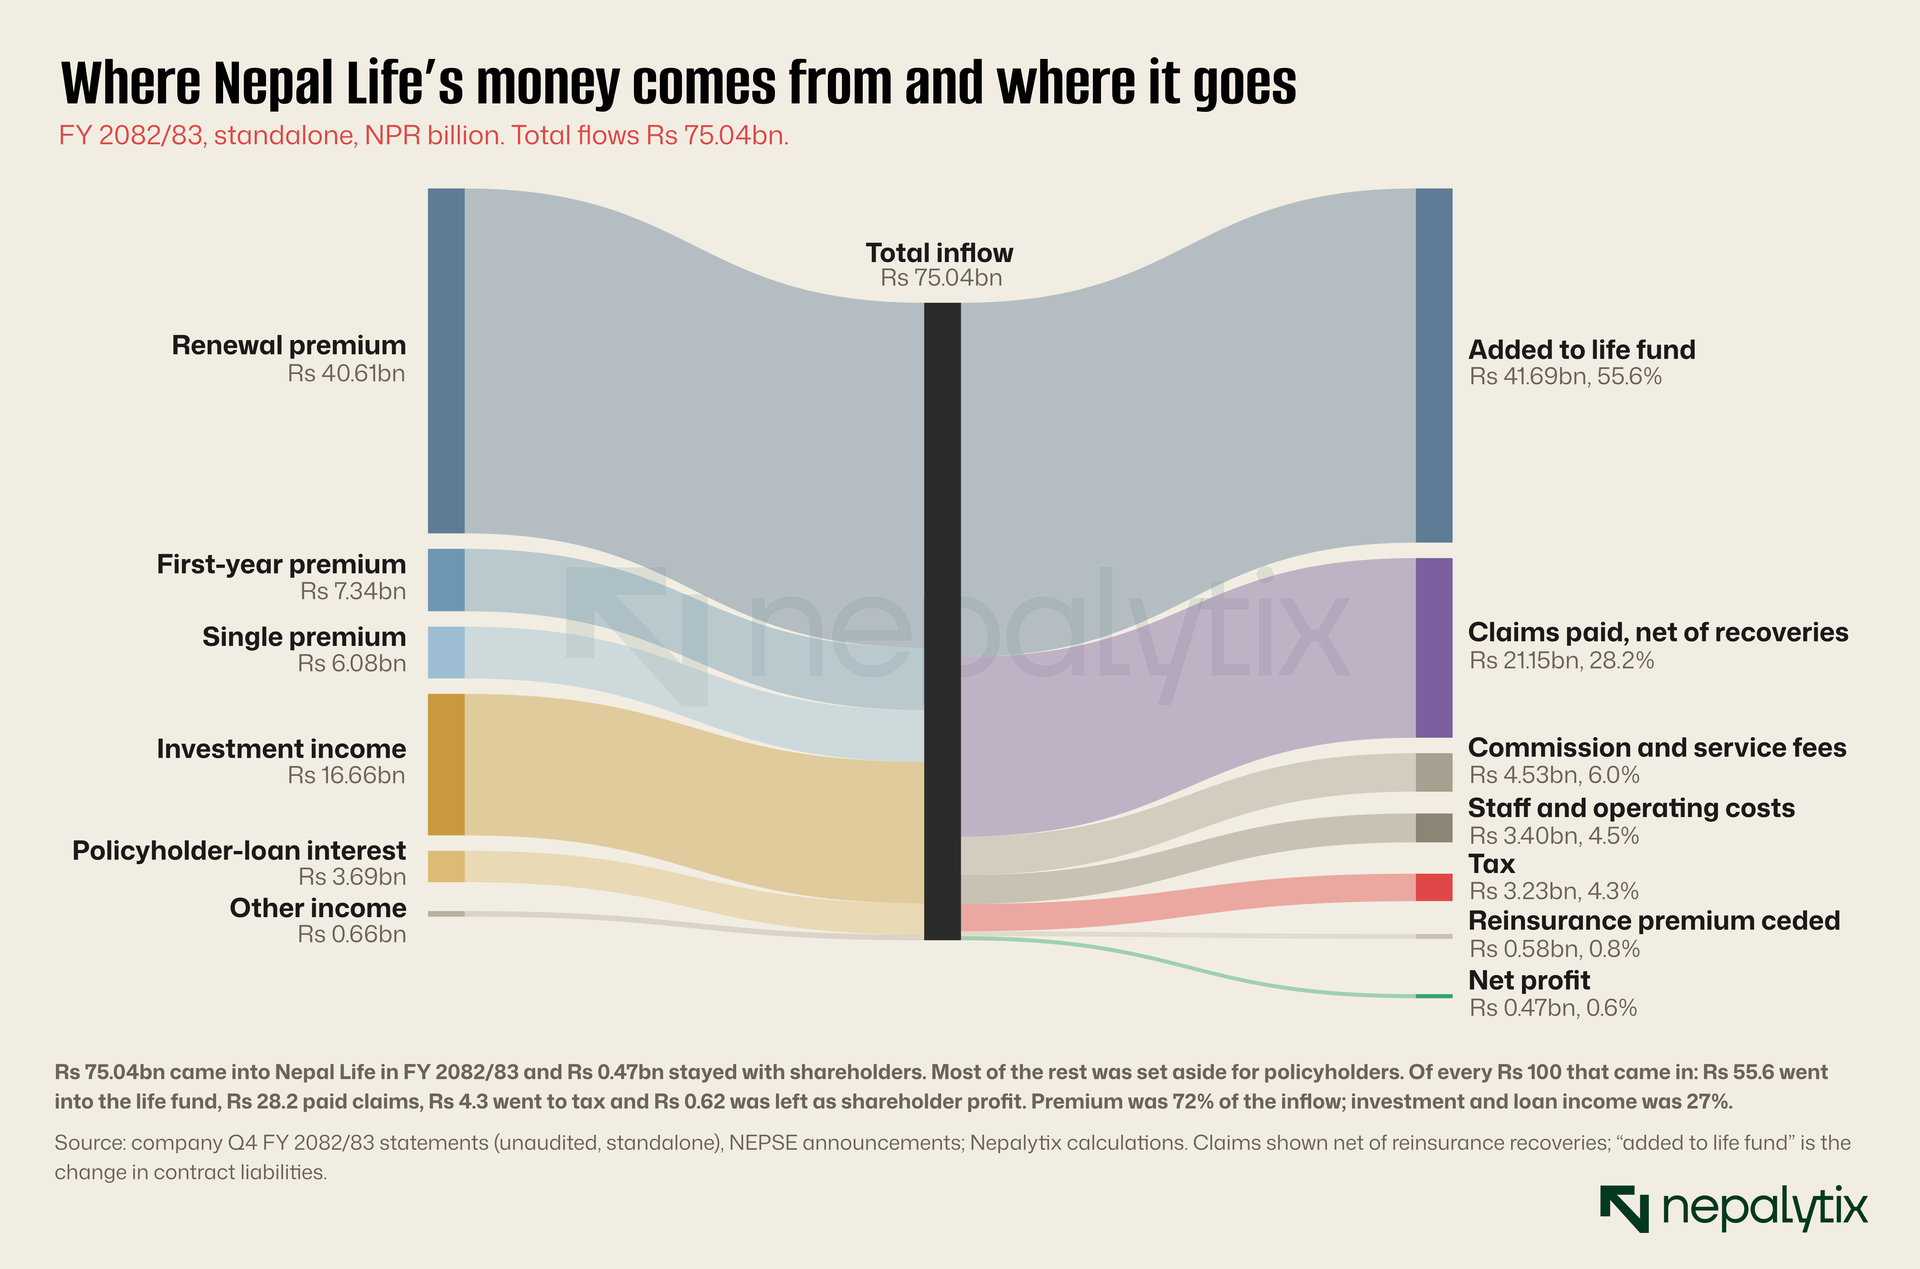
Chart below follows every rupee through Nepal Life, the largest insurer which collected Rs 48.20bn of the sector’s Rs 182.27bn life premium in FY 2081/82 about 26%. Nepal Life’s total inflow in FY 2082/83 was Rs 75.04bn. Premium was 72% of that. Investment income and interest on policyholder loans supplied 27%. A reader who looks only at premium misses more than a quarter of the money coming in and that quarter is the part that responds to interest rates.
The outflows tell the second half of the story. Rs 41.69bn, 55.6% of the inflow, was added to the life fund: it was set aside, not spent. Claims took Rs 21.15bn net of reinsurance recoveries. Commissions and fees took Rs 4.53bn and operating costs Rs 3.40bn. Tax took Rs 3.22bn. Shareholders were left with Rs 0.47bn, 62 paisa of every Rs 100 that came in. Every ratio in the rest of this guide is a way of asking whether that 62 paisa is a stable number or a lucky one.
Premium comes in three kinds
The first number in every Q4 statement is gross premium and the second should be its split. Life insurers report first-year premium, single premium and renewal premium. First-year premium here includes single premium; the statements show single premium as a “of which” line. The identity holds exactly: first-year plus renewal equals gross premium in all three full statements I read, to the rupee.
Each kind means something different. Renewal premium is money from policies already on the books, paid by policyholders who chose to keep paying. It is the closest thing a life insurer has to recurring revenue. First-year premium is new business and costs more to win. Single premium is paid once and is the easiest to inflate: a large single-premium quarter lifts gross premium without creating any claim on next year’s cash.
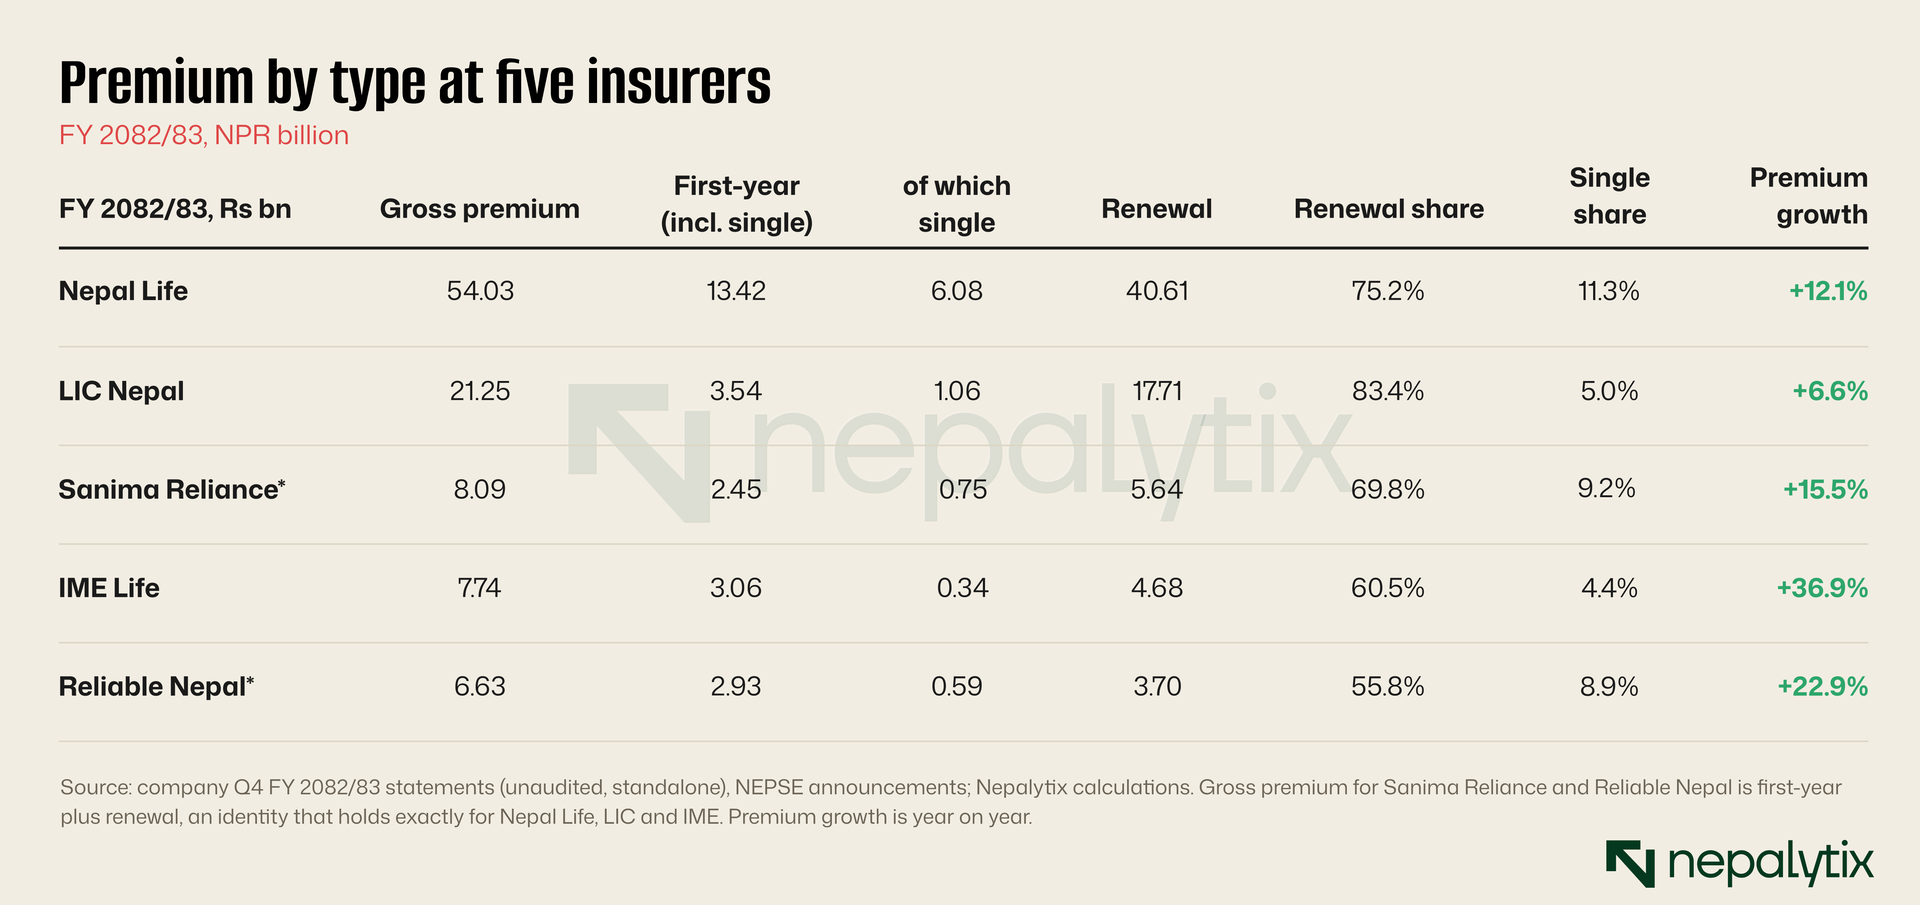
Three things stand out. LIC Nepal’s book is the most seasoned: 83.4% renewal and the slowest growth at 6.6%. IME Life is the opposite: 60.5% renewal, premium up 36.9% and first-year premium up 55% from Rs 1.97bn to Rs 3.06bn. Nepal Life writes the most single premium by a distance, Rs 6.08bn up 31.8% on the year and that is 11.3% of its gross premium against 5.0% at LIC and 4.4% at IME.
The number that misleads is headline premium growth. IME’s 36.9% is real, but most of it is first-year business which is the most expensive to acquire and the least proven to stick. Nepal Life’s commission rose 12.5% to Rs 4.12bn in step with its premium. At IME, commission rose 27.1% to Rs 670m. Growth that has to be bought is growth you should price differently from growth that renews itself.
Divide premium by policies
Two insurers with the same gross premium can be completely different businesses. The statements give policies in force so a division is available to anyone who wants it. The spread is large.
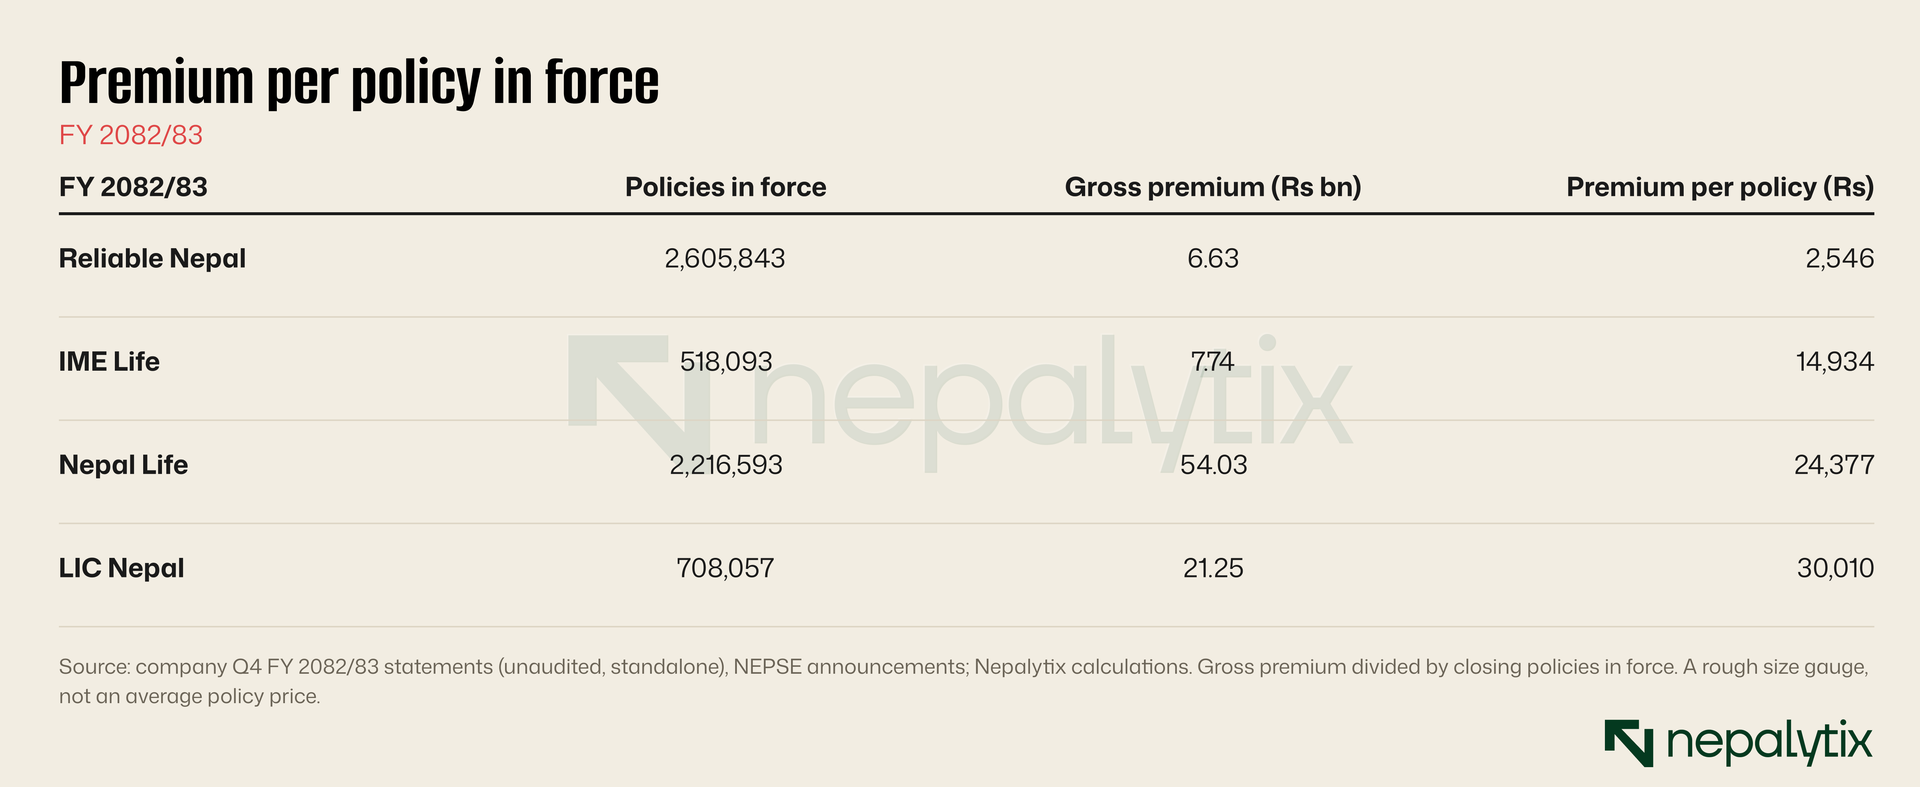
Reliable Nepal collects Rs 2,546 of premium per policy in force. LIC Nepal collects Rs 30,010, about twelve times as much. Same licence, same regulator, same line of the income statement, entirely different businesses: one is built on a very large number of small policies, the other on a modest number of large ones. ShareSansar has long warned readers that policy counts can include low-premium schemes such as foreign-employment cover which carry little net premium. That is why a count of policies, taken alone, tells you very little about the size of an insurer.
This ratio is crude. It divides a year’s flow by a year-end count and mixes new and old business. Use it to see that two insurers are not comparable not to say which is better. A low premium per policy means servicing costs are spread over small tickets and it makes the expense ratio and the lapse rate more important, not less.
The policies that leave the book
Persistency, the share of policies that keep paying is the single most important quality number for a life insurer. None of the three full statements I read reports it. But the statements do give policies in force at the start of the year, policies issued during the year and policies in force at the end. The policies that left the book fall out as a remainder.
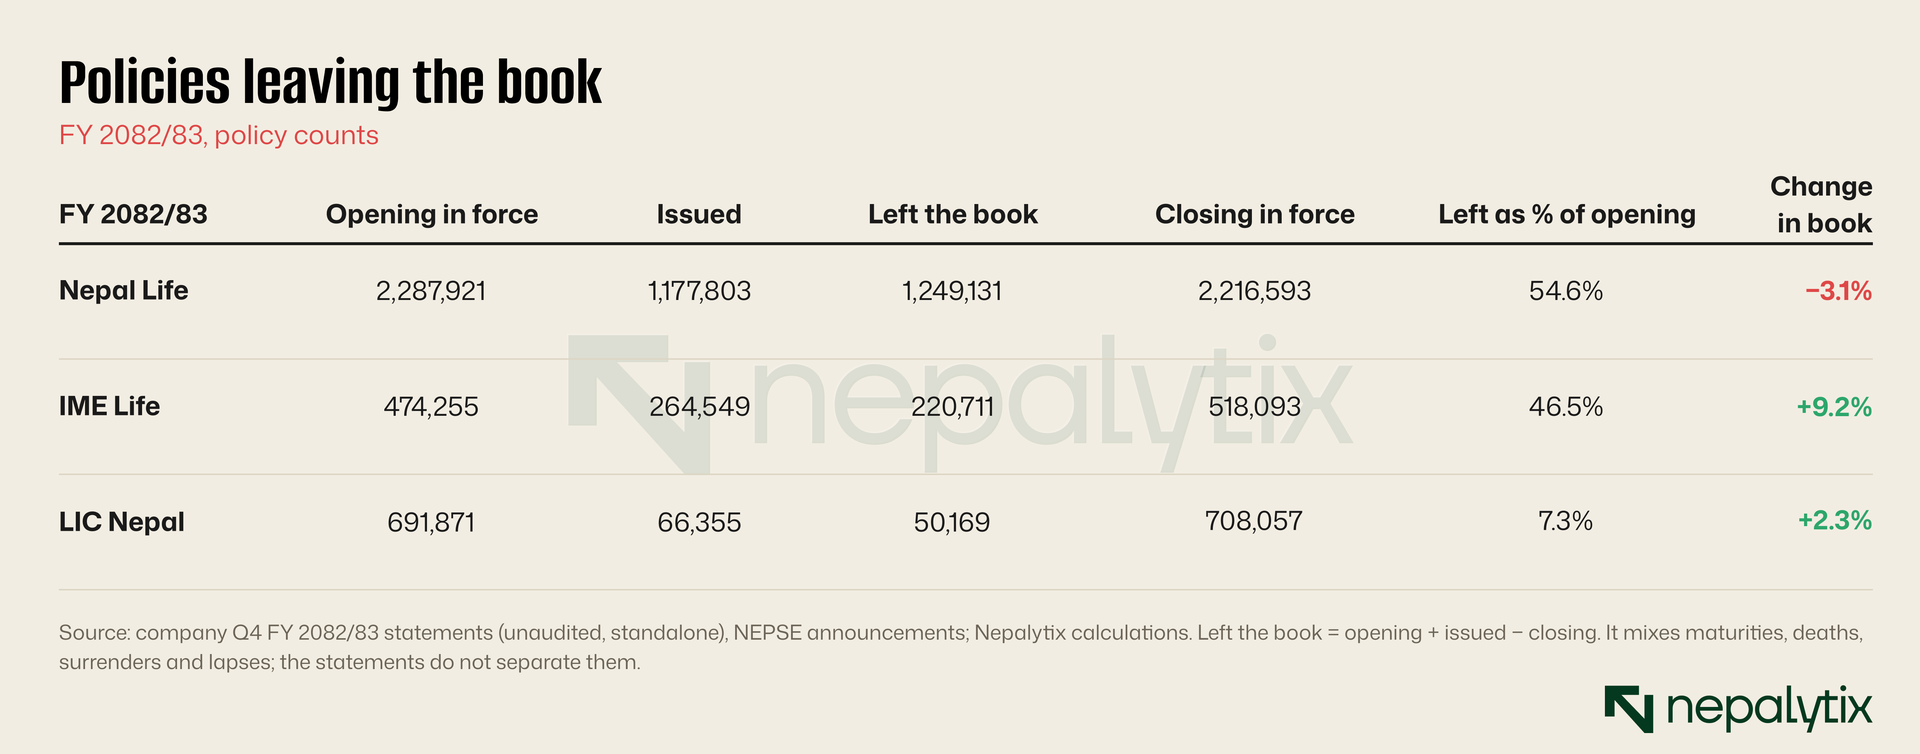
Nepal Life issued 1,177,803 policies in FY 2082/83, 52% more than the 774,351 the year before. Its book still shrank 3.1%, from 2,287,921 to 2,216,593 because 1,249,131 policies left, 54.6% of the opening book. IME Life shows the same pattern: 264,549 issued, 220,711 gone, 46.5% of the opening book. LIC Nepal issued 66,355 and lost 50,169, 7.3%.
Read this carefully. Policies leave for good reasons as well as bad: they mature, claims are paid, customers surrender. A single-premium or short-term policy leaves the book quickly by design and Nepal Life wrote Rs 6.08bn of single premium. That is a hypothesis, not a finding; the statements give no maturity profile. But the gap between 7% and 55% is too wide to be noise. If you read only “policies issued” you would conclude that Nepal Life’s book is growing fast. It is not growing at all. Ask any insurer you follow for its 13th- and 25th-month persistency. The company calculates it as a matter of course.
Read the life fund before profit
The life fund is the balance sheet of a life insurer. It is what the company has accumulated from premium and investment returns, net of payouts, to meet policy liabilities. It is not shareholders money and it is far larger than shareholders money.
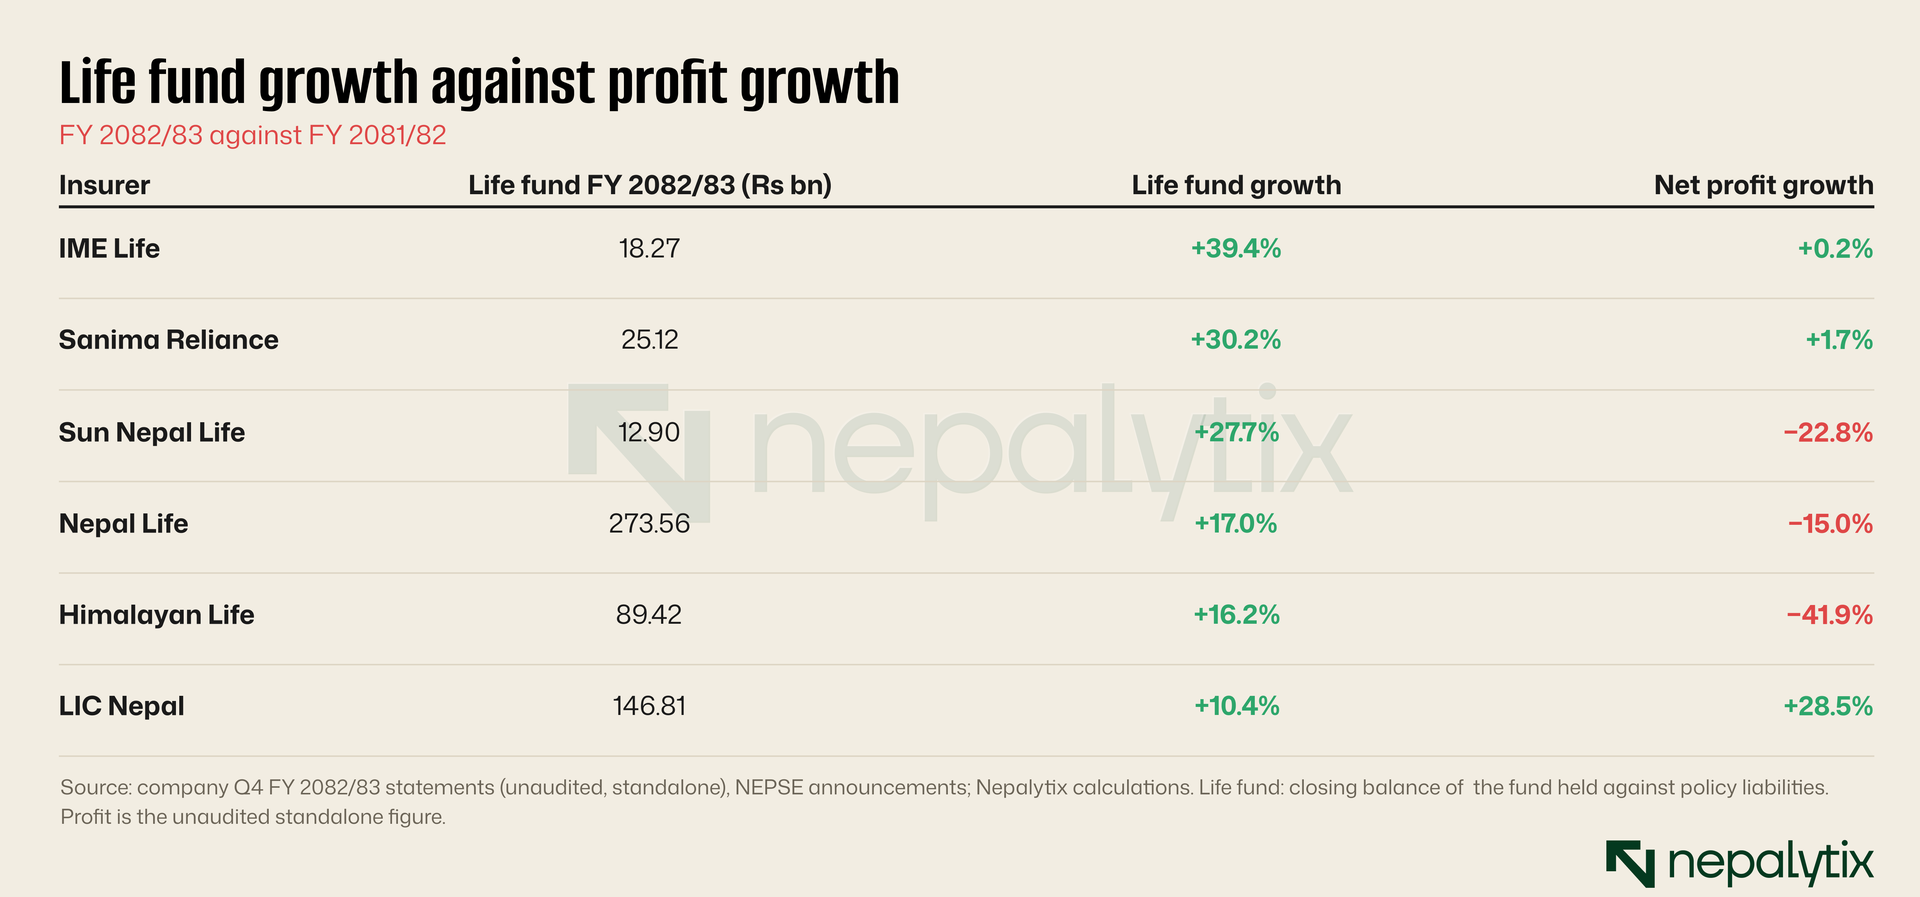
At all six insurers in the table the fund grew by double digits, from 10.5% at LIC to 39.4% at IME. Profit growth in the same year ran from −41.9% to +28.5%. There is no pattern linking them, which is the point. The fund grows with premium and investment returns. Profit depends on how the insurer sets aside reserves, how it is taxed and what happens at valuation. A growing fund tells you the book is expanding. A falling profit tells you nothing about whether the book is sound.
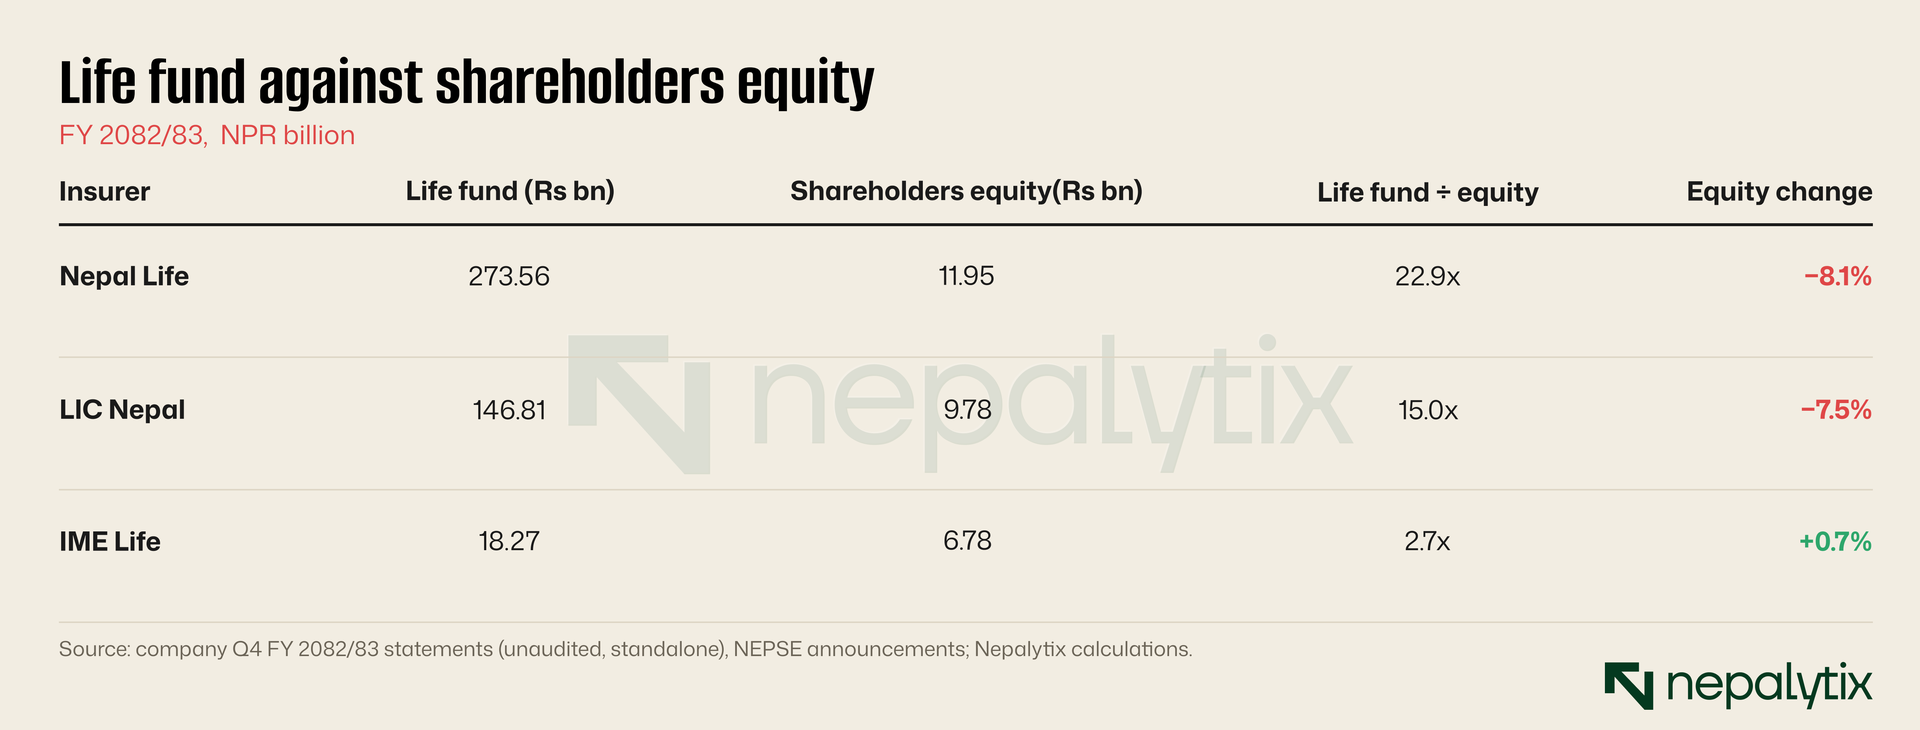
The second table shows how thinly shareholders’ capital sits under the fund. Nepal Life’s life fund is 22.9 times its equity; LIC’s is 15.0 times; IME’s only 2.7 times. Equity fell at both of the larger insurers while their funds grew: 8.1% at Nepal Life and 7.5% at LIC. The condensed statements do not say why. Dividends and bonus-share issues are the usual suspects but check the reserves line in the full report before assuming. A rising fund on a falling equity base is exactly the pattern that makes the solvency ratio matter.
Who moved the profit
Now the line that started this guide. The 12 listed life insurers combined net profit fell from Rs 5,216.3m to Rs 5,089.7m, a drop of Rs 126.6m, or 2.43%. MetLife and Rastriya Jeevan Beema are not listed and are outside the total. Chart below breaks the change down by company.
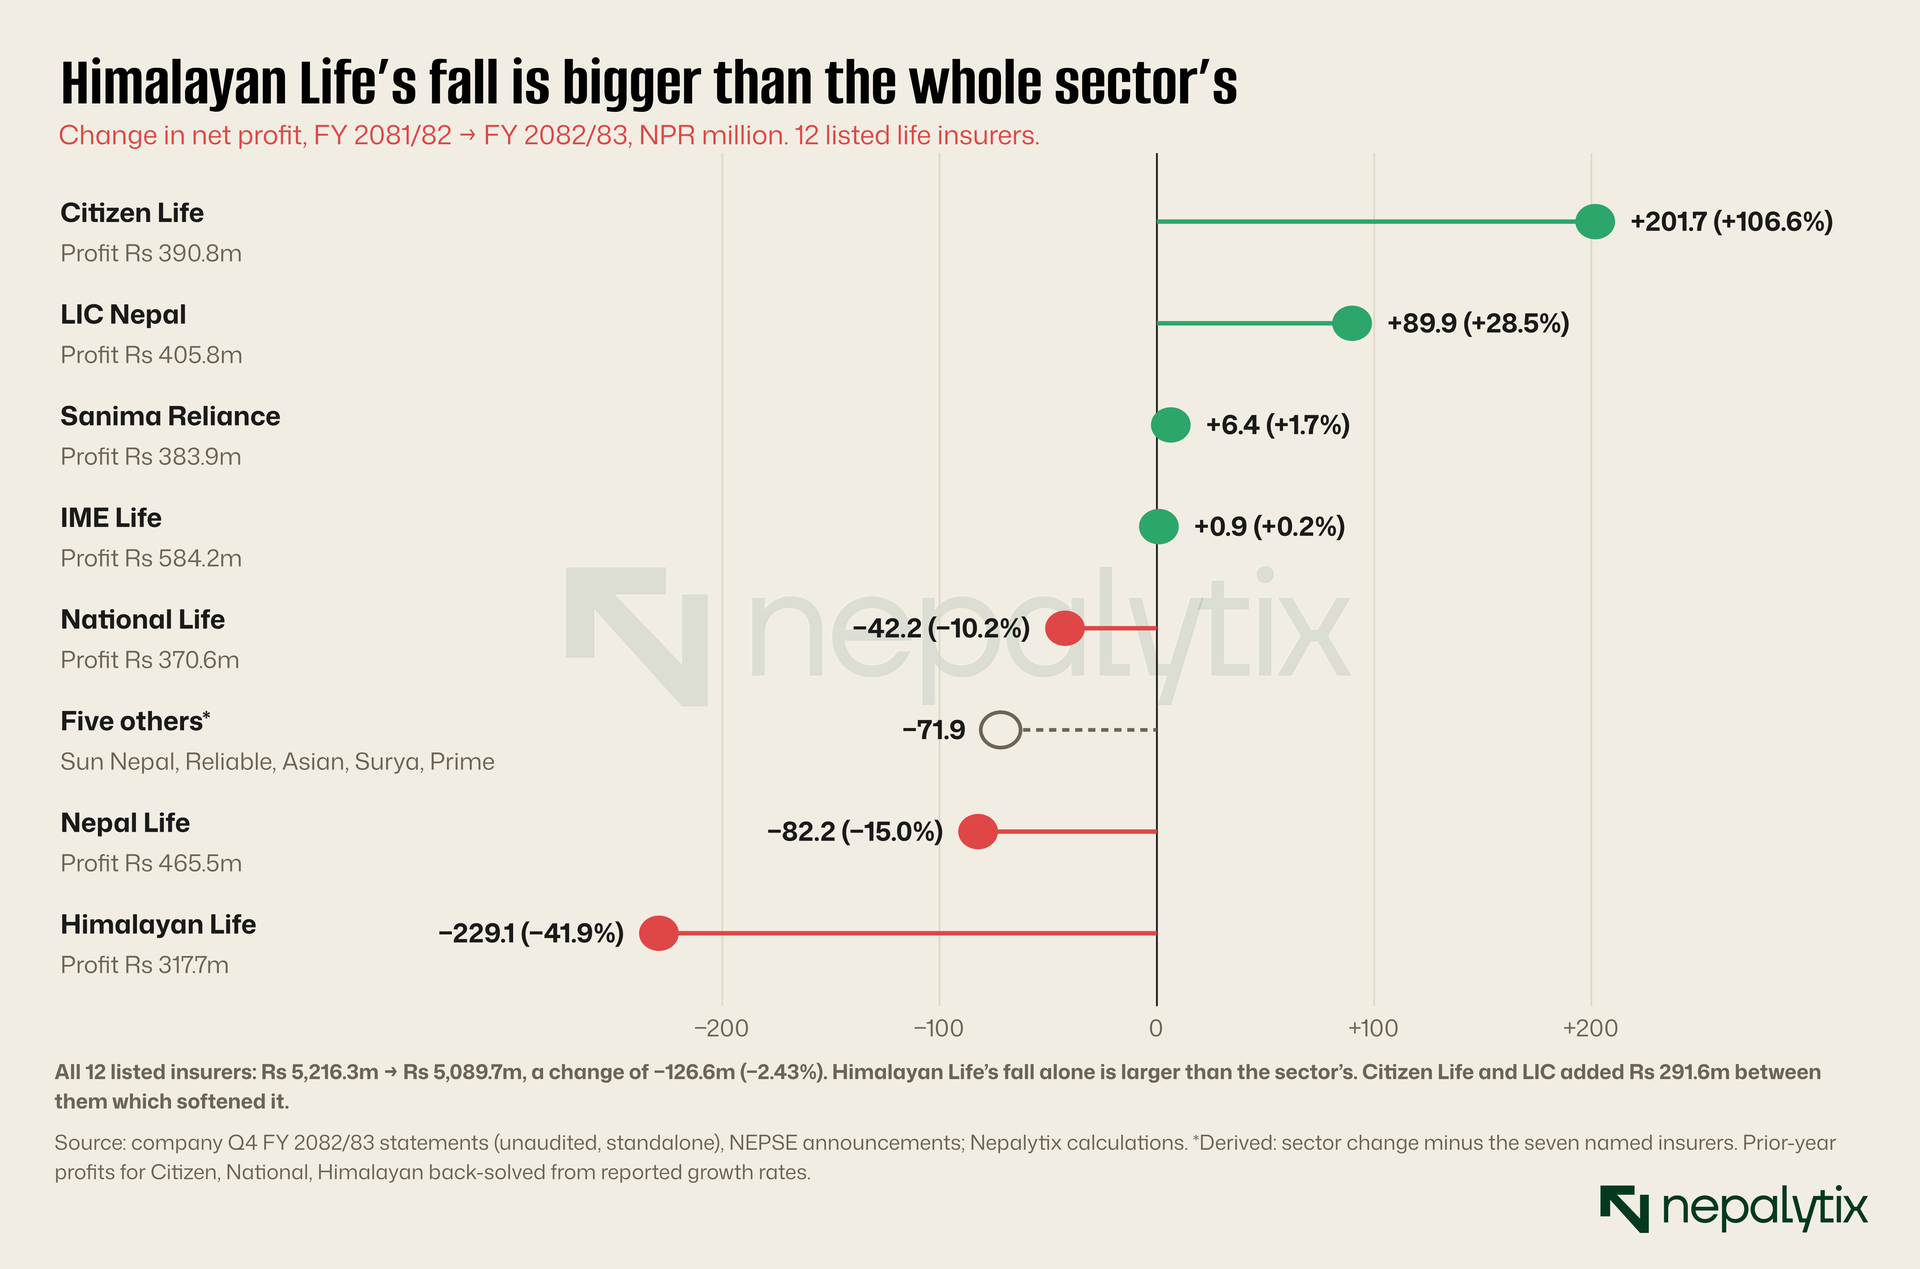
Himalayan Life’s fall alone exceeds the sector’s. Citizen Life’s profit more than doubled, up 106.6% to Rs 390.8m and LIC’s rose 28.5%. Five insurers could not be broken out here because I have not read their full statements; their combined change by subtraction is a fall of Rs 71.9m. That figure is derived and should be read as an estimate until the statements are checked. The headline number, “profit down 2.4%”, hides a range from −42% to +107%.
Before you read a growth rate, two warnings. The Q4 profit is pre-valuation so the figure that eventually reaches dividends will differ. And net profit, the figure in every headline is not the same as the profit the business made. The tax section below shows why.
Claims paid is not a loss ratio
In life insurance, claims include maturities and surrenders as well as deaths and the condensed statements do not split them. So “claims paid divided by premium” cannot be read the way a non-life loss ratio is read. It mostly reflects product mix and the age of the book. An insurer with many endowment policies maturing will show high claims paid and be healthy. An insurer with a young book and few maturities will show low claims and may be no safer.
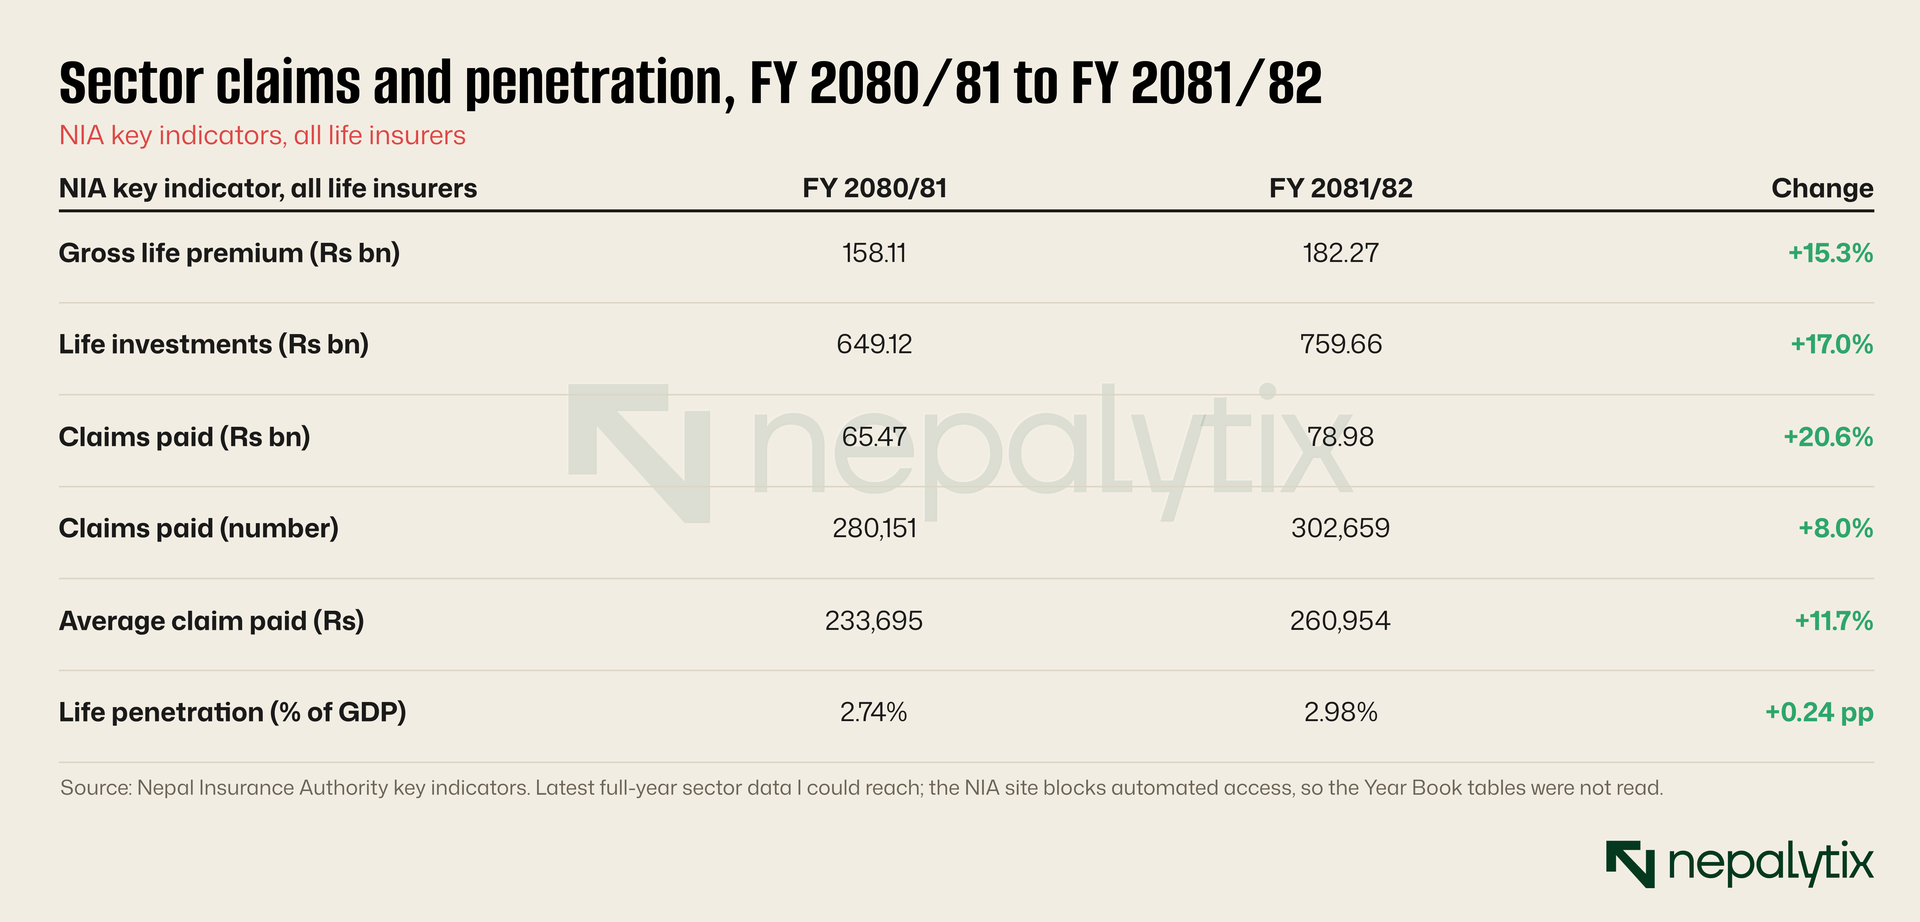
At the sector level, the NIA’s FY 2081/82 figures show claims paid up 20.6% by amount but only 8.0% by number so the average claim rose 11.7% to Rs 260,954. Do not carry that pattern into FY 2082/83. In this year’s statements the largest insurers move in different directions.
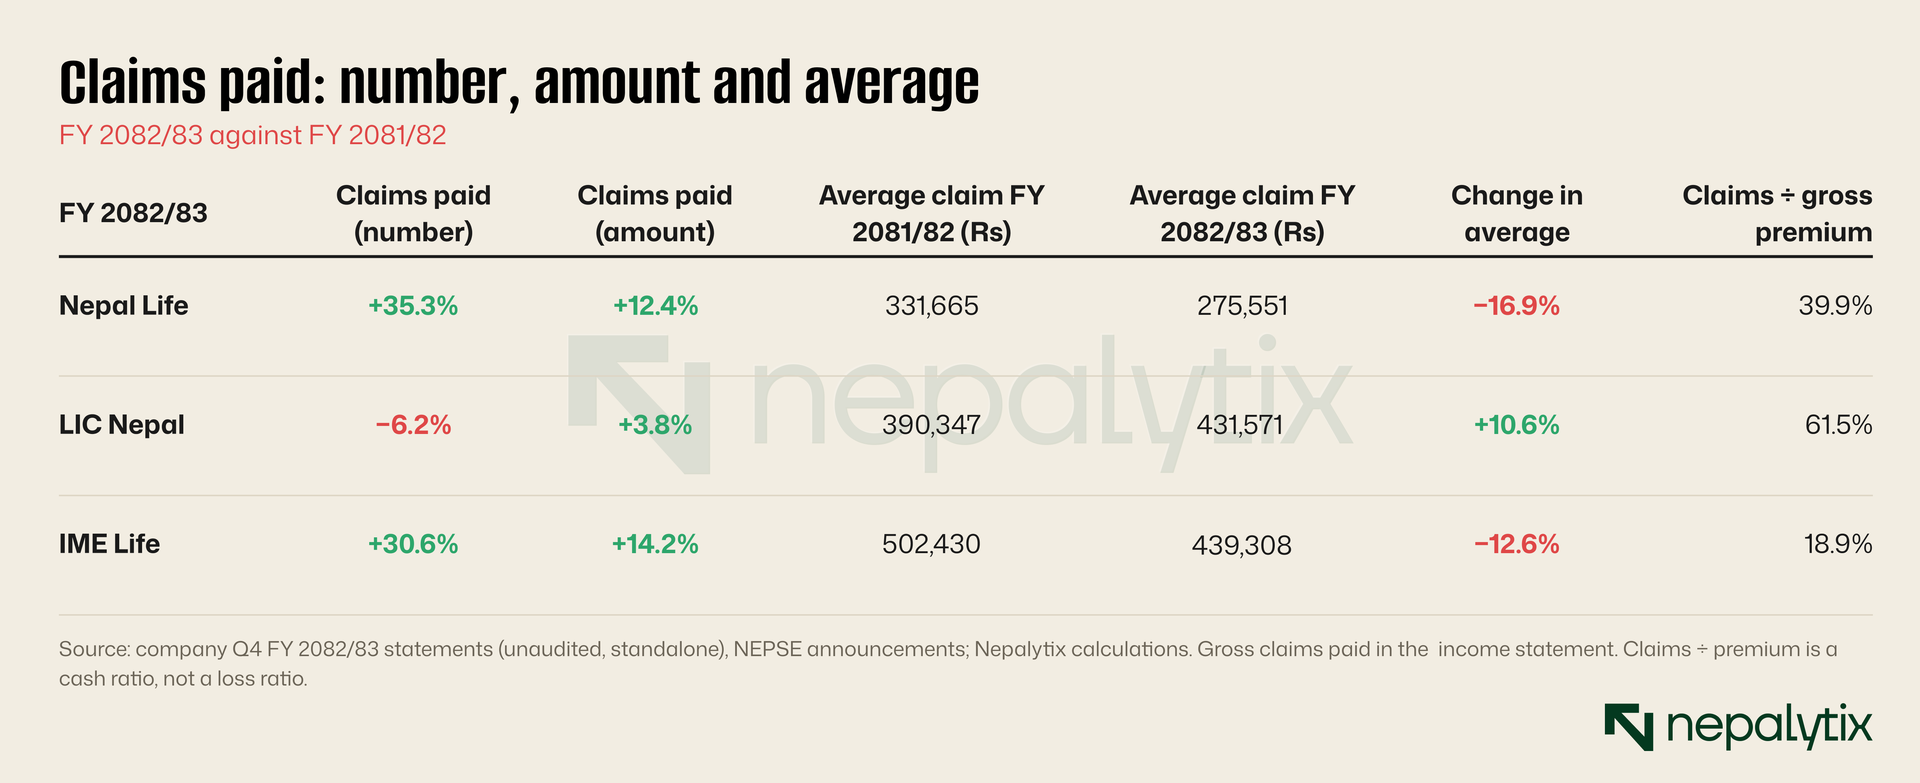
Nepal Life paid 35.3% more claims by number but only 12.4% more by amount, so the average claim fell 16.9%. LIC paid 6.1% fewer claims and 3.8% more by amount, so its average rose 10.6%. IME’s count rose 30.6% and its average fell 12.6%. The cash ratios, 39.9% at Nepal Life, 61.5% at LIC and 18.9% at IME, differ by a factor of three and say nothing about underwriting. One figure does carry a warning: outstanding claims, those reported but not yet paid, rose 26.5% in number at Nepal Life, to 24,025, and 26.9% at LIC, to 12,376.
Investment income and the interest-rate squeeze
Investment income is the line a life insurer cannot do without and cannot control. The fund is invested in government securities, bank deposits, debentures and loans to policyholders so its yield follows market rates with a lag. If you read our debenture guide on 25 October, this is the other side of that trade: insurers are among the buyers of those instruments and when coupons fall, this line falls with them.
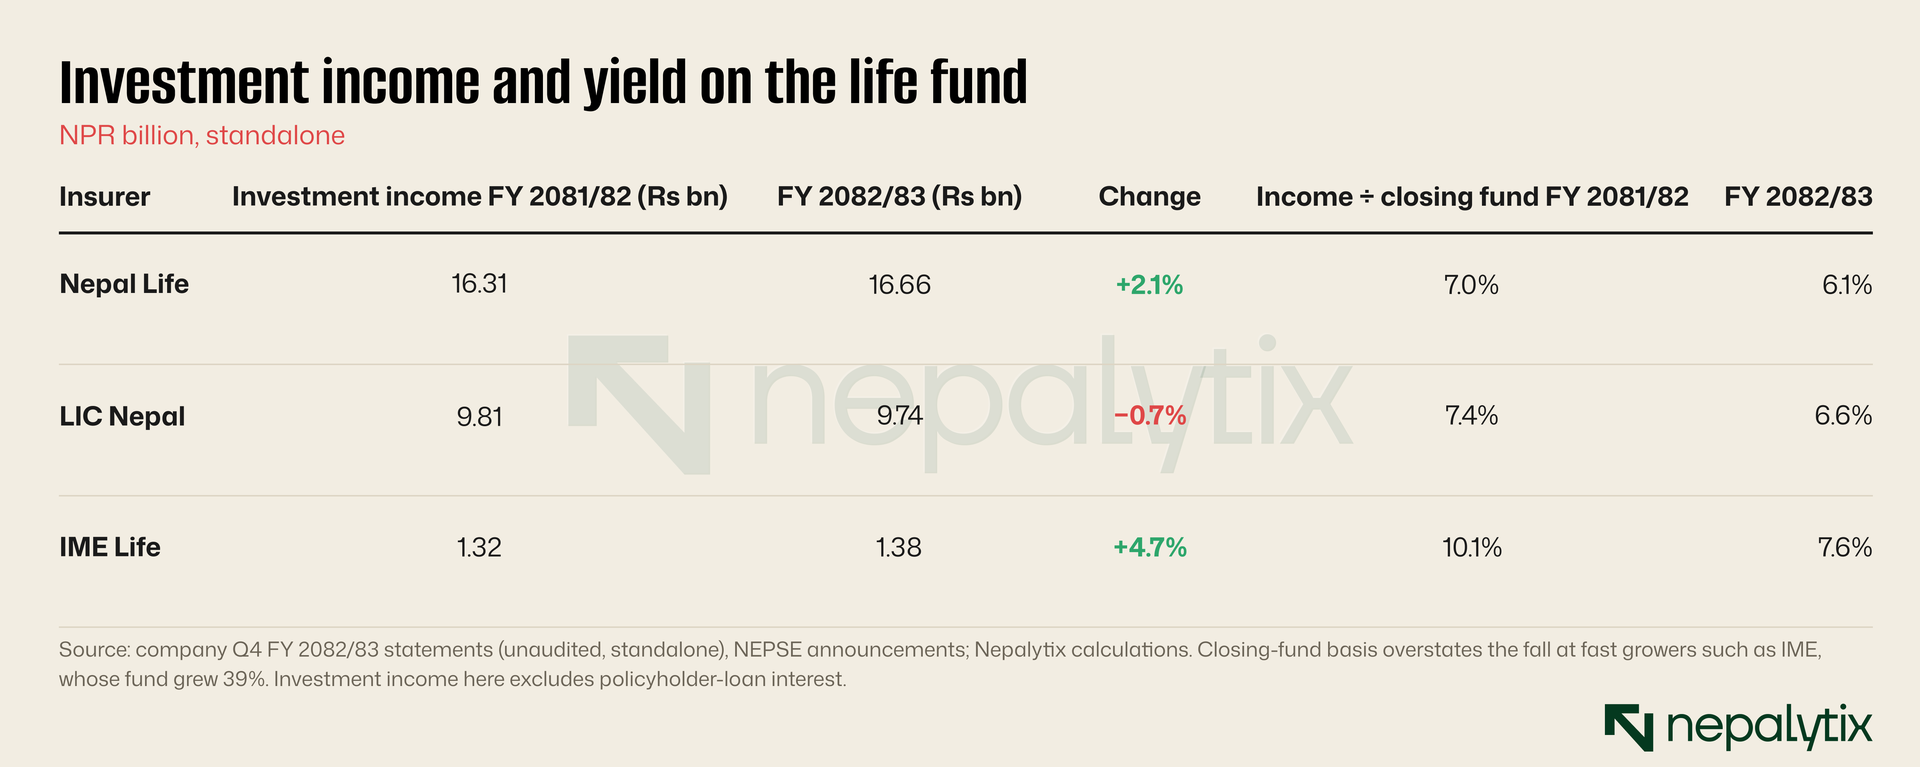
All three insurers earned more in rupees and less per rupee of fund. Nepal Life’s investment income rose 2.1% while its fund grew 17.0%, taking income over closing fund from 7.0% to 6.1%. LIC’s fell from 7.4% to 6.6% and IME’s from 10.1% to 7.6%. Management commentary at Nepal Life and LIC points to lower interest rates. The ratio uses closing balances so IME’s fall is overstated by its 39% fund growth; the direction is not in doubt.
This is why a rising fund does not automatically lift profit. A larger fund earning a lower rate yields a roughly flat income while policyholders bonus expectations, set when rates were higher, do not fall as quickly. The squeeze lands on the surplus.
Capital, and the date on the solvency ratio
Solvency ratio measures how much capital an insurer holds against its obligations and life insurers must disclose it. The disclosure is the point to inspect because the figures are not equally current.
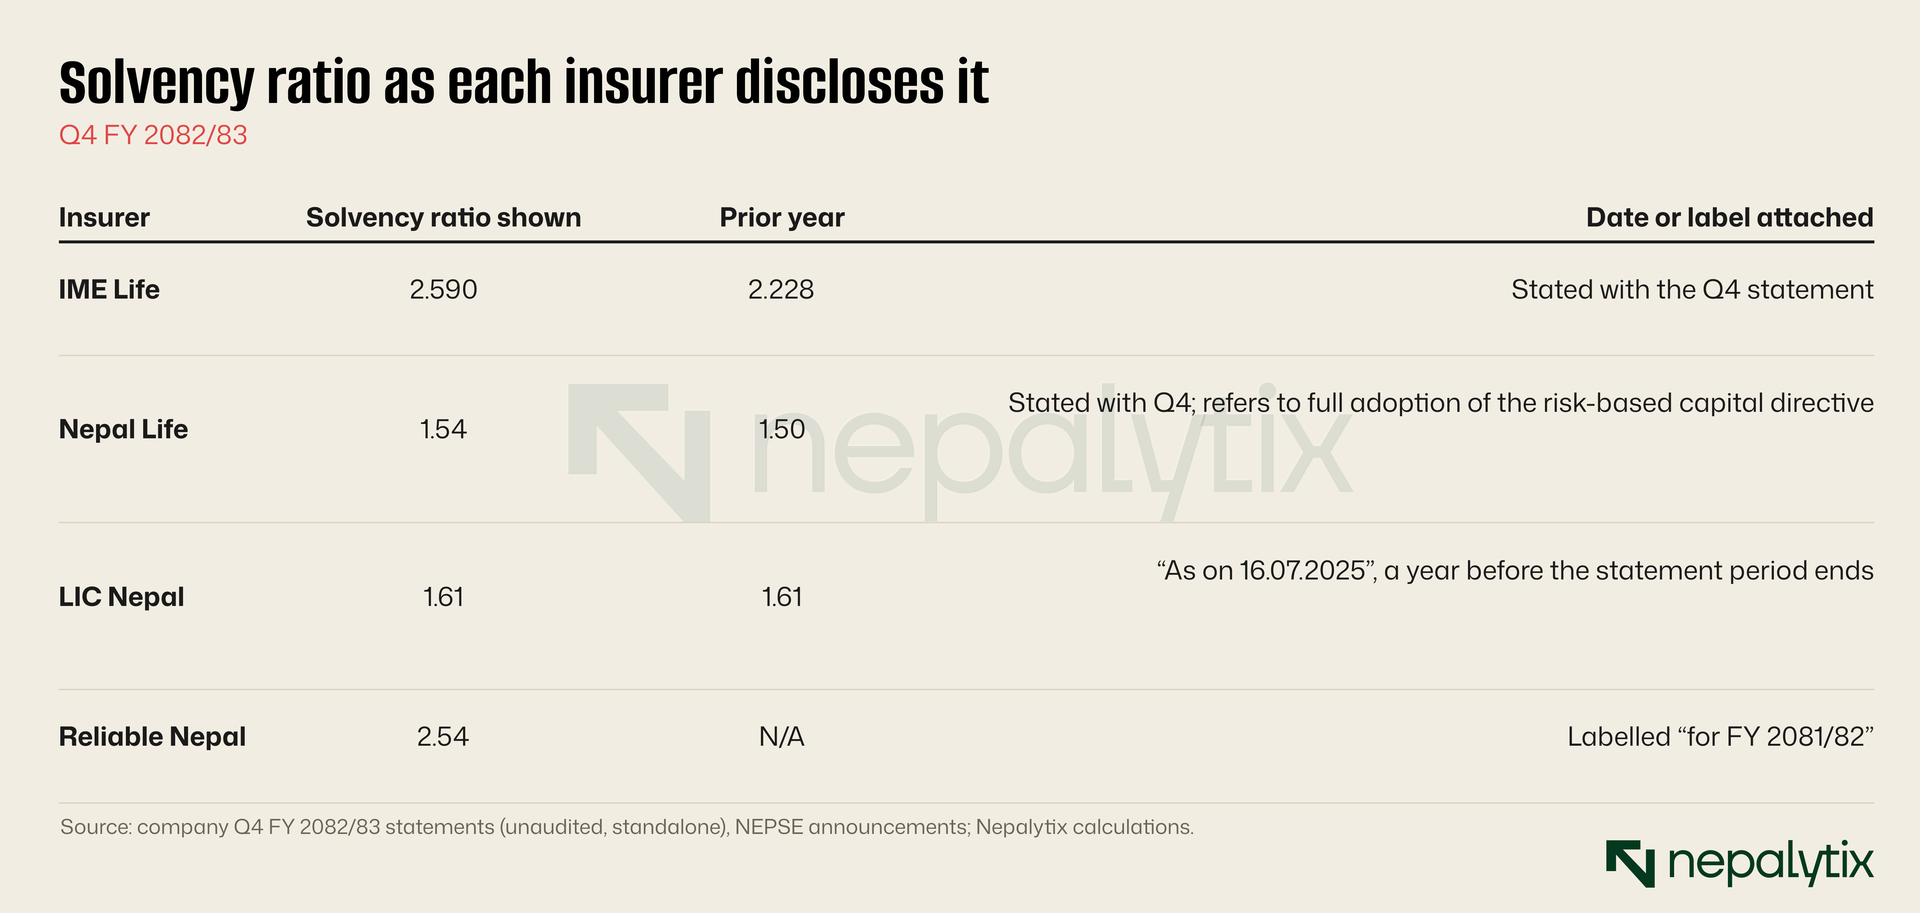
IME Life reports 2.590, up from 2.228. Nepal Life reports 1.54, up from 1.50, and its statement refers to full adoption of the risk-based capital directive so the two figures may not be built the same way. LIC’s 1.61 is dated 16 July 2025, a year before its statement period ends, and Reliable’s is labelled for the previous financial year. A solvency ratio with a stale date is not a solvency ratio; it is a historical record. I have not confirmed the regulatory minimum under the new directive so I am not calling any of these tight or comfortable. Check the floor and the date together.
The tax line
Every full statement I read shows two profit lines: profit before tax and net profit. For a bank the gap is a routine 30% or so. For these life insurers it is far larger and far less stable.
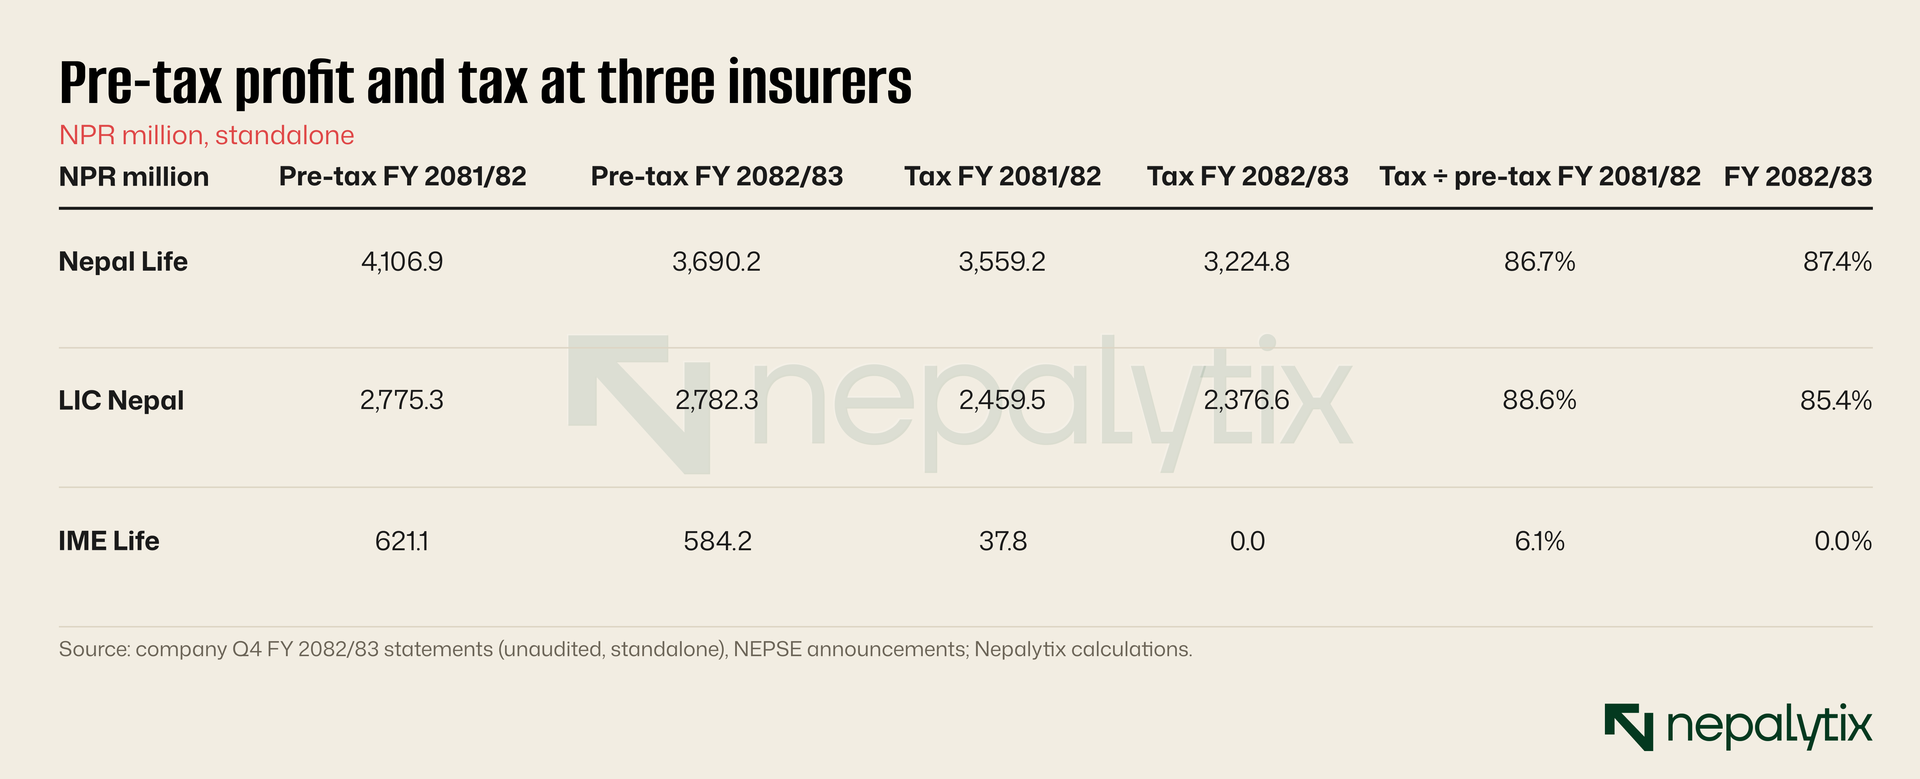
Nepal Life paid Rs 3.22bn of tax on Rs 3.69bn of pre-tax profit, 87.4%. LIC paid Rs 2.38bn on Rs 2.78bn, 85.4%. IME Life paid nothing against 6.1% the year before. The statements do not explain why the charge is so heavy at two insurers and absent at a third. LIC does disclose tax cases pending before the Supreme Court which suggests the answer lies in how taxable income is computed for life business. I will not guess further than that; it is a question to put to each company.
What the numbers do show is that the tax line, not the business, decided the direction of net profit at two of the three. Chart below splits the change in net profit into the change in pre-tax profit and the change in the tax bill.
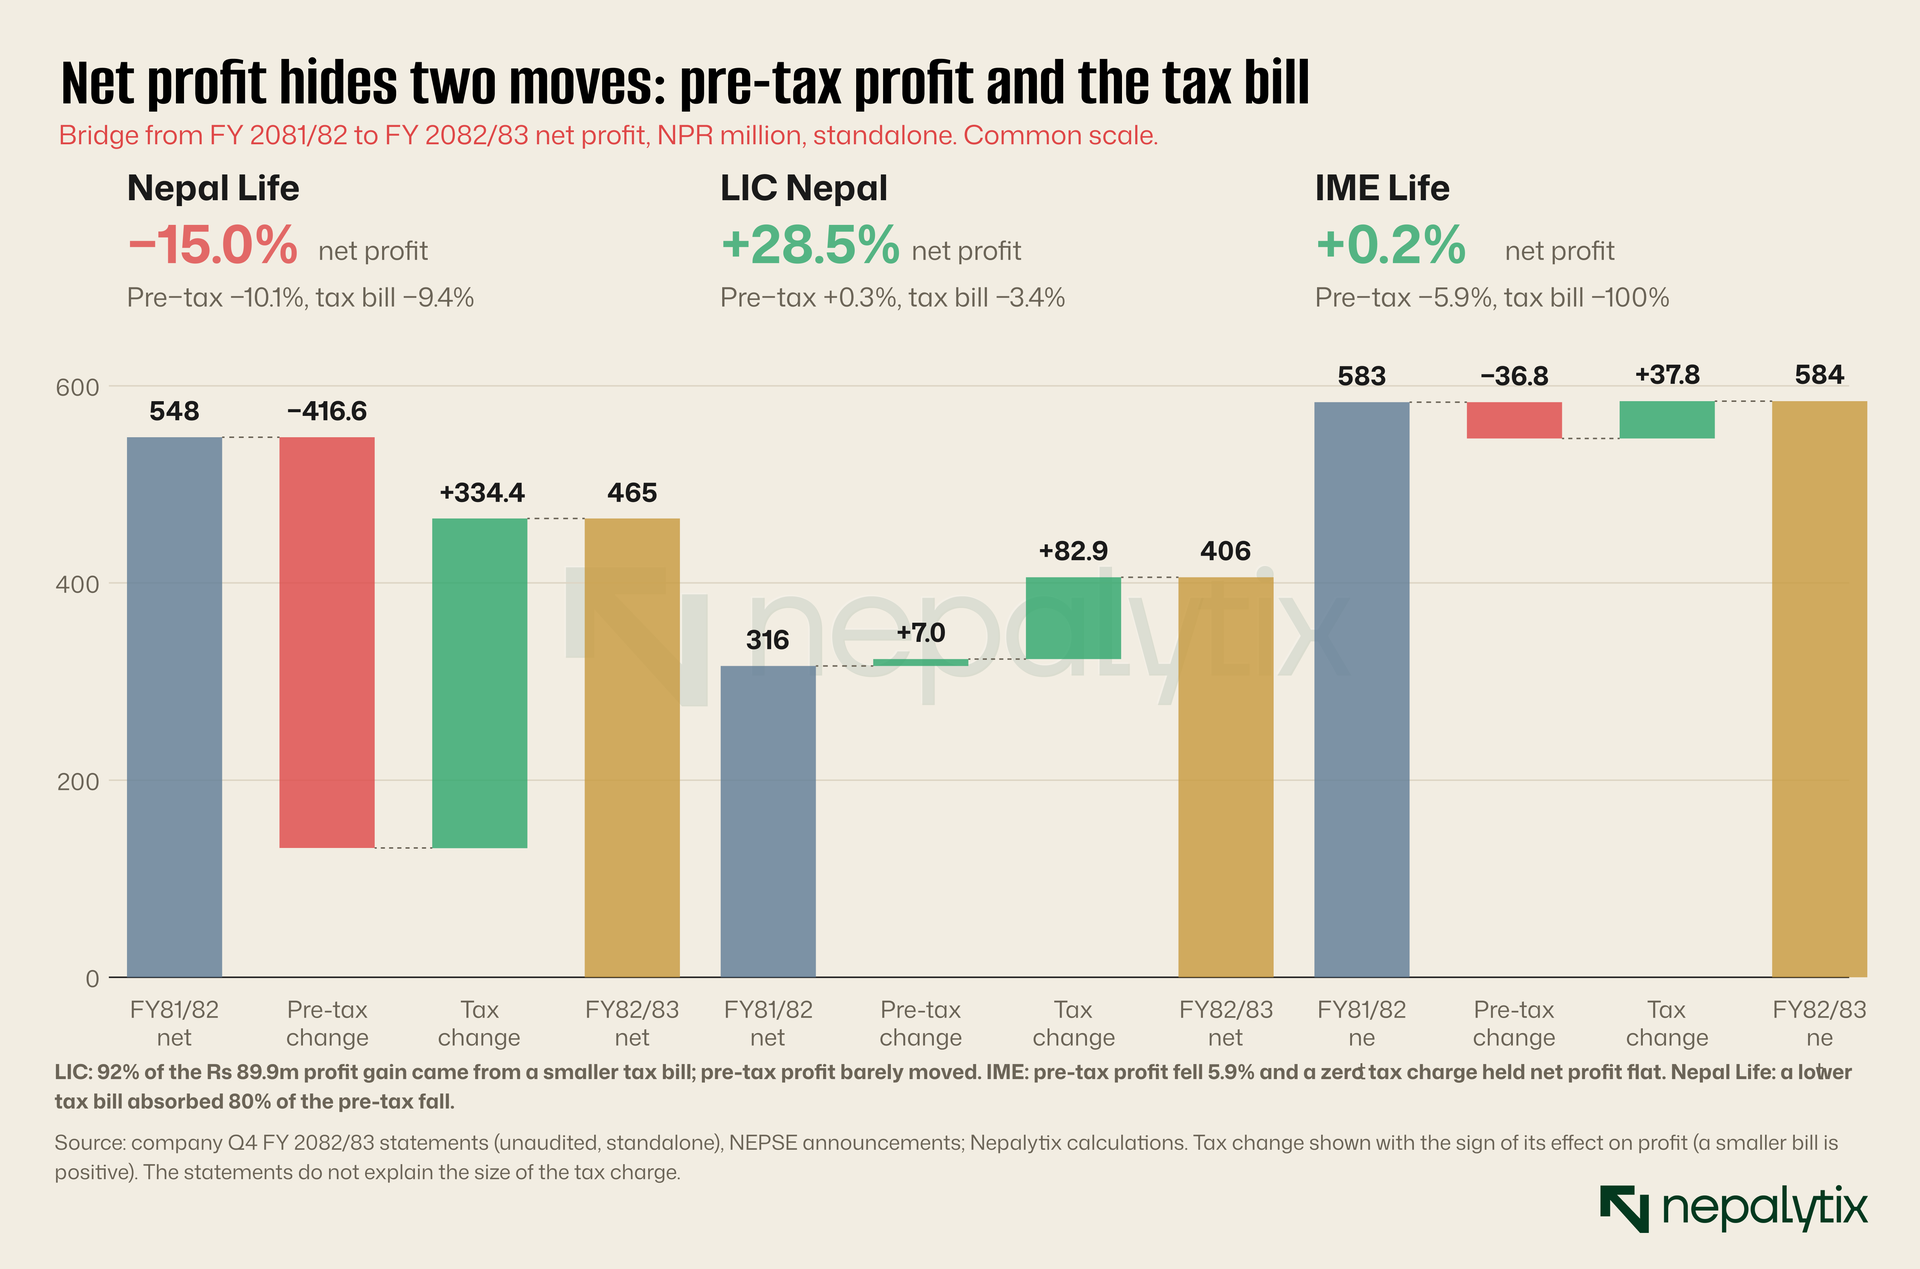
At LIC, net profit rose Rs 89.9m. Pre-tax profit contributed Rs 7.0m of that and a smaller tax bill contributed Rs 82.9m, 92% of the gain. At IME Life, net profit was flat at Rs 584m up 0.2%, but pre-tax profit fell 5.9%; a tax charge that went from Rs 37.8m to zero closed the gap. At Nepal Life, pre-tax profit fell Rs 416.6m and the tax bill fell Rs 334.4m so a lower tax charge absorbed 80% of the decline. In none of the three does the net-profit growth rate describe the business. A +28.5% headline at LIC rests on a pre-tax profit that rose 0.3%.
So split the profit first. Take pre-tax profit growth as the operating signal and the tax change as a separate item to explain.
What life insurers do not tell you
The pattern from banks, telecom, hydropower and hotels repeats here. Nepali companies publish a profit figure, a revenue figure and a capital figure. For a bank those three are the operating metrics. For a life insurer the metrics that matter are different and the disclosure framework, built around banks, does not require them. The three full statements I read do not report persistency, the split of claims by cause, the maturity profile of the book or an embedded value. Every one of those is something the company must calculate to run the business. None of them is in the quarterly statement.
The one disclosure that stands out is the solvency ratio. It is reported, and the dates attached are not consistent. The lesson is not that disclosure fails entirely. It is that disclosure produces what the form asks for, and the form was not designed for life insurance.
A checklist for the next statement
Split premium three ways. First-year, single, renewal. Growth driven by single or first-year premium is a different quality from growth driven by renewal.
Divide premium by policies in force. It tells you which businesses are comparable before you compare anything else.
Roll the policy count forward. Opening plus issued minus closing is the number that left. If it is half the opening book, ask why.
Look at the life fund first. Its growth, its size against equity, and the yield on it matter more than the profit line.
Do not read claims paid as a loss ratio. Ask how much of it is maturity and surrender.
Split profit into pre-tax and tax. Growth in net profit means little until you know which moved.
Check the date on the solvency ratio. And check which directive built it.
Treat Q4 as provisional. Wait for the actuarial valuation and the audited accounts before you size a dividend.
What this does not let you do
It does not rank the insurers. Three full statements and parts of two more are not twelve and the seven I have not read are the obvious next step. It does not value any company: no price, no multiple, no discount to the life fund. It does not explain the tax charge, the fall in equity at the two largest insurers or the surge in policies leaving the book at Nepal Life and IME. Those are the three questions I would put to management first.
It also rests on unaudited numbers. The actuarial valuation can move profit, and the audit can move more. Come back to the audited accounts before you act on any single figure here.
Disclaimer
This report has been prepared by Nepalytix for informational and educational purposes only and does not constitute investment advice, an offer, or a solicitation to buy or sell any securities.
The information contained in this report is based on sources believed to be reliable; however, Nepalytix does not guarantee its accuracy, completeness, or timeliness. Opinions, estimates, and projections expressed herein are those of the authors as of the date of publication and are subject to change without notice.
Investing in securities involves risks, including the possible loss of principal. Past performance is not indicative of future results. Readers are advised to conduct their own independent research and consult with a qualified financial advisor before making any investment decisions.
Nepalytix and its contributors may hold positions in the securities discussed in this report at the time of publication or thereafter.
Neither Nepalytix nor any of its affiliates accept any liability for any loss arising from the use of this report or its contents.