Hydropower Companies Should Publish What They Generate
Nepal has 111 listed hydropower companies worth approximately Rs 630 billion. Yet investors can read their quarterly profits without knowing how much electricity their plants actually generate. The data already exists so why isn't it being disclosed?
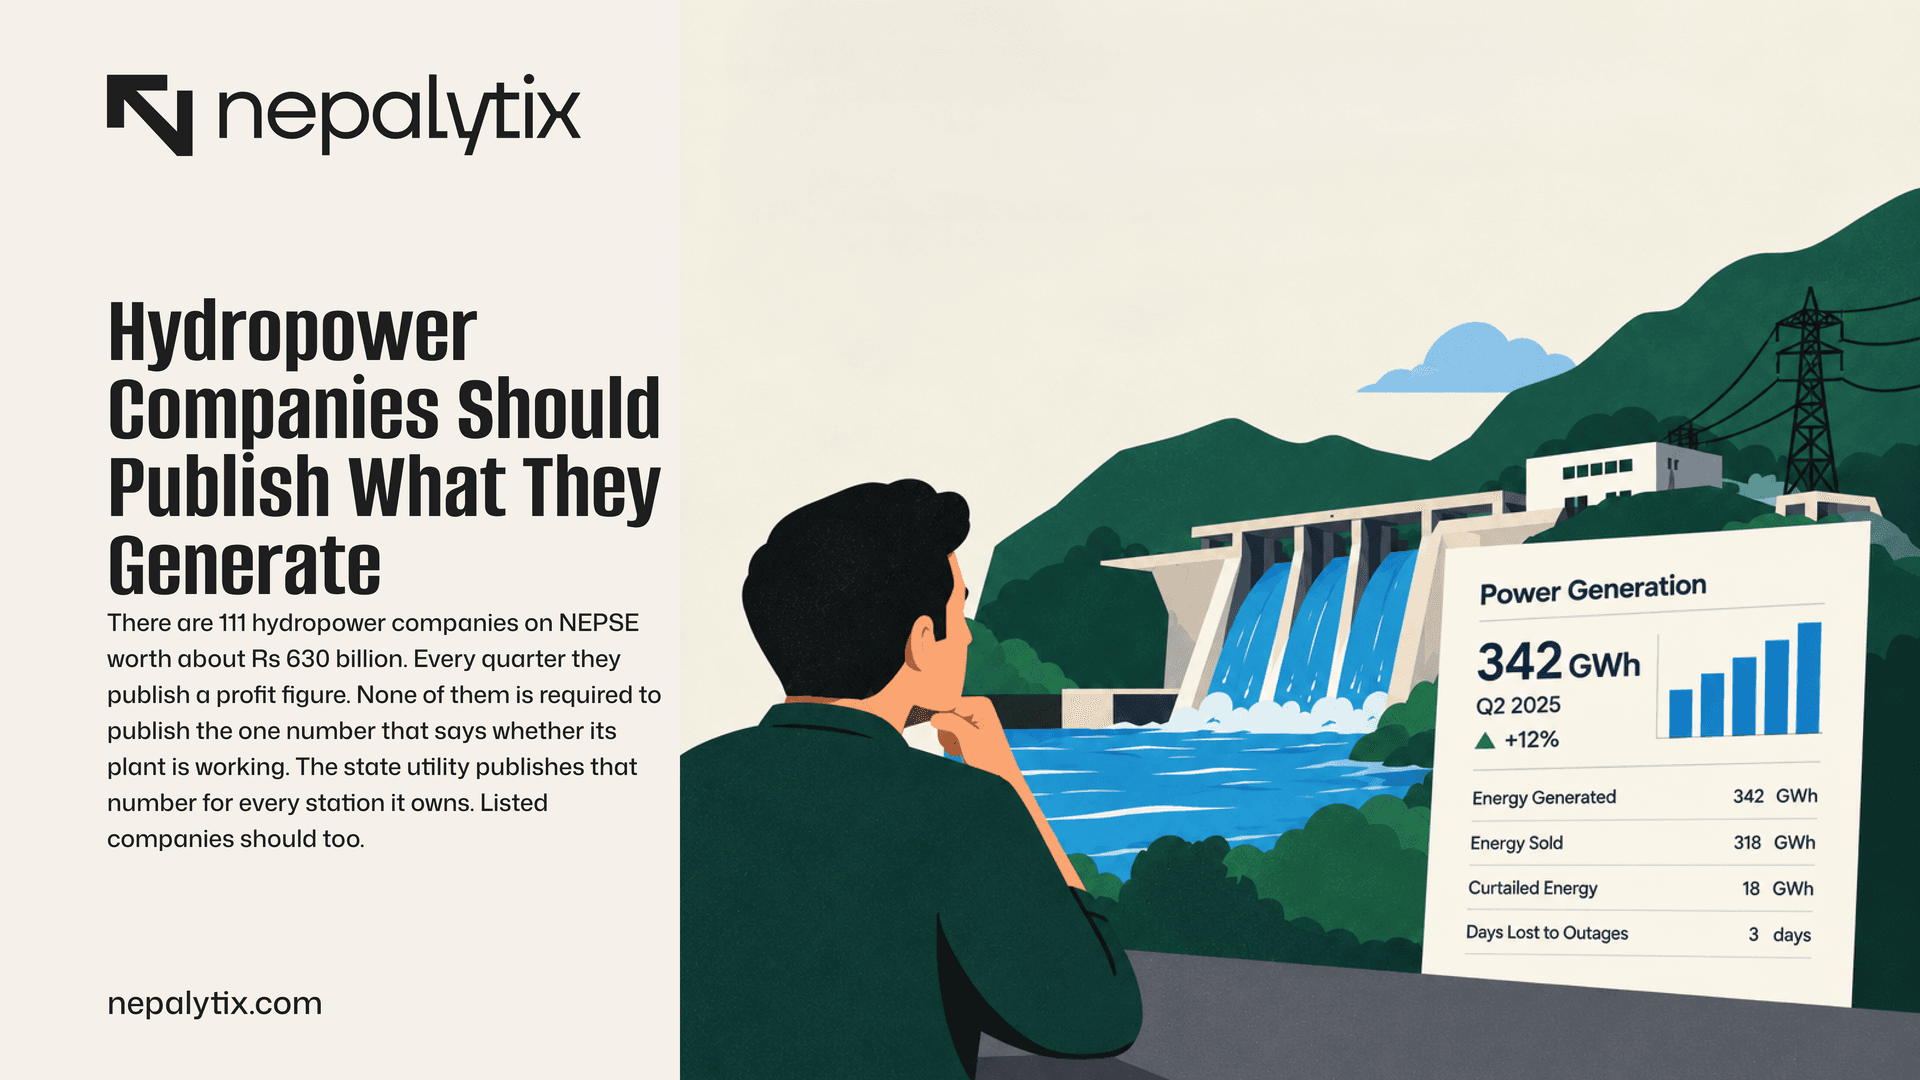
There are 111 hydropower companies on NEPSE worth about Rs 630 billion. Every quarter they publish a profit figure. None of them is required to publish the one number that says whether its plant is working. The state utility publishes that number for every station it owns. Listed companies should too.
The proposition
Every listed hydropower company should publish, each quarter, how much electricity it generated and sold against its contract energy with the energy curtailed by the grid and the days lost to outages. SEBON should make it a condition of the quarterly report. The numbers already exist on every plant's meters and in every monthly bill to the Nepal Electricity Authority. Leaving them out forces investors to guess a company's output from its revenue and as this piece shows, the guess is often wrong by a third.
1. The number that is missing
A hydropower plant does one thing. It turns falling water into electricity and sells it, almost always to the Nepal Electricity Authority under a power purchase agreement. Everything an investor wants to know about such a company flows from a handful of physical quantities: how many megawatts it has installed, how much energy it was designed to produce in an average year, how much it actually produced and how much of that NEA took and paid for. Revenue is energy sold multiplied by tariff. Profit is revenue minus royalties, depreciation, staff costs and, above all, interest. If you know the energy, the rest of the accounts can be checked. If you do not, they cannot.
The quarterly reports of listed hydropower companies follow the same template as every other listed company's: a balance sheet, an income statement, a few ratios and a short narrative. They report revenue and profit. A few mention generation in the narrative, in a sentence, in some quarters. Upper Tamakoshi, the largest listed hydro, prints monthly generation in tables in its Nepali-language directors report, once a year. As far as we can find, no listed hydropower company is required to report its generation and none reports it in a standard, comparable from every quarter.
This is the same gap this publication has found in sector after sector. Telecom companies publish profit but not subscribers. Hotels publish profit but not occupancy. Microfinance lenders publish profit but not arrears by institution. In every case the operating number is collected as a matter of course and required by nobody. For hydropower the gap is the most consequential of all because hydropower is the largest single group of companies on the exchange and the one retail investors trade most. It is also the gap that is cheapest to close because the number in question is literally metered.
This piece makes the argument in four steps. First, it shows that the information exists and is published, just not by the companies investors own. Second, it shows what happens when an investor tries to work it out from what listed companies do publish. Third, it shows why profit is no substitute. Fourth, it sets out what a disclosure should contain. Then it gives the best case against and answers it.
2. NEA publishes it for every station it owns
The Nepal Electricity Authority's annual report, A Year in Review has a page for each of its own power stations. Each page gives the station's installed capacity, its annual design generation, its actual generation in the year, the change on the previous year and the percentage of design and of target it achieved. In the FY2082/83 edition, 15 hydropower stations of 1 MW or more have a full year of generation printed.
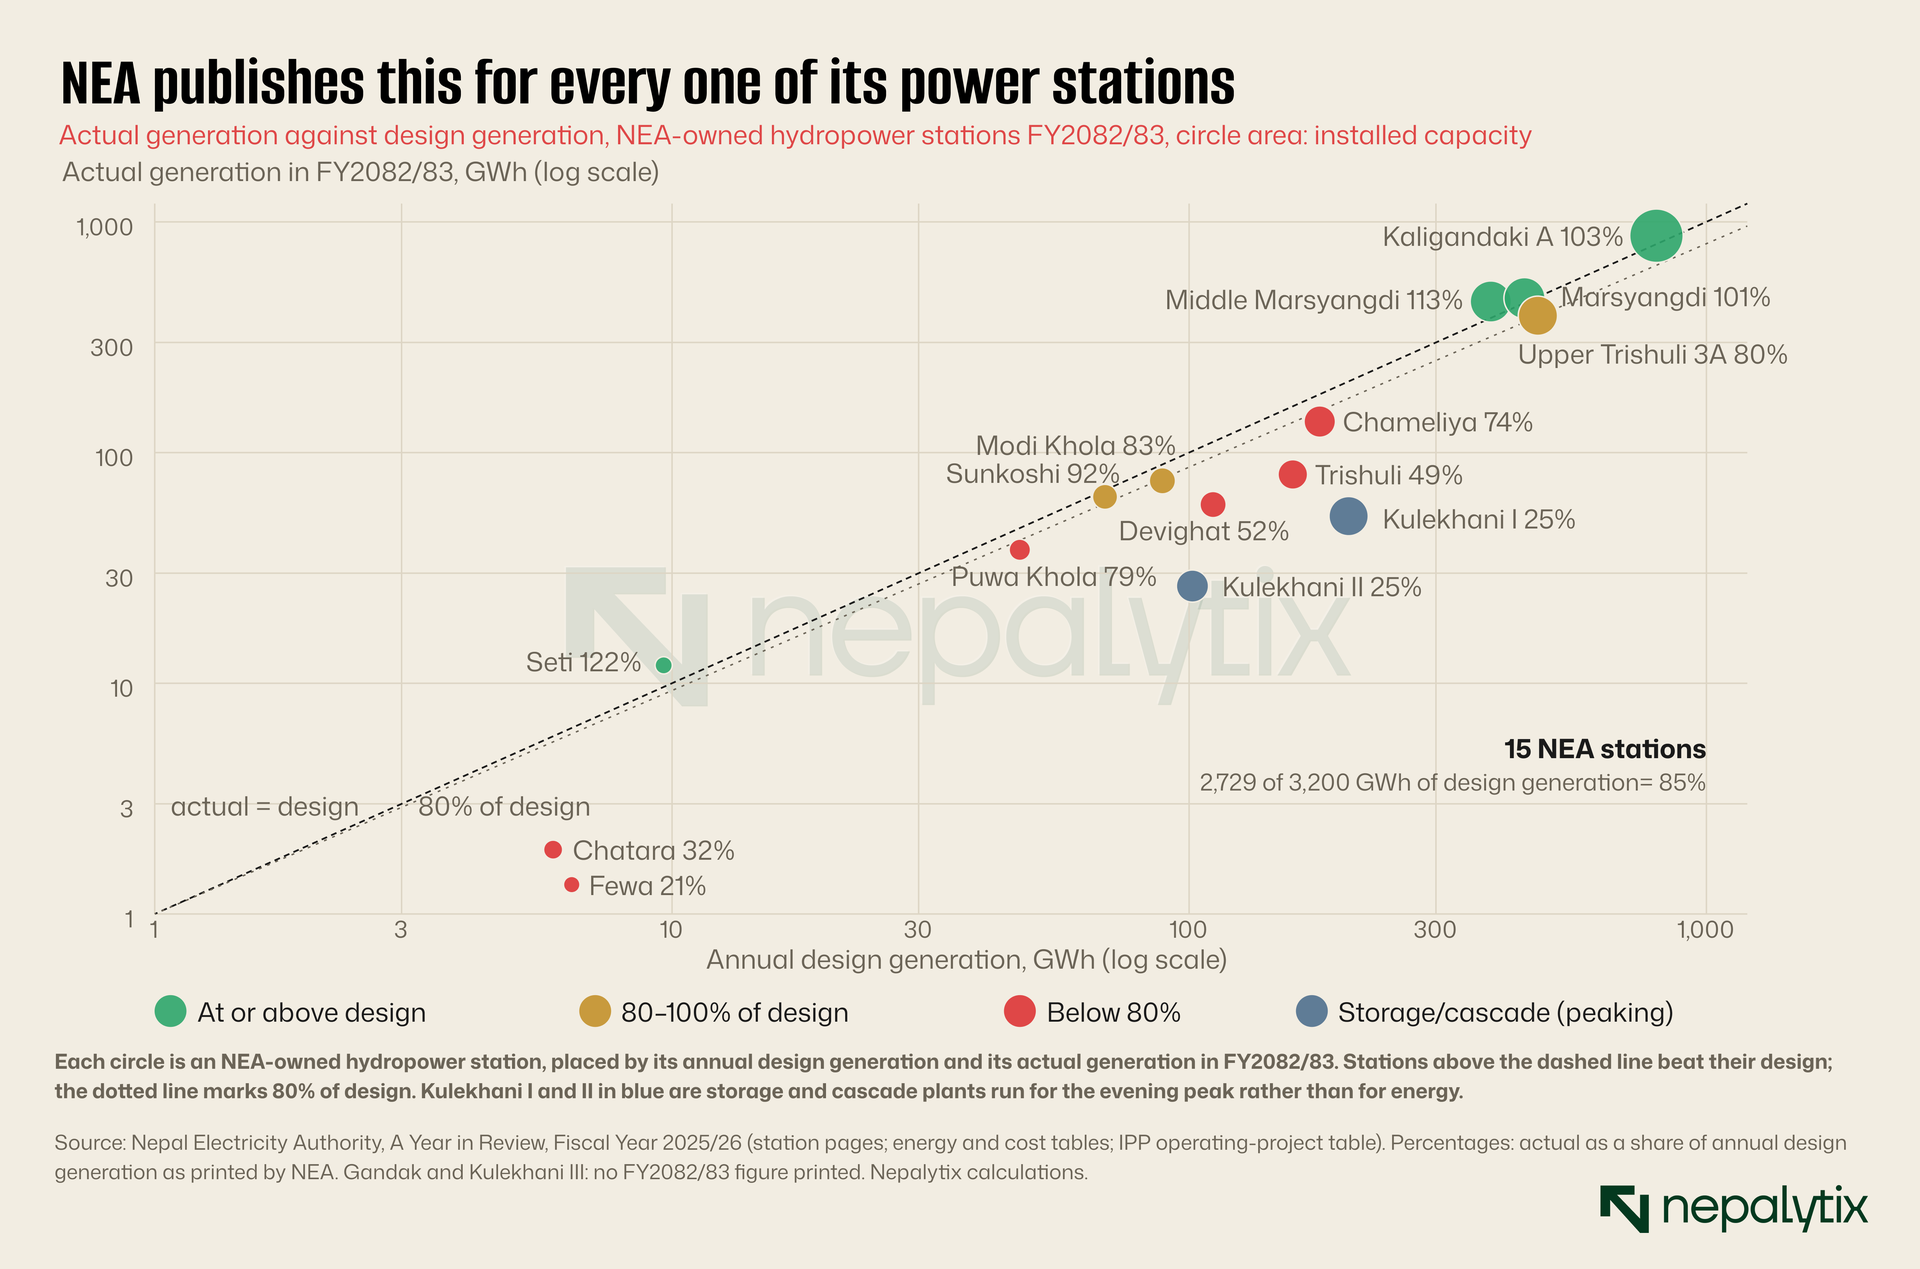
The numbers are not flattering for every station which is the point. Together the 15 stations produced 2,729 GWh against a combined design of 3,200 GWh, 85%. Four met or beat their design. Kaligandaki A, the largest, produced 870 GWh against a design of 842, 103%. Middle Marsyangdi produced 113% of design, Marsyangdi 101% and the 1.5 MW Seti plant 122%. Eight produced less than 80% of design. Some of those have obvious reasons: Kulekhani I and II, at about 25% each are storage and cascade plants that hold water for the dry-season evening peak. Others are less obvious and their pages list the repairs and works carried out during the year: Trishuli, at 49% of design and Devighat, the cascade below it at 52%; Chameliya at 74%; Upper Trishuli 3A, commissioned in 2019 at 80% with a flash flood noted on its page. A reader can see which stations are working and ask about the ones that are not.
NEA also publishes the total it bought from everyone else. In FY2082/83 it bought 10,825 GWh from independent power producers and 3,826 GWh from its own subsidiary companies such as Upper Tamakoshi, Chilime and Rasuwagadhi. And it publishes what it paid: Rs 67.7 billion to independent producers and Rs 17.9 billion to its subsidiaries. That works out at an average of Rs 6.25 a unit to IPPs, almost exactly the Rs 6.24 of the year before and Rs 4.67 a unit to subsidiaries.
NEA's report also lists every IPP project in operation with its capacity and the date it began commercial operation. Combining the two, we can work out how hard the IPP fleet as a whole runs.
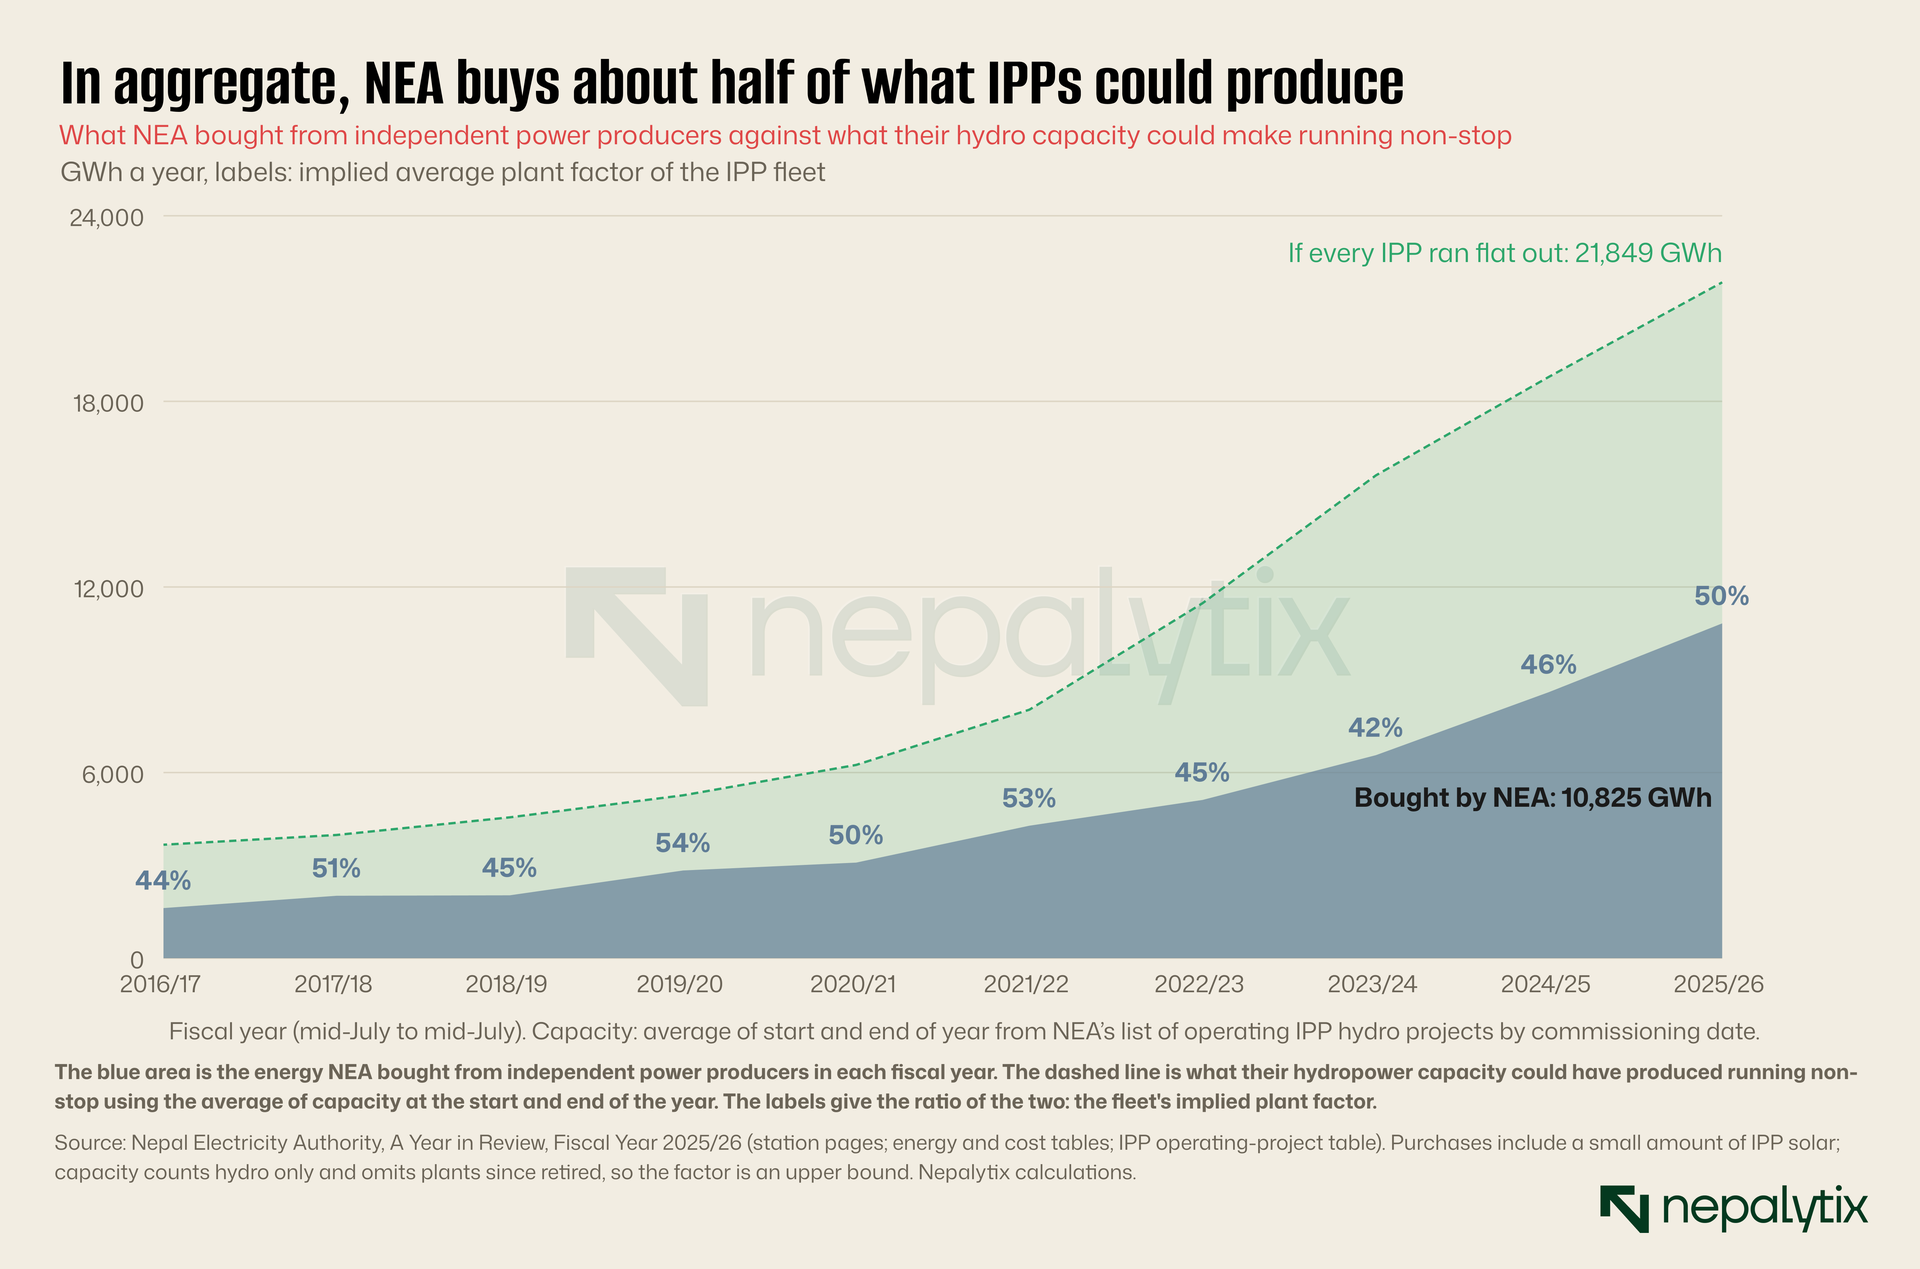
In FY2082/83 the IPP hydro fleet averaged about 2,494 MW of capacity in service. Run continuously for a year, that is 21,849 GWh. NEA bought 10,825 GWh so the fleet's plant factor was about 50%. Over the last ten years the figure has moved between 42% and 54%. That is consistent with what run-of-river plants in Nepal are typically designed for: heavy monsoon flows that exceed the turbines capacity followed by a long dry season when the river falls to a fraction of it. Because the energy figure includes a small amount of IPP solar and the capacity figure counts hydro only and leaves out plants since retired, this is an upper bound for hydro alone.
So the information exists at two levels. For NEA's own stations it is published plant by plant. For IPPs it is published only in aggregate and only once a year. The plant-by-plant numbers for IPPs including the listed ones sit in NEA's billing system and in each company's own records. Investors in those companies never see them.
3. What an investor is left to do
An investor who wants to know how hard a listed hydropower company's plant ran has one route. Take the company's annual revenue, divide by an assumed tariff to estimate the energy sold and divide that by the capacity times the 8,760 hours in a year. We did this for every listed hydropower company whose capacity we could match to NEA's project list and whose plants were all running before the start of FY2082/83. That left 88 companies with 1,834 MW and Rs 44.9 billion of revenue between them. The obvious tariff to use is NEA's average payment to IPPs, Rs 6.25 a unit.
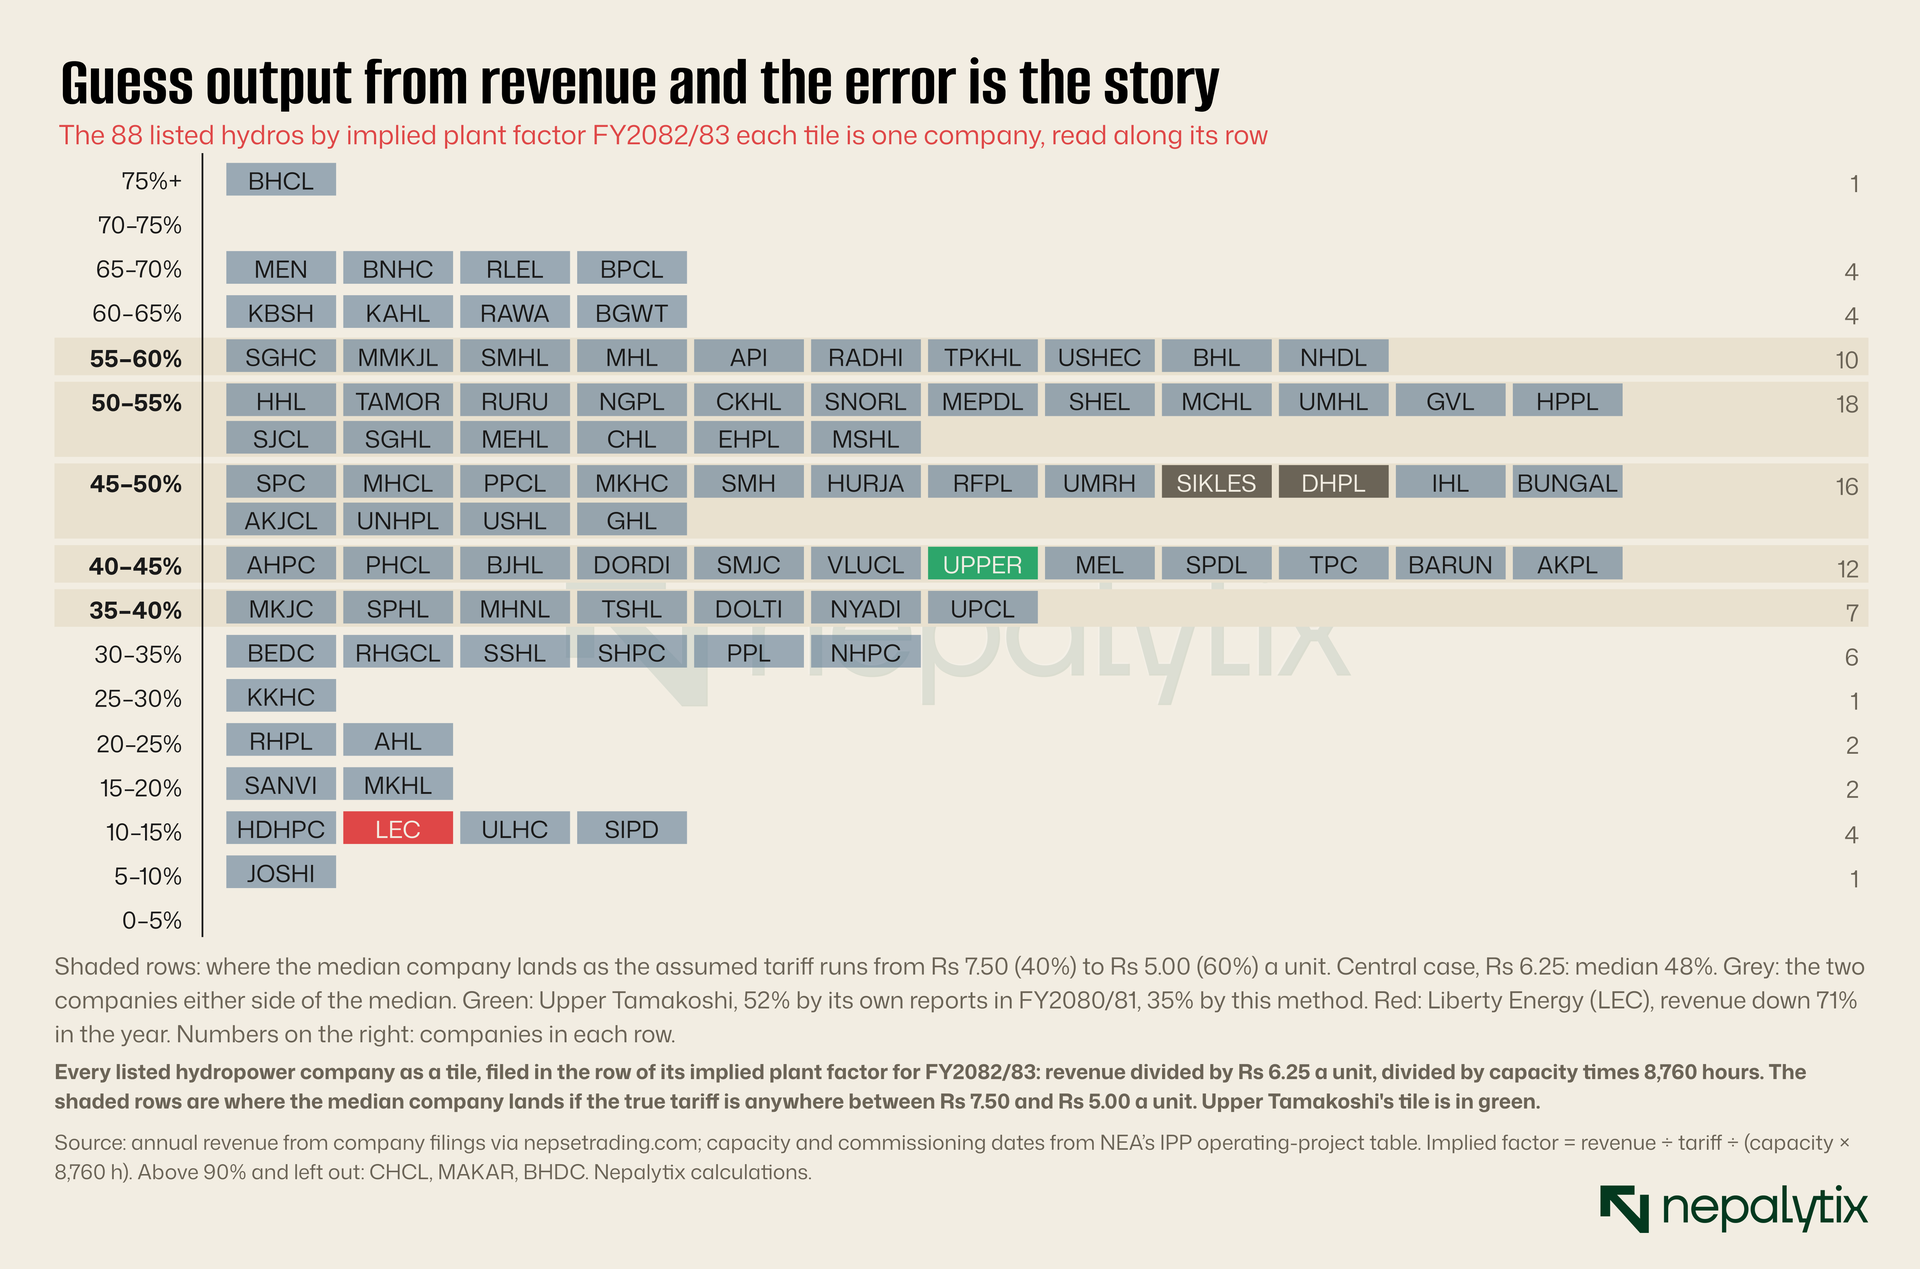
The median implied plant factor comes out at 48% close to the fleet figure from NEA's own totals with half the companies between 40% and 53%. At first sight that looks like a usable method. It is not, for three reasons.
The first is that the tariff is not one number. Every PPA in Nepal has its own rates set by the year it was signed. Most newer run-of-river agreements pay one rate in the wet season and a much higher one in the four dry months and escalate both for several years after commissioning. Older agreements pay less. A plant that produces most of its energy in the monsoon earns less per unit than one that holds up through the dry season. Across plausible tariffs from Rs 5.00 to Rs 7.50 a unit, the implied plant factor for the median company spans 20 percentage points. That is the width of the shaded band in Exhibit 3 which covers four of its rows. A company at 48% on the central assumption could be anywhere from about 40% to 60%.
The second is that we can test the method on the one company that publishes its energy. Upper Tamakoshi's directors report says it delivered 2,058 GWh in FY2080/81 on revenue of Rs 8,679 million. That is a plant factor of 52%. The same revenue divided by NEA's average IPP payment that year gives about 1,370 GWh and a plant factor of about 35%. The method misses by a third because Upper Tamakoshi's contract pays it about Rs 4.22 a unit, far below the IPP average. A company's tariff is in its PPA. Investors do not see the PPA either.
The third is that revenue mixes up things a shareholder needs to keep apart. Revenue falls if the river runs low, if a turbine fails, if a flood buries the intake or if NEA's Load Dispatch Centre tells the plant to cut output because the transmission line cannot take it. Those are four very different problems. The first is weather and averages out. The second is management. The third is an insurance question. The fourth is a contract question: under many PPAs NEA owes compensation when it cannot take power it has agreed to buy. Revenue alone cannot separate them.
Look at the bottom of Exhibit 3. Liberty Energy whose 25 MW Upper Dordi 'A' plant has been running since 2079 BS, reported revenue of Rs 597 million in FY2081/82 and Rs 175 million in FY2082/83, a fall of 71%. Its implied plant factor for the year is 13%. The Kathmandu Post reported in July that projects in the Marsyangdi corridor, Upper Dordi 'A' among them, had spent long periods in NEA's "contingency" category, under orders to cut output because the evacuation line was not ready. That is the likeliest explanation. But it is an inference from a newspaper report. The company's quarterly report does not say how much energy it was ordered not to generate, how much it generated or what compensation, if any it expects. Four other listed companies the Post named in the same corridor with the Dordi-1, Dordi Khola, Super Dordi and Nyadi plants have a median implied factor of 42% against 48% for everyone else. Whether that gap is the grid, the river, the plants or the tariffs, the published accounts do not tell you.
Look at the companies we left out, too. Three listed hydropower companies have revenue so high relative to their capacity in NEA's list that the implied plant factor exceeds 90%. That is not physically plausible for a run-of-river plant over a year. Either their revenue includes income from something other than their own plant or they own capacity that does not appear under their name in NEA's table or their tariff is far above the average. Any of those could be true. An investor reading their quarterly reports has no way to tell which.
4. A worked example
Take one company and read it the way an investor has to. Api Power owns three hydropower plants in Darchula according to NEA's list: Naugad Gad (8.5 MW), Upper Naugad Gad (8 MW) and Upper Chameliya (40 MW) which began commercial operation at the start of FY2080/81. It also has two 1 MW solar plants in Dhanusha and Bara. Its revenue over the last five fiscal years, from FY2078/79 to FY2082/83 was Rs 519 million, Rs 447 million, Rs 1,249 million, Rs 1,651 million and Rs 1,767 million. Its net profit went from Rs 141 million to Rs 7 million then Rs 457 million, Rs 428 million and Rs 961 million.
The jump in FY2080/81 is clearly Upper Chameliya coming on line. After that the story is harder to read. Revenue rose 32% in FY2081/82 and 7% in FY2082/83 while profit fell slightly and then more than doubled. Using NEA's average IPP tariff each year, the implied plant factor of the company's 56.5 MW of hydro went from about 40% in FY2080/81 to 53% and then 57%. That could mean the new plant took two years to reach its design output which is common. It could mean a first year lost to teething problems or to curtailment, a wet second year or a change in the dry-season share that lifted the average tariff. The doubling of profit in FY2082/83 on 7% more revenue could be lower interest, lower depreciation, a one-off gain or a tax effect. Each explanation implies a different value for the shares. The company knows which is true. Its quarterly reports, in the standard format, do not say.
None of this is a criticism of Api Power in particular. It is one of the better-performing companies in our sample. The point is that even for a company doing well, the published numbers cannot tell a shareholder how well or why.
5. Seasons and why quarterly numbers need a benchmark
One reason companies give for not publishing generation is that it swings with the seasons and the swings would mislead. NEA's own numbers show how large the swings are. Its stations generated 302 GWh in Asar at the peak of the monsoon and 137 GWh in Falgun, at the bottom of the dry season, less than half as much. Over the whole of FY2082/83 they produced 1,595 GWh in the wet months from Jestha to Kartik and 1,169 GWh in the dry months from Mangsir to Baisakh. For a run-of-river IPP without NEA's storage plants, the contrast is sharper still.
That is an argument for publishing generation with a benchmark not for withholding it. A second-quarter figure means little on its own. Set against the same quarter's contract energy and the plant's own record for that quarter in previous years, it means a great deal. The proposal below includes contract energy for exactly this reason. Investors in any seasonal business learn to compare like with like: this quarter against the same quarter last year and against what was planned. They can only do that if the quarterly number exists.
6. Two populations, one measured and one guessed
Put the two sets of numbers side by side and the problem becomes visible as a matter of method. NEA's run-of-river stations have published, metered plant factors. Listed companies have plant factors we have had to guess.
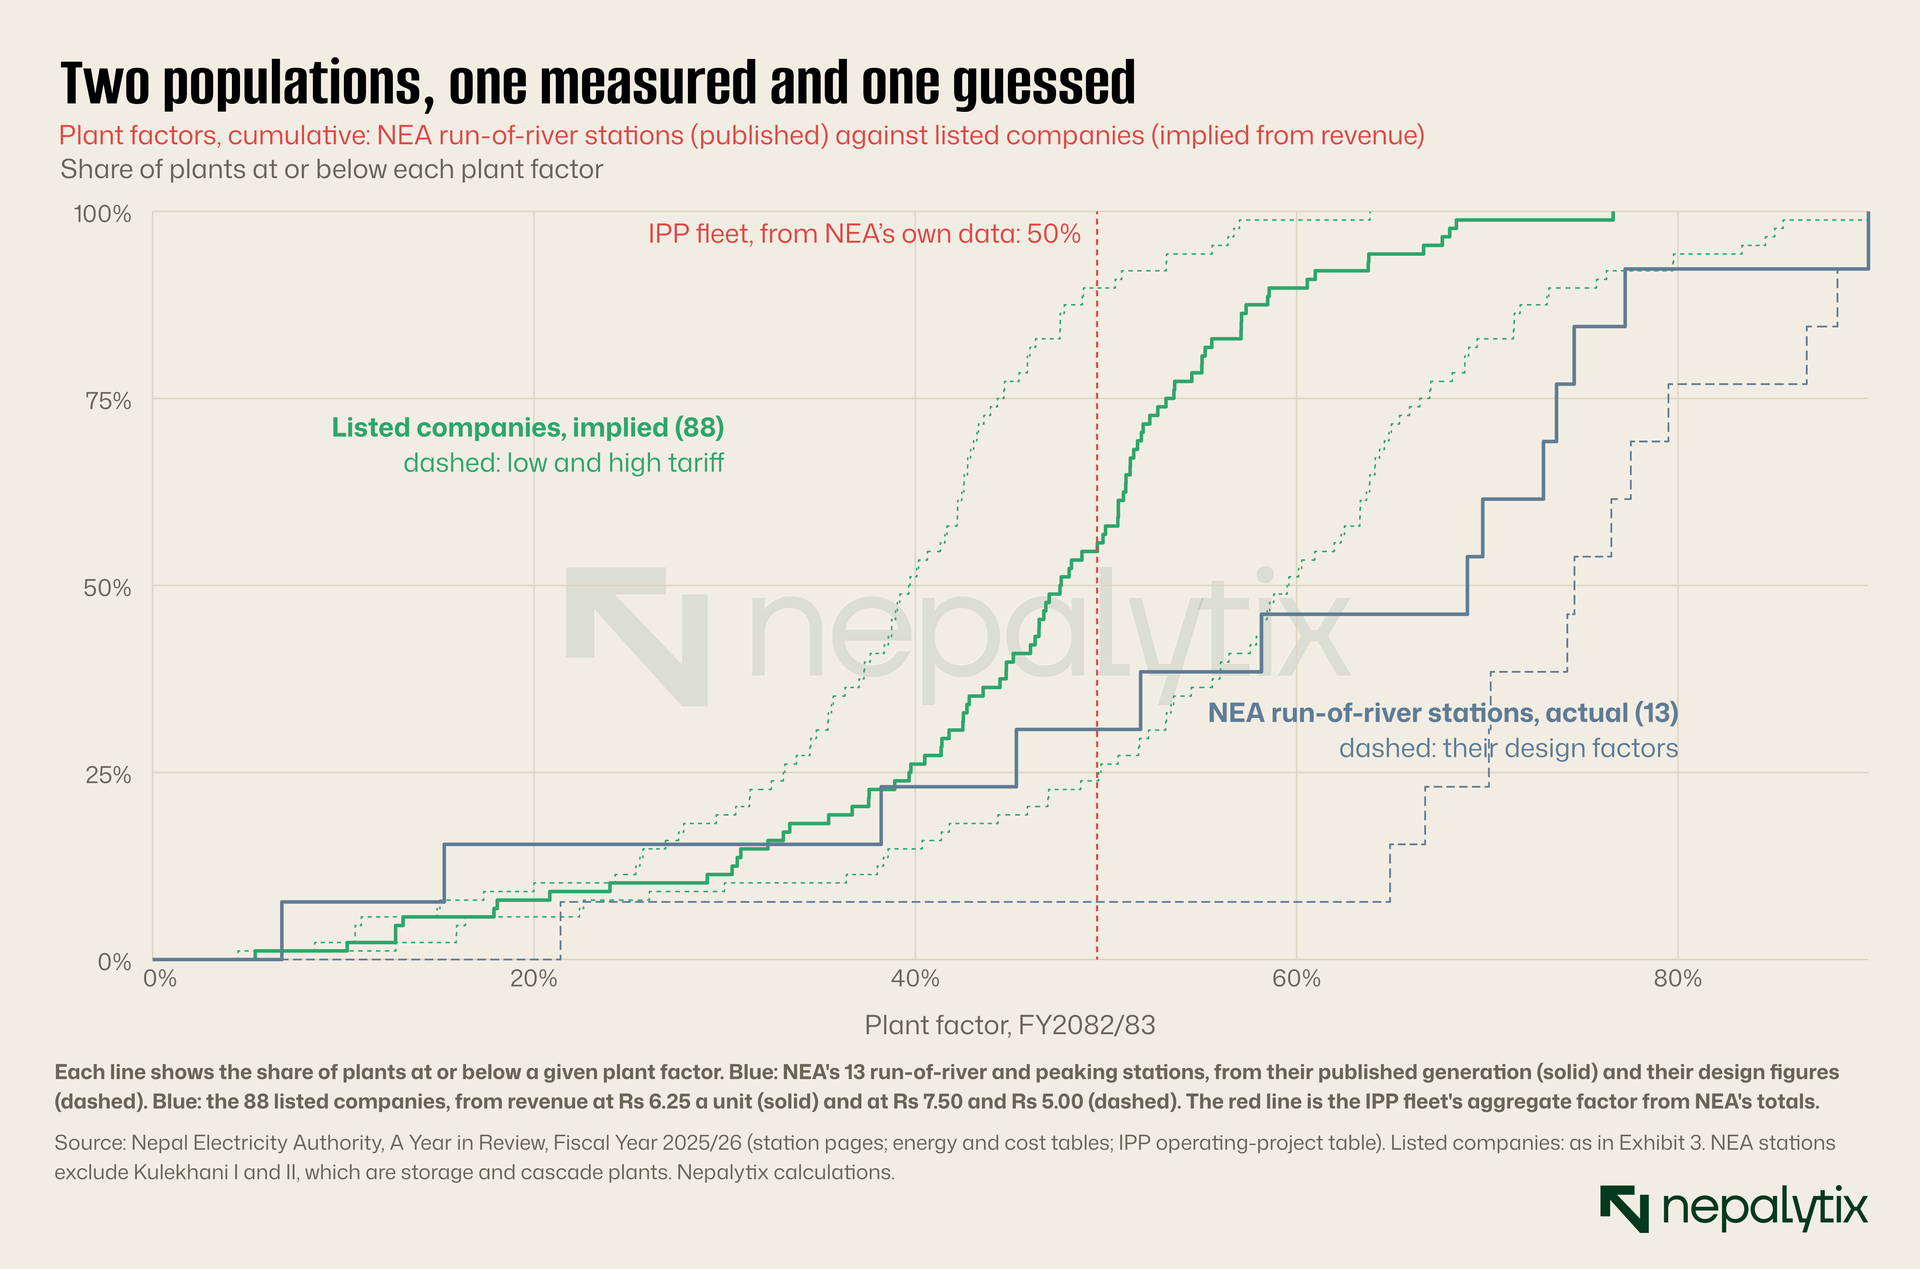
The blue curves are facts. They show most of NEA's run-of-river stations running between about 40% and 77% of their capacity and nine of the thirteen running below their own design factors. The green curves are a band of guesses and the band is wide. The central guess sits close to the fleet aggregate which is reassuring about the sector as a whole and useless about any single company. Somewhere inside that band are companies running well above their design and companies losing a third of their energy to the grid and the published accounts treat them identically.
This matters because the market prices hydropower companies one by one. A shareholder in a 10 MW plant is not buying the sector average. They are buying one river, one intake, one transmission line and one contract. The difference between a plant at 40% and one at 60% is half as much energy again, from the same capital and the same debt. That difference is the business.
7. Profit is not a substitute
An obvious objection is that investors do not need the energy figure because they have the profit figure and profit is what they are paid from. The trouble is that a hydropower company's profit depends on its output, its tariff, its construction cost, its interest rate and its leverage, roughly in that order of how little the investor knows about each. Two companies with identical output can report wildly different profits.
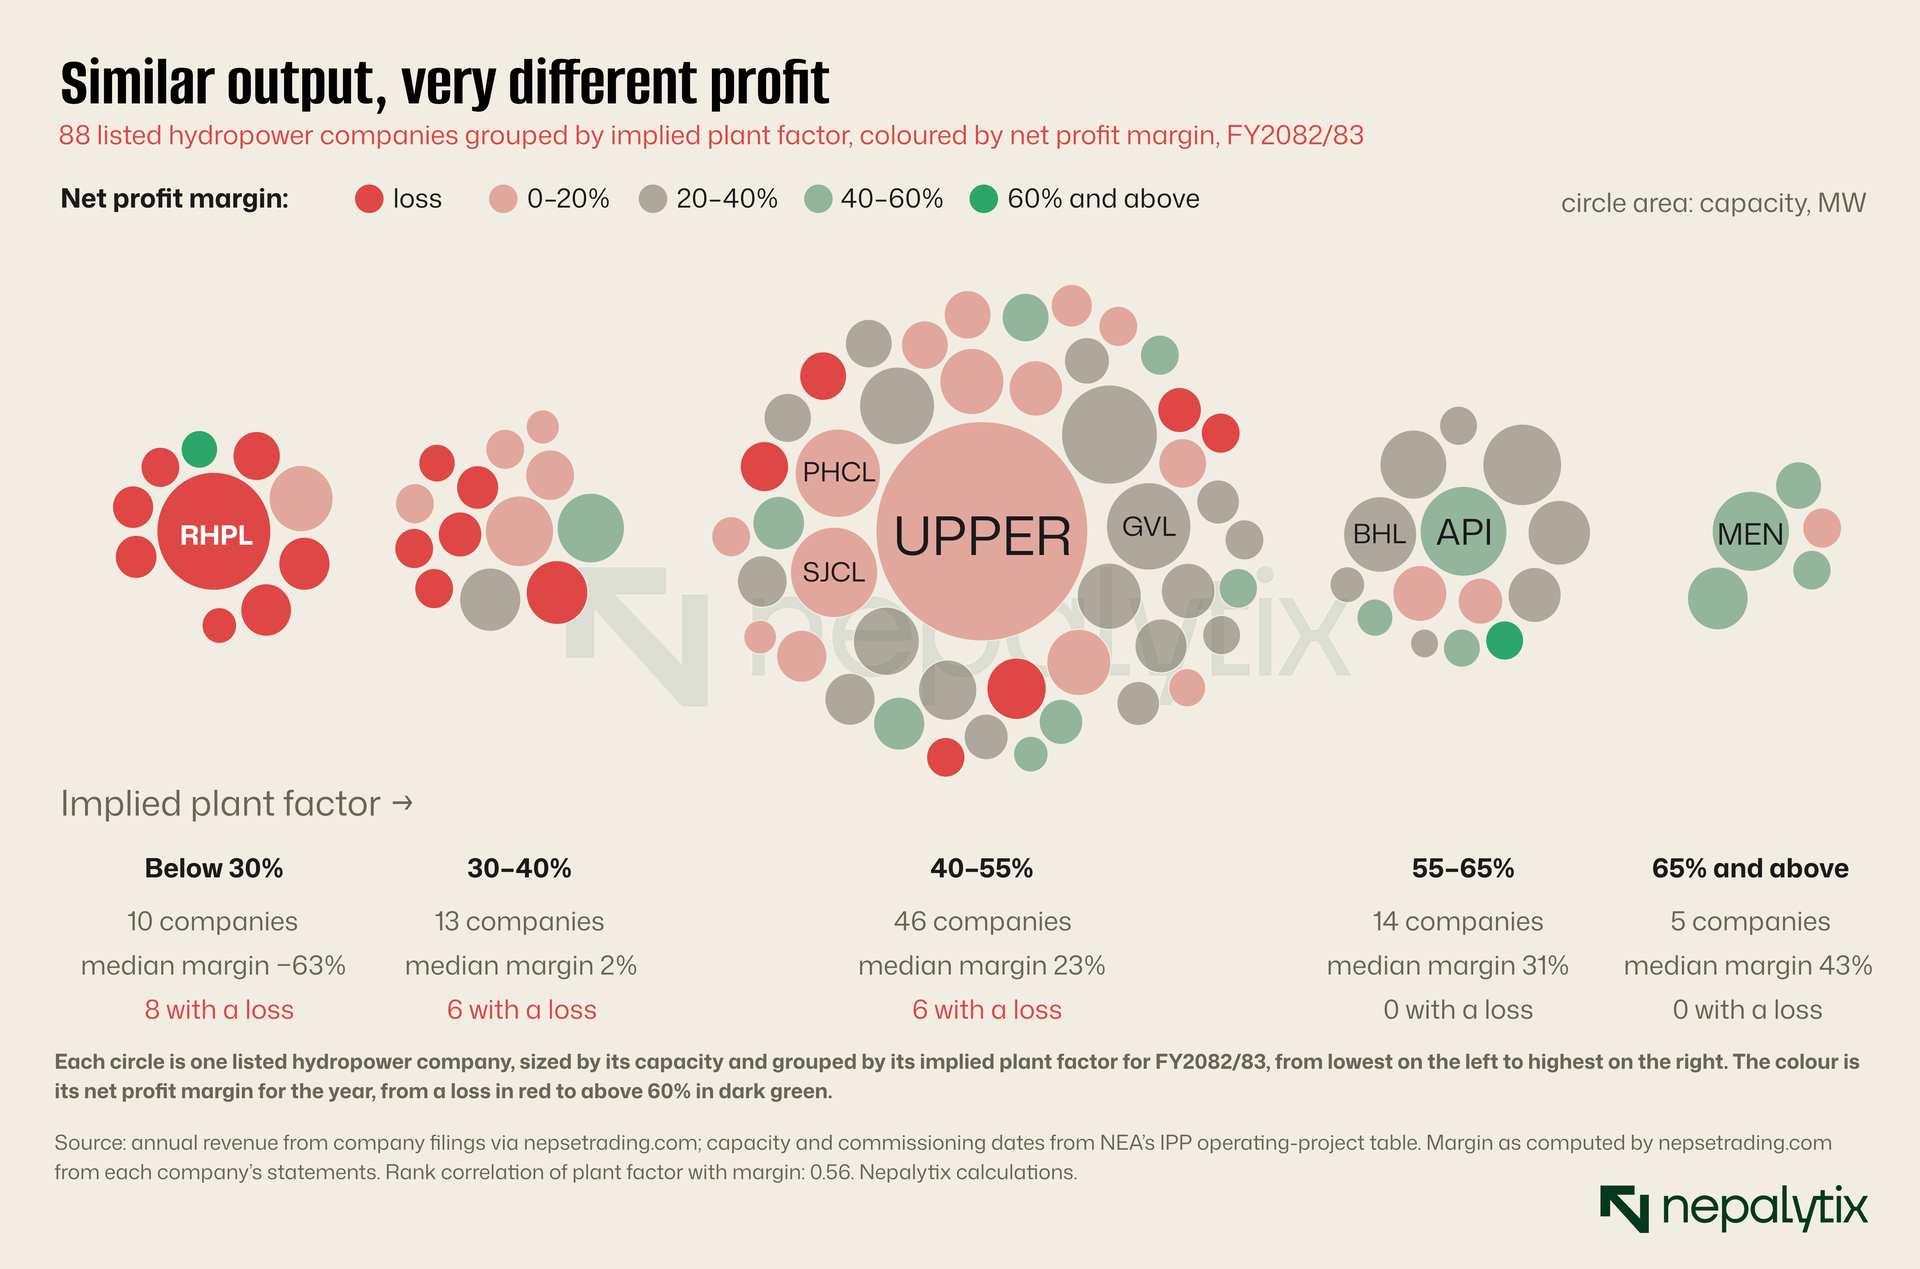
The extremes line up: the five companies with the highest implied output earn healthy margins and the five with the lowest make losses. In between, every colour turns up in every group. Among the 46 companies with implied plant factors between 40% and 55%, net profit margins in FY2082/83 range from a 17% loss to a 49% profit. Across all 88, the rank correlation between implied plant factor and net margin is 0.56. Output matters but it explains only part of the profit and profit tells you even less about output. Twenty of the 88 reported a net loss for the year. Twenty-five of the 81 with a revenue figure for both years reported lower revenue than the year before. For none of them can an outside reader say from the filings, whether the cause was water, the plant, the grid or the debt.
There is also the problem of timing. Profit arrives quarterly and cumulatively in statements published up to a month after the quarter ends and often restated later. Energy is metered continuously. A company that published monthly generation would tell its shareholders about a flood, a breakdown or a curtailment order within weeks. In August this year, when floods hit the Bhote Koshi and Rasuwa valleys, hydropower shares in the affected area fell 29% to 40% over the quarter. Investors trading those shares were trading on news reports and rumour about which plants were damaged and for how long because the companies own disclosures were weeks away and would, when they came, contain profit, not generation.
8. What other markets show
Nothing about this is exotic. India's state-owned NHPC, a listed hydropower generator, reports its generation in million units and its plant availability factor alongside its quarterly results. For the quarter to September 2022, for example, it reported 10,138 million units, its highest ever for a quarter and a plant availability factor of 99.87%. Listed power generators in many markets publish operating statistics because investors cannot value them without them and because the numbers are trivially available to the company.
Nepal already does the hard part. NEA publishes plant-level data for its own fleet and aggregate purchase data for everyone else. The Independent Power Producers Association compiles installed capacity and project counts for the private sector. The listed company that sells to NEA receives a monthly statement of the energy it delivered because that is what NEA pays it for. What is missing is only the last step: putting the number in front of the people who own the company.
9. What the disclosure should contain
The proposal is narrow. It does not ask companies to forecast anything to publish hydrology models or to reveal commercial terms beyond what is already implicit in their accounts. It asks for seven numbers a quarter, each of which the company already has.
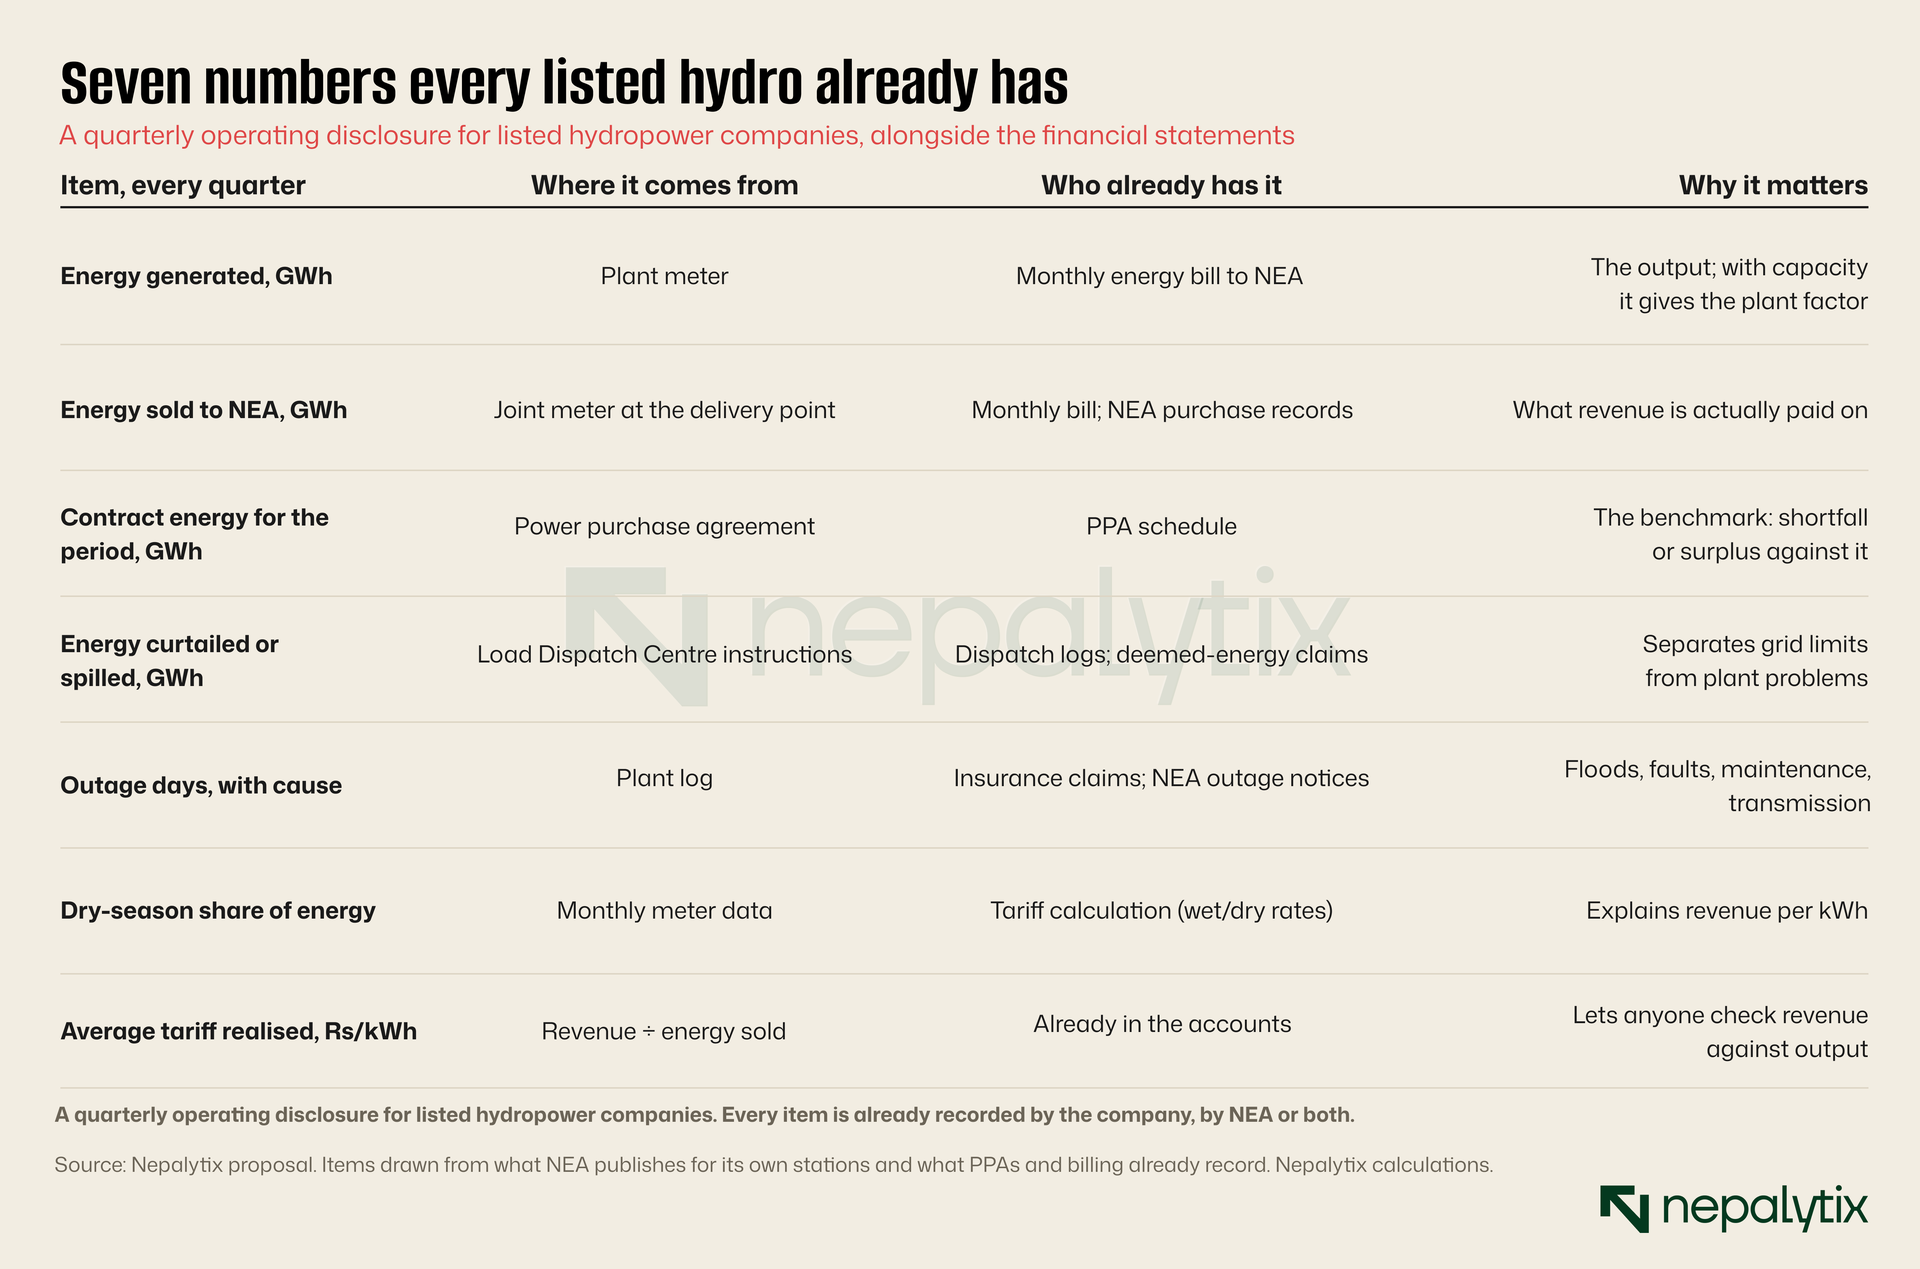
Energy generated and energy sold are the core. Together with installed capacity which every company already states, they give the plant factor. Contract energy for the period, from the PPA gives the benchmark the company itself agreed to. Curtailed energy separates the grid's problems from the plant's. Outage days with their causes separate floods from faults from maintenance. The dry-season share explains why revenue per unit moves. And the average tariff realised which is simply revenue divided by energy sold, lets anyone check the accounts against the output.
The format should be a fixed table in the quarterly report, filed in the same place and in the same units by every company so that investors and analysts can compare across companies without reading 111 narratives. Monthly figures would be better still and Upper Tamakoshi shows they are easy to produce. A quarterly table is the minimum.
SEBON is the natural body to require it, as the regulator that sets what listed companies must disclose. NEPSE could require it as a listing condition for the hydropower sector. NEA could publish plant-level purchase data for IPPs, as it already does for its own stations which would achieve much of the same end from the other side. Any of the three would be a large improvement on the current position.
The best case against
The data are commercially sensitive. A plant's generation reveals its hydrology and its reliability to competitors and to lenders bargaining over refinancing. Generation though is not like a bank's loan book or a manufacturer's margins. Every plant sells to the same buyer at a regulated price. There is no customer to lose by publishing output. Lenders already see it. The only people who do not are the shareholders.
Generation is weather. Quarterly output swings with rainfall so publishing it will make share prices more volatile and retail investors will sell on a bad dry season that means nothing for the long run. Prices already swing on rumours about water levels, floods and curtailment; actual numbers would replace rumour with fact. A company can publish its design energy and its long-run average alongside each quarter so a dry quarter is seen for what it is.
NEA and the regulators already have it. If the electricity regulator and NEA have plant-level data, the public interest is served. But regulators do not trade shares and the people who carry the risk of the plant's performance are its shareholders. Information the regulator holds and the owner does not is the definition of the gap disclosure rules exist to close.
Small companies cannot afford more reporting. Forty-six of the 88 companies in our sample have less than 10 MW of capacity, and compliance costs fall hardest on them. The seven numbers in the proposed table come from a meter, a monthly bill and a plant log. A company that cannot produce them each quarter has a bigger problem than its reporting budget.
Curtailment is NEA's data, and companies may not be able to verify it. Some of the most important numbers, such as energy curtailed under contingency orders, depend on NEA's dispatch records and companies dispute them. That is a reason to publish both sides numbers, not neither. A company in a dispute with NEA over curtailed energy is a company whose shareholders should know about the dispute.
10. Why now
The case would hold in any year. Three things make it more pressing now.
The first is scale. The IPP fleet's capacity has grown from about 420 MW in FY2016/17 to about 2,700 MW at the end of FY2082/83 and the energy NEA buys from it has risen 6.7 times from 1,623 GWh to 10,825 GWh. More of Nepal's listed market value now depends on plants whose performance nobody outside can see. Hydropower stocks are about 15% of the market by value and among its most actively traded.
The second is the grid. NEA told the Kathmandu Post in July that monsoon generation can reach about 4,100 MW against domestic use and exports of about 3,200 MW, and that floods and landslides can shut 300 to 400 MW at a time. The Independent Power Producers Association says 30 to 32 projects have been in contingency status, made to cut output because lines are not ready. In 2023 it claimed 500 MW from 30 projects was being wasted. As more plants come into operation ahead of the transmission lines, curtailment will grow. It is the single most important operating variable for a growing number of listed companies and it appears nowhere in their reports.
The third is the unlock calendar. As our Long Read on promoter shares showed last week, dozens of hydropower companies have promoter stakes coming out of lock-in over the next three years and the share price usually falls before the date. Promoters selling into a public market have every reason to know more about their plant's performance than the buyers do. Mandatory operating disclosure is the cheapest protection against that gap.
There is a fourth reason which is the market itself. In the first quarter of this fiscal year, as Monday's Signal showed, the median hydropower company's shares fell 0.7% while the sector's range ran from a 41% gain to a 40% loss. Moves that large, in a sector whose operating results are invisible, are moves made on rumour, tips and the price itself. Some of the biggest gainers may be running brilliantly and some of the biggest losers may have been unlucky with a flood. Without the generation figures, nobody outside the companies can tell and the market cannot do its job of moving money from the plants that work badly to the ones that work well.
What would change
Imagine the quarterly report of a 25 MW run-of-river company under the proposal. Alongside the income statement there is a seven-line table. It says the plant generated 32 GWh in the quarter against a contract energy of 41 GWh. It says NEA curtailed 6 GWh under contingency orders and that the company has claimed compensation. It says the plant lost nine days in August to a flood at the intake and that the dry-season share of energy was 18%. Its average realised tariff was Rs 5.90.
From that table an investor can see that the plant itself is roughly fine. The shortfall against contract is mostly the grid and the flood. The compensation claim is worth following. Revenue will recover when the line is commissioned. None of that can be learnt from the current filing which would show only that revenue and profit fell and leave the investor to guess why or to rely on whoever claims to know.
That is the whole argument. Nepal's largest group of listed companies sells a single, metered product to a single buyer at a contracted price. The quantity of that product is the most important fact about each of them. It is already measured, already recorded and already shared with the buyer. It should be shared with the owners.
The proposition, again
Every listed hydropower company should publish, each quarter and in a standard table, its energy generated and sold, its contract energy, the energy curtailed by the grid, its outage days and causes, its dry-season share and its average realised tariff. SEBON should require it. Until it does, investors in Nepal's largest listed sector are pricing plants they cannot see.
Disclaimer
This report has been prepared by Nepalytix for informational and educational purposes only and does not constitute investment advice, an offer, or a solicitation to buy or sell any securities.
The information contained in this report is based on sources believed to be reliable; however, Nepalytix does not guarantee its accuracy, completeness, or timeliness. Opinions, estimates, and projections expressed herein are those of the authors as of the date of publication and are subject to change without notice.
Investing in securities involves risks, including the possible loss of principal. Past performance is not indicative of future results. Readers are advised to conduct their own independent research and consult with a qualified financial advisor before making any investment decisions.
Nepalytix and its contributors may hold positions in the securities discussed in this report at the time of publication or thereafter.
Neither Nepalytix nor any of its affiliates accept any liability for any loss arising from the use of this report or its contents.