Nepal’s Economy: Inflation Rises as Billions Sit Idle
Nepal’s economy faces a growing disconnect: rising inflation, weak credit demand and a massive reconstruction bill, while public spending remains sluggish. Why is money abundant but economic activity still struggling?
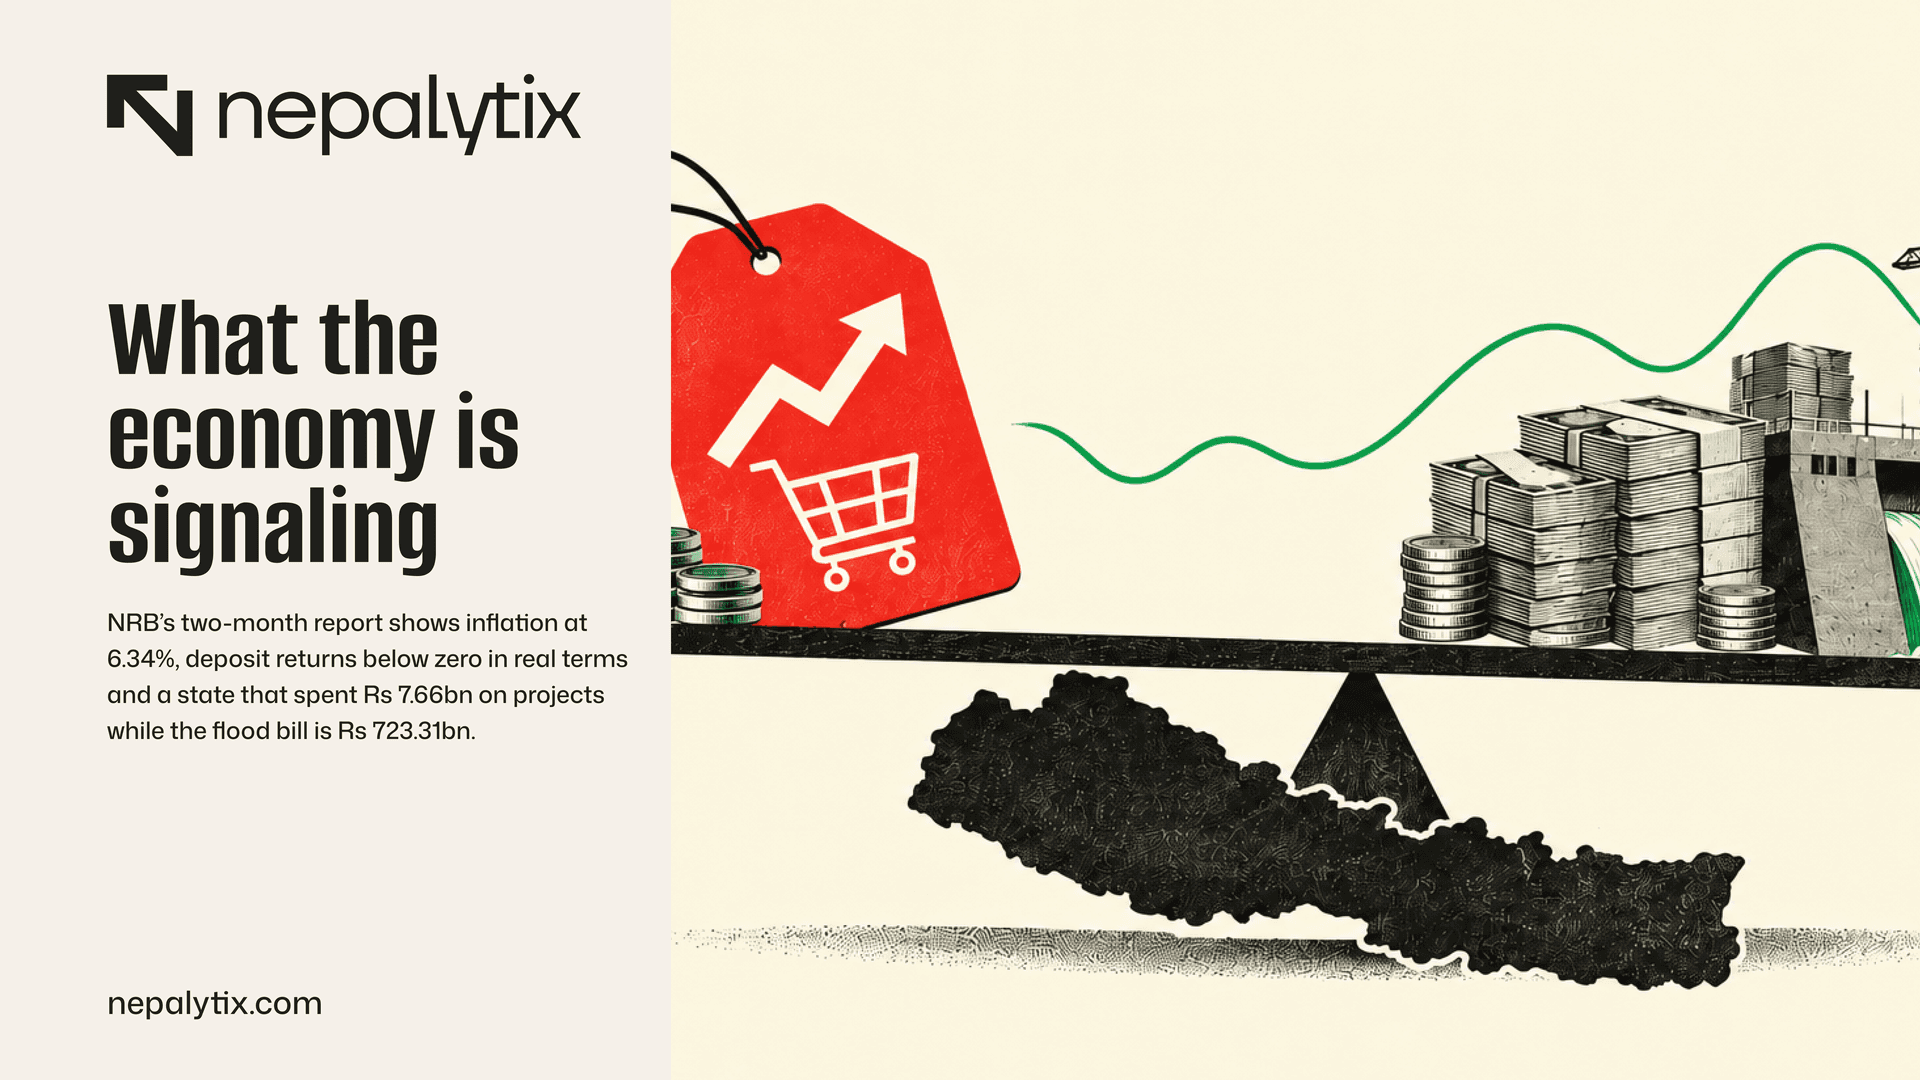
NRB’s two-month report shows inflation at 6.34%, deposit returns below zero in real terms and a state that spent Rs 7.66bn on projects while the flood bill is Rs 723.31bn.
THE SIGNAL
NRB’s two-month report, published on 15 October, answers the five questions we left open on 5 October and the answers point the same way. Inflation reached 6.34% in mid-September, a second month above the 5.5% target. Private credit grew 7.3% against an 11% target. The interbank rate stayed on its 2.75% floor and NRB now has Rs 1,365bn parked at its own windows.
Money is abundant. Supply is not. Oil is up 83% in dollars and the rupee is about 9% weaker. A flood on 26 August badly damaged the Rasuwagadhi trade crossing and hydropower plants. And the state spent Rs 7.66bn on capital projects in two months against a recovery bill the government puts at Rs 723.31bn.
01. The number
NRB’s report puts year-on-year consumer price inflation at 6.34% in mid-September up from 5.96% a month earlier and 1.87% a year ago. Food and beverages are at 7.54% and non-food and services at 5.69%. The 5.5% NRB set in July is a target for the year’s average, so it is not yet a miss. But it is the second month above it, and above the 6% the budget assumes. The cushion is gone.
Within food, ghee and oil are up 16.68%, fruit 15.99%, sugar 12.14%, meat and fish 7.34% and vegetables 7.07%. Transport is up 12.77%, alcoholic drinks 8.83% and clothes and footwear 7.06%. Madhesh is the highest province at 7.48% and Sudurpashchim the lowest at 5.16%. The Terai is at 6.89% against 5.28% in the Kathmandu Valley.
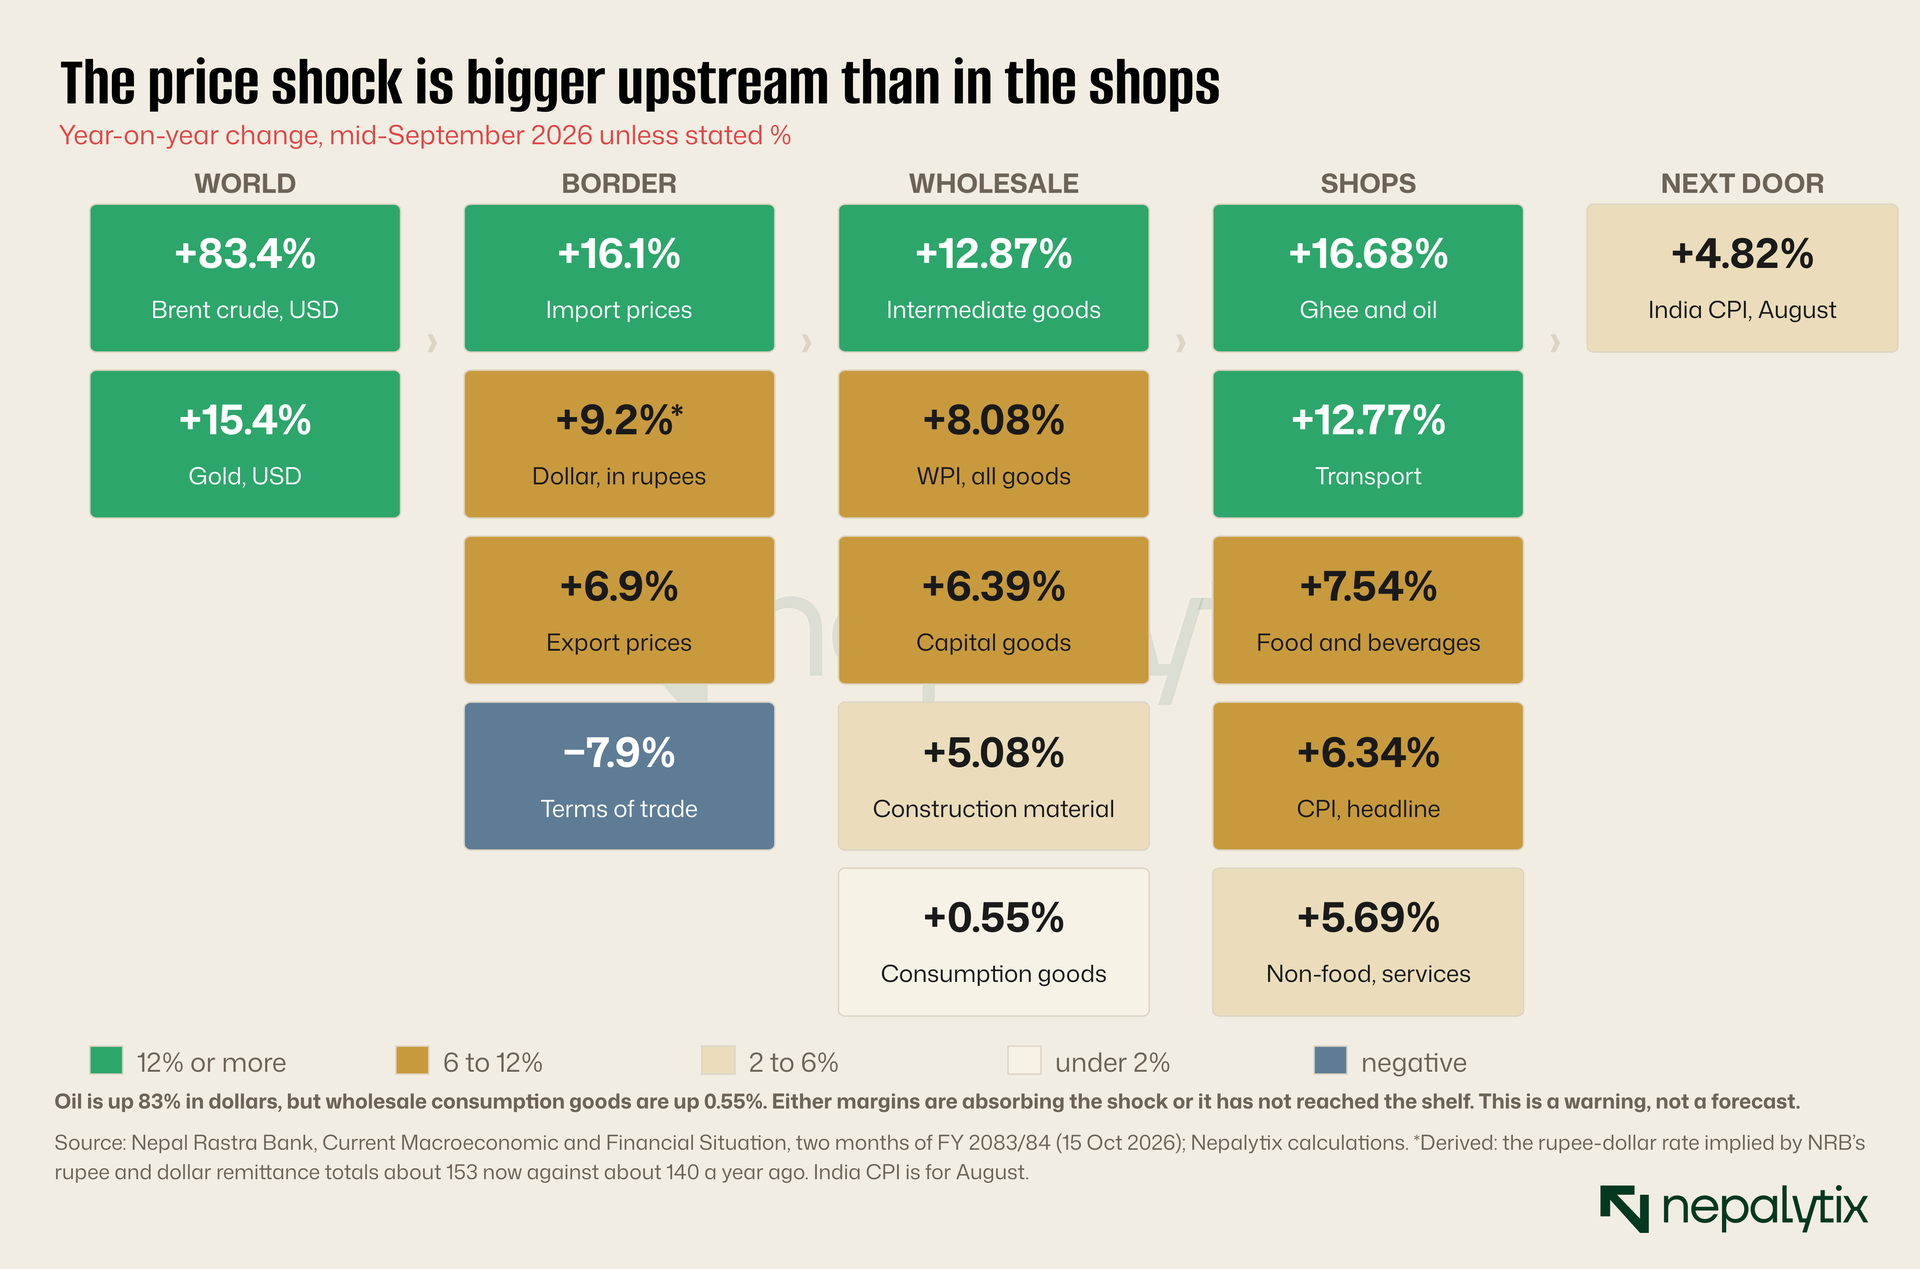
Chart lines the shock up by stage. Brent crude was $127.84 a barrel in mid-September, 83.4% above a year ago. The rupee has slipped too: NRB’s rupee and dollar remittance totals imply about 153 to the dollar now against about 140 a year ago, so by our estimate oil costs roughly twice as much in rupees. Import prices are up 16.1% against export prices up 6.9%, a 7.9% fall in the terms of trade.
The surprise is at the wholesale end. Intermediate goods are up 12.87% and construction material 5.08%, but consumption goods are up only 0.55%. Either margins are absorbing the squeeze or it has not reached the shelf yet. Our 5 October analysis found no reliable lead of wholesale over retail inflation, so we read the gap as a warning, not a forecast. India’s inflation was 4.82% in August, 1.52 points below Nepal’s.
02. What we said to watch
On 5 October we listed five readings to watch in this report. Here is how they came out.
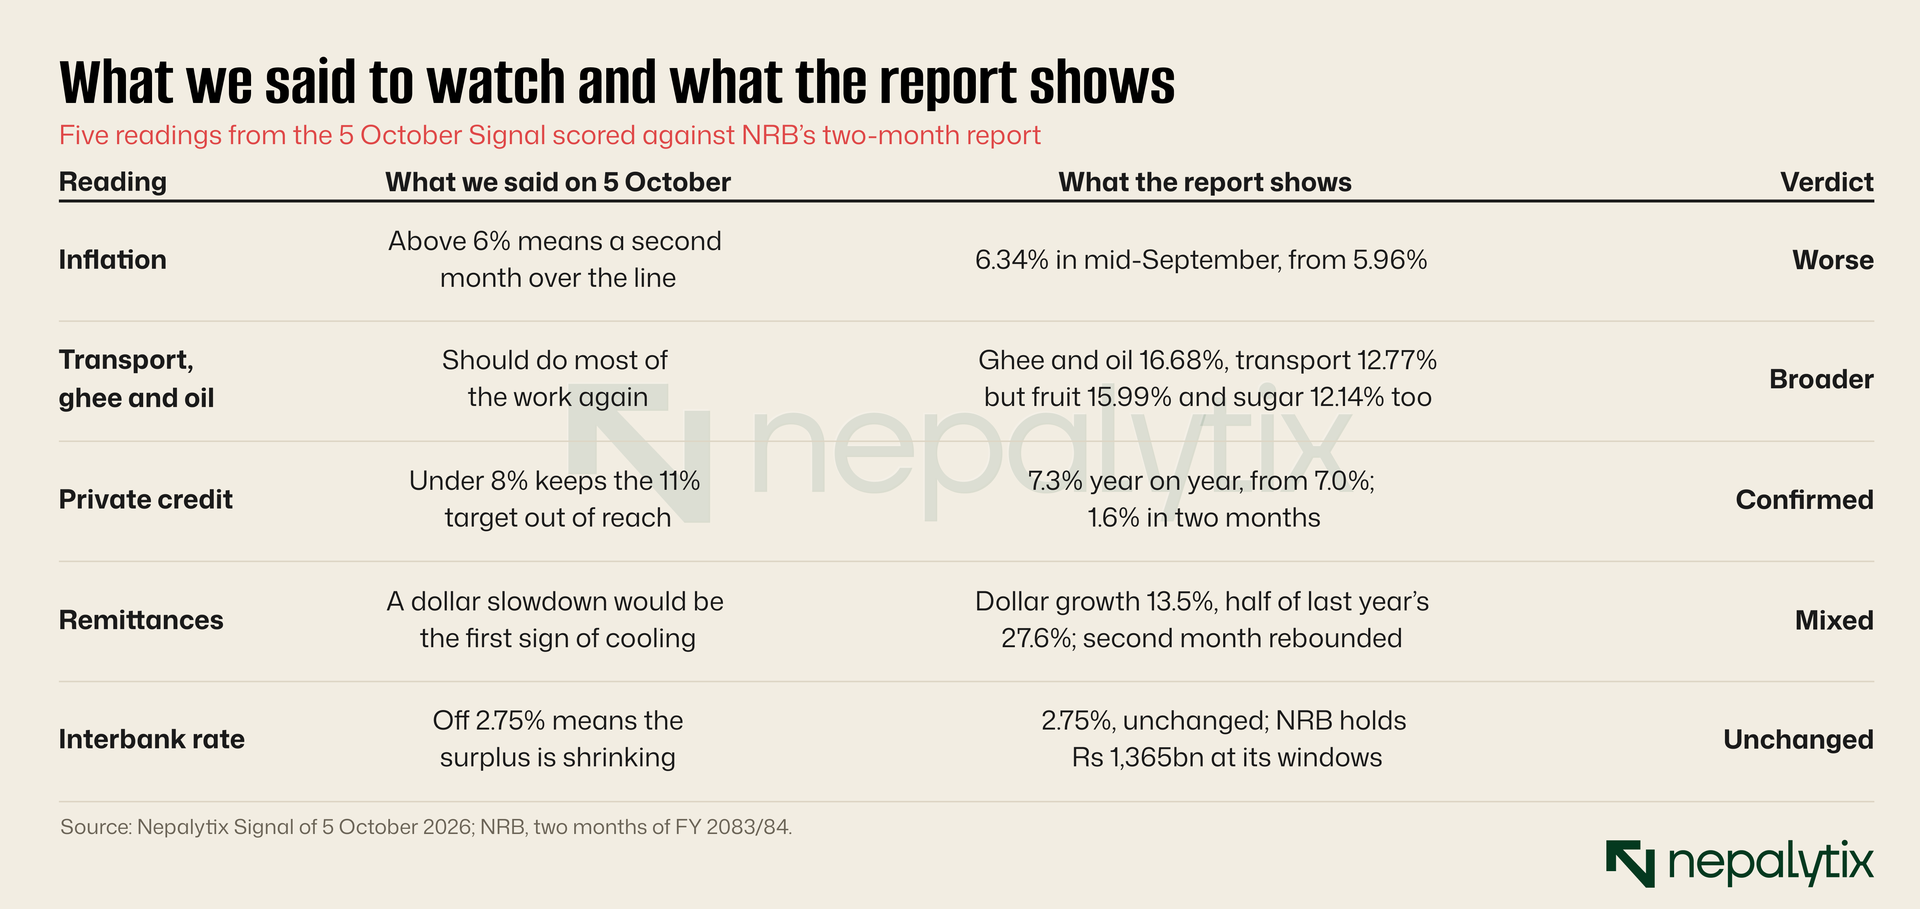
Two of the five did not go the easy way. The pressure is broader than fuel and edible oil: food inflation rose faster than non-food, from 6.77% to 7.54% against 5.52% to 5.69%. And remittances were stronger in the second month than the first which section 07 covers.
03. The saver’s arithmetic
Start with what a saver earns. Commercial banks pay a weighted 3.11% on deposits against 6.34% inflation, a real return of −3.23 points. A year ago it was 3.96% against 1.87%, a real return of +2.09 points. In twelve months the real return on a deposit fell by 5.3 points.
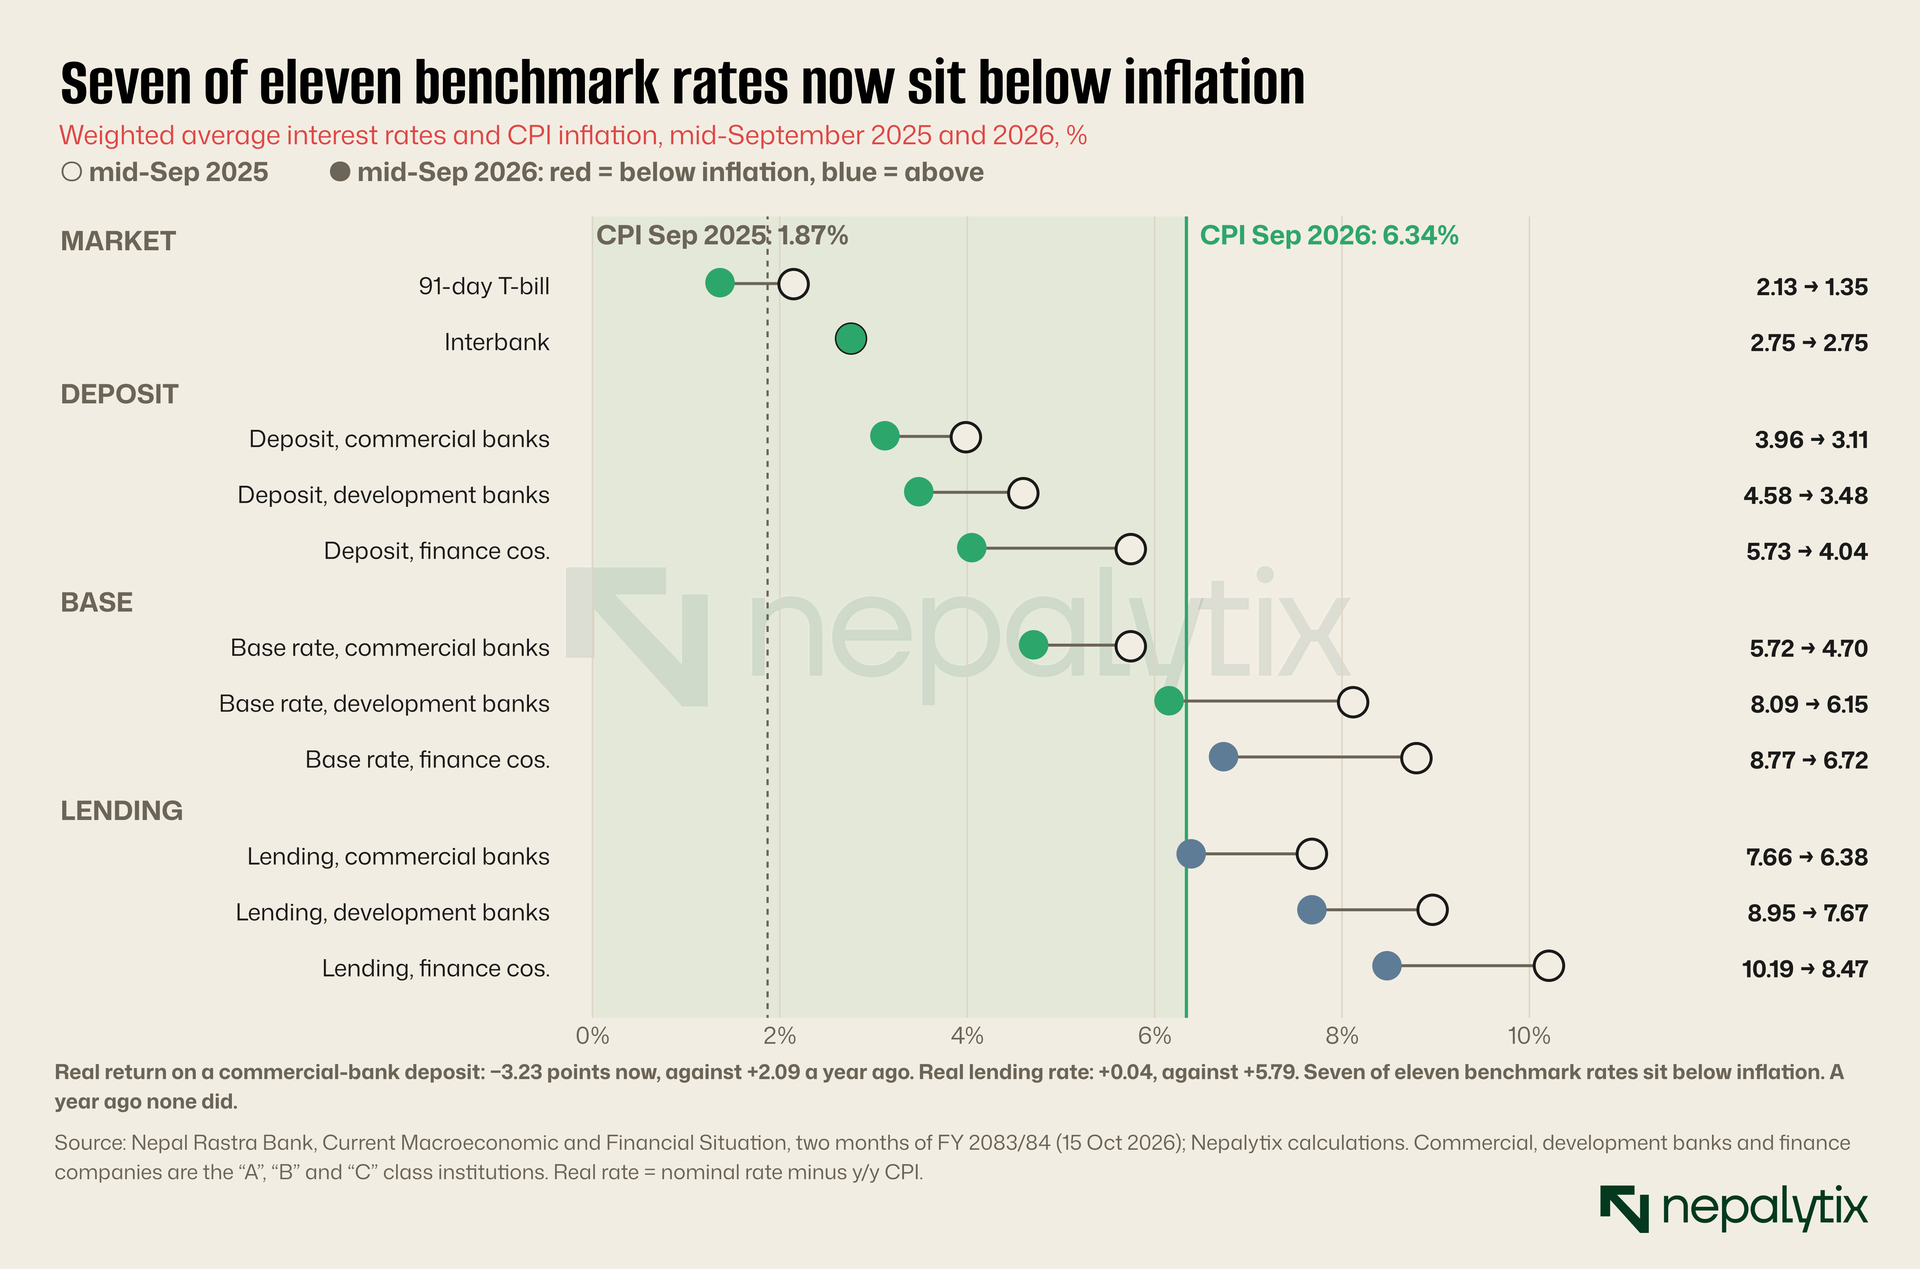
The 91-day T-bill pays 1.35% (2.13% a year ago), the interbank rate is unchanged at 2.75% and all three deposit rates and the base rates of commercial and development banks sit below inflation. Lending rates fell too. Commercial banks lend at a weighted 6.38%, against 7.66% which makes the real lending rate +0.04 points against +5.79. Borrowers get money at roughly zero real cost and the credit is still not taken up. That is the argument of our 5 October piece, and the second month strengthens it.
For banks the squeeze is in the spread. Commercial banks deposit rate fell 0.85 points and their lending rate 1.28 points so the spread narrowed from 3.70 to 3.27 points. Banks and insurers make up 51.4% of NEPSE’s market value.
04. Where the savers went
A saver who cannot beat inflation keeps the money where it can move. Fixed deposits were 47.9% of total deposits in mid-September 2025 and are 34.7% now. Saving deposits rose from 38.0% to 48.0% and demand deposits from 5.8% to 7.5%. Most of the shift came between September 2025 and July 2026, the stretch in which deposit rates fell. Since July the change has been about a point.
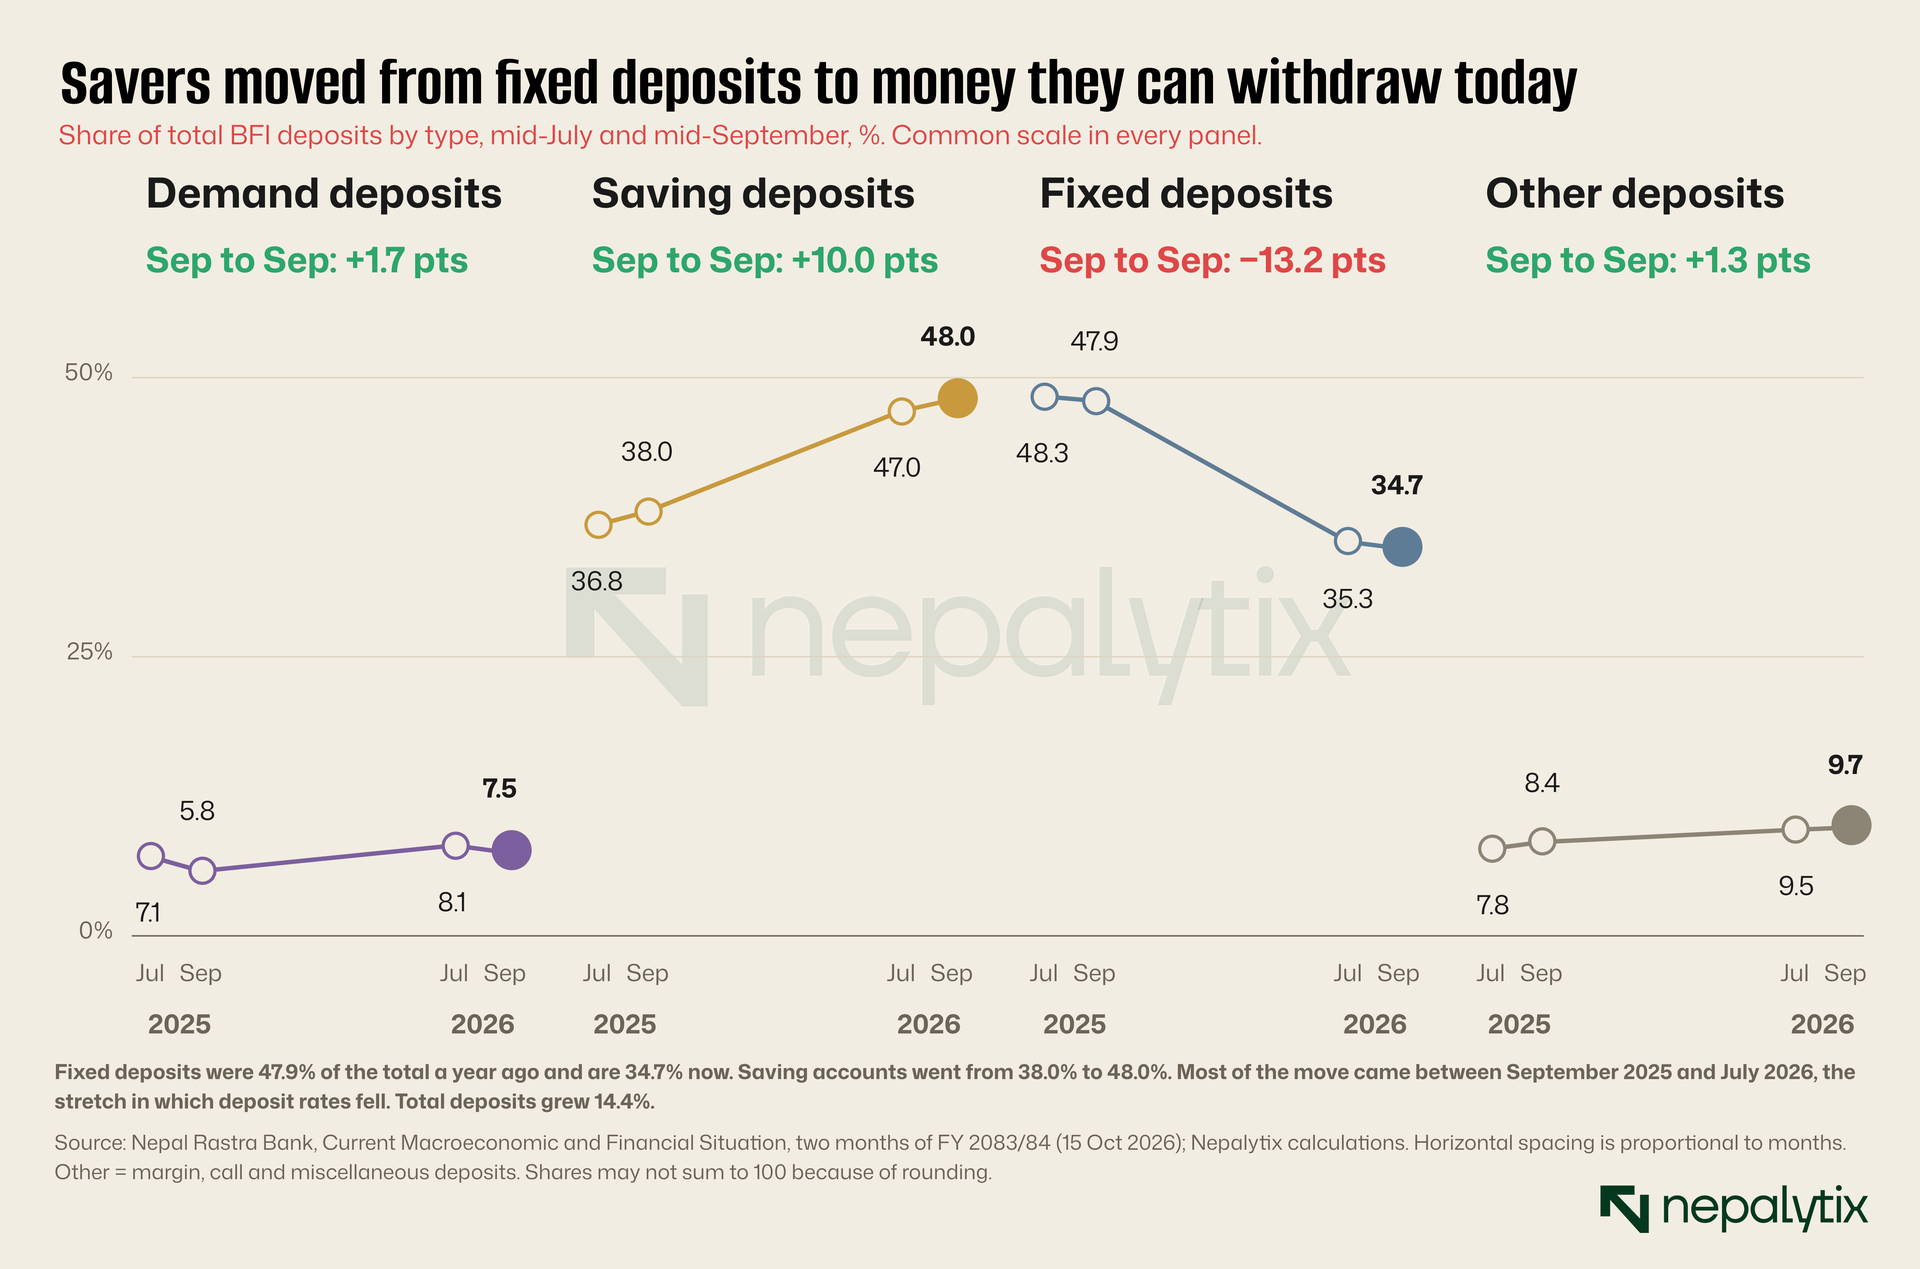
Total deposits grew 14.4% over the year, to Rs 8,349.72bn. This reads as liquidity preference, not a rush into risk. NRB puts NEPSE at 2,612.43 in mid-September, 2.2% below a year earlier and market capitalisation at 68.13% of GDP against 72.05%. Our Q1 review covers what the index did over the quarter.
05. Where the credit goes
Private-sector credit from BFIs rose Rs 93.52bn or 1.6% in the two months to Rs 5,950.58bn. Over the year it is up 7.3% against NRB’s 11% target. Commercial banks grew 1.7%, finance companies 1.4% and development banks 0.6%.
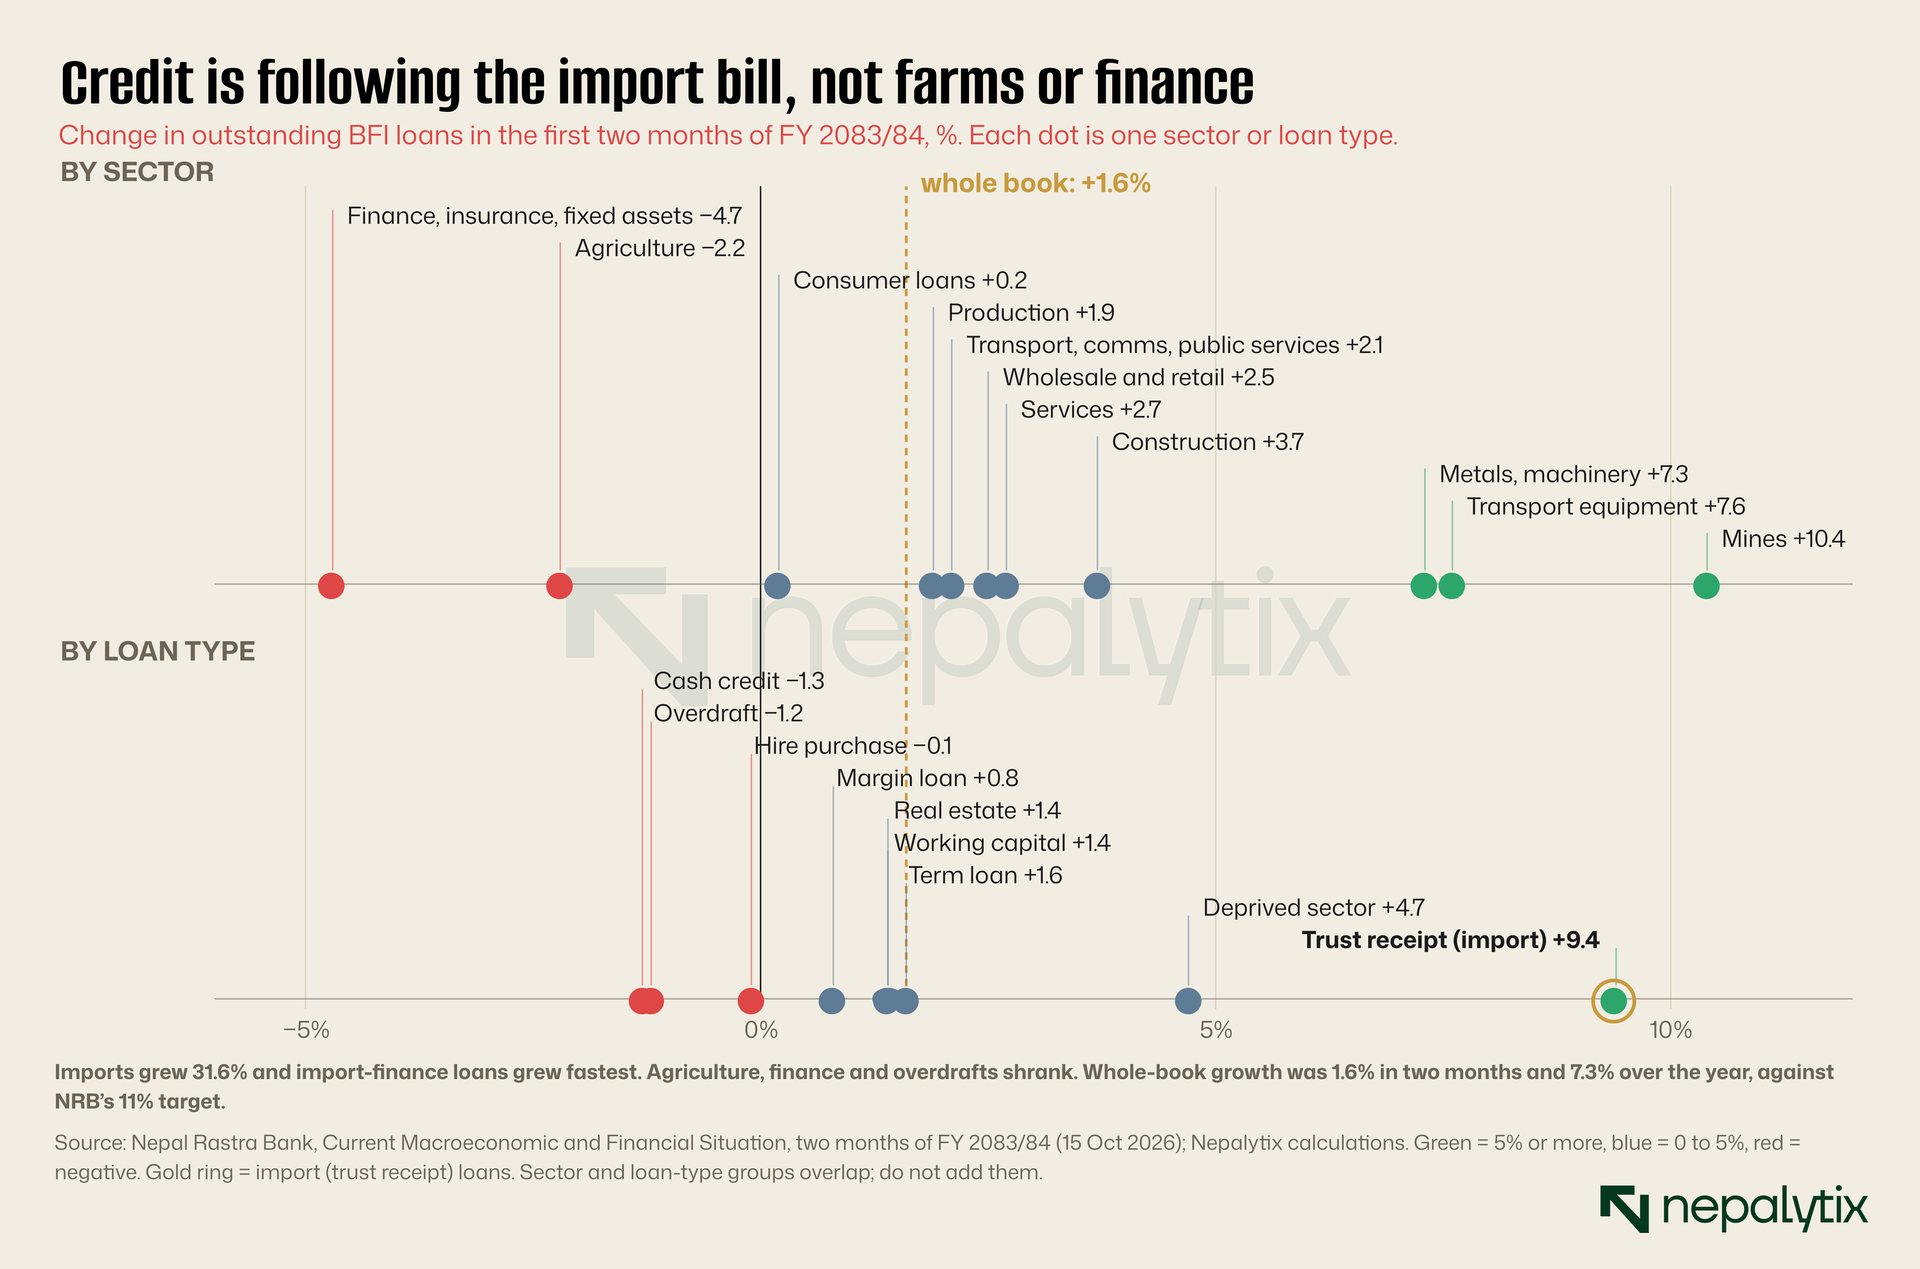
The mix shows what the credit is for. Trust receipt loans which finance imports grew 9.4%, the fastest of any loan type while merchandise imports grew 31.6%. Mines grew 10.4%, transport equipment 7.6% and metals and machinery 7.3%. Agriculture shrank 2.2% and finance, insurance and fixed assets 4.7%. Cash credit and overdrafts fell. Land and buildings back 62.8% of the loan book down from 64.3% a year ago.
Access is the other limit. There are 64.0 million deposit accounts and 2.05 million loan accounts, one loan for every 31 deposits. The number of BFI branches fell from 11,332 in July to 11,289.
06. The idle money
Deposits grew 14.4% and credit 7.3% so money piles up. BFI deposits stand at Rs 8,349.72bn against private credit of Rs 5,950.58bn, a gap of Rs 2,399bn. NRB has Rs 1,365.10bn parked at its own windows: Rs 900.60bn in deposit-collection auctions, Rs 400.00bn in NRB bonds and Rs 64.50bn in the standing deposit facility. That is about 57% of the gap. Treat it as indicative because deposits fund more than private credit.
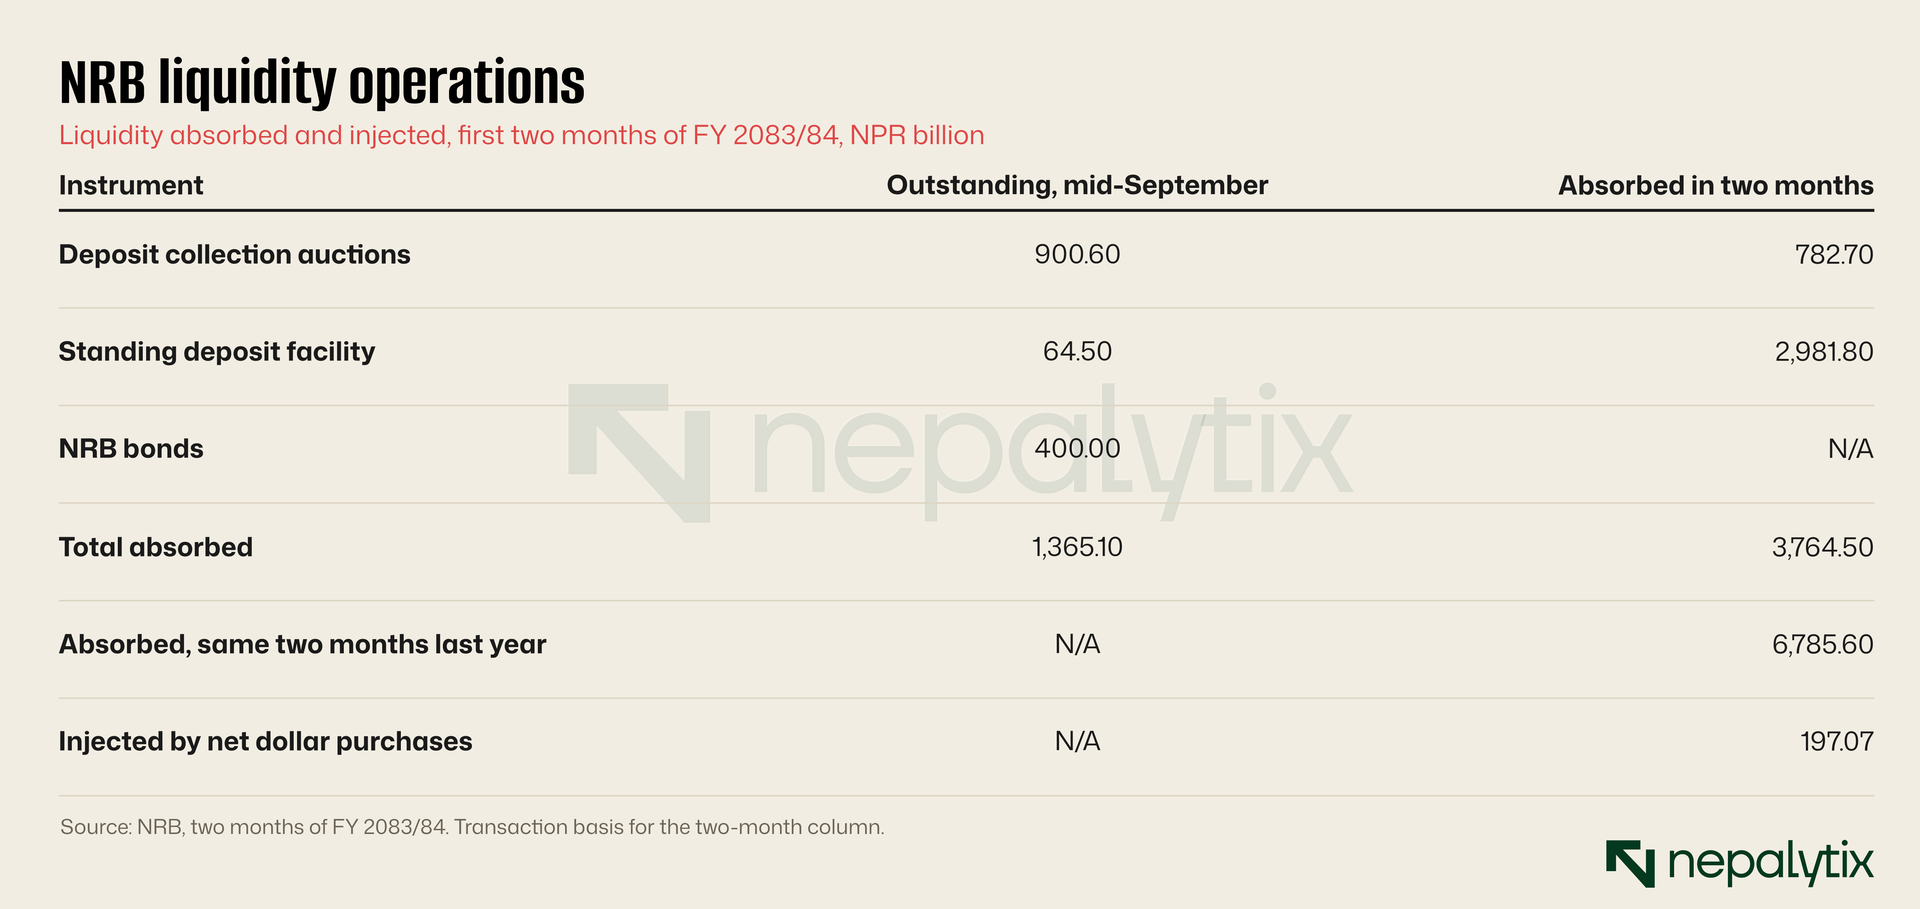
On 5 October we argued NRB should absorb liquidity rather than cut rates. It is doing so: its latest deposit-collection auction, on 29 October was Rs 150bn for eight days. NRB also bought $1,289.33m from the market in the two months which injected Rs 197.07bn. It is absorbing money with one hand and creating it with the other.
07. The rupee flatters remittances
Remittances rose 23.9% in rupees to Rs 436.36bn in the two months. In dollars they rose 13.5%, to $2.85bn. Chart below shows the gap. In the same window last year dollar growth was 27.6%. It has halved.
65-On 5 October we argued NRB should absorb liquidity rather than cut rates. It is doing so: its latest deposit-collection auction, on 29 October was Rs 150bn for eight days. NRB also bought $1,289.33m from the market in the two months which injected Rs 197.07bn. It is absorbing money with one hand and creating it with the other.
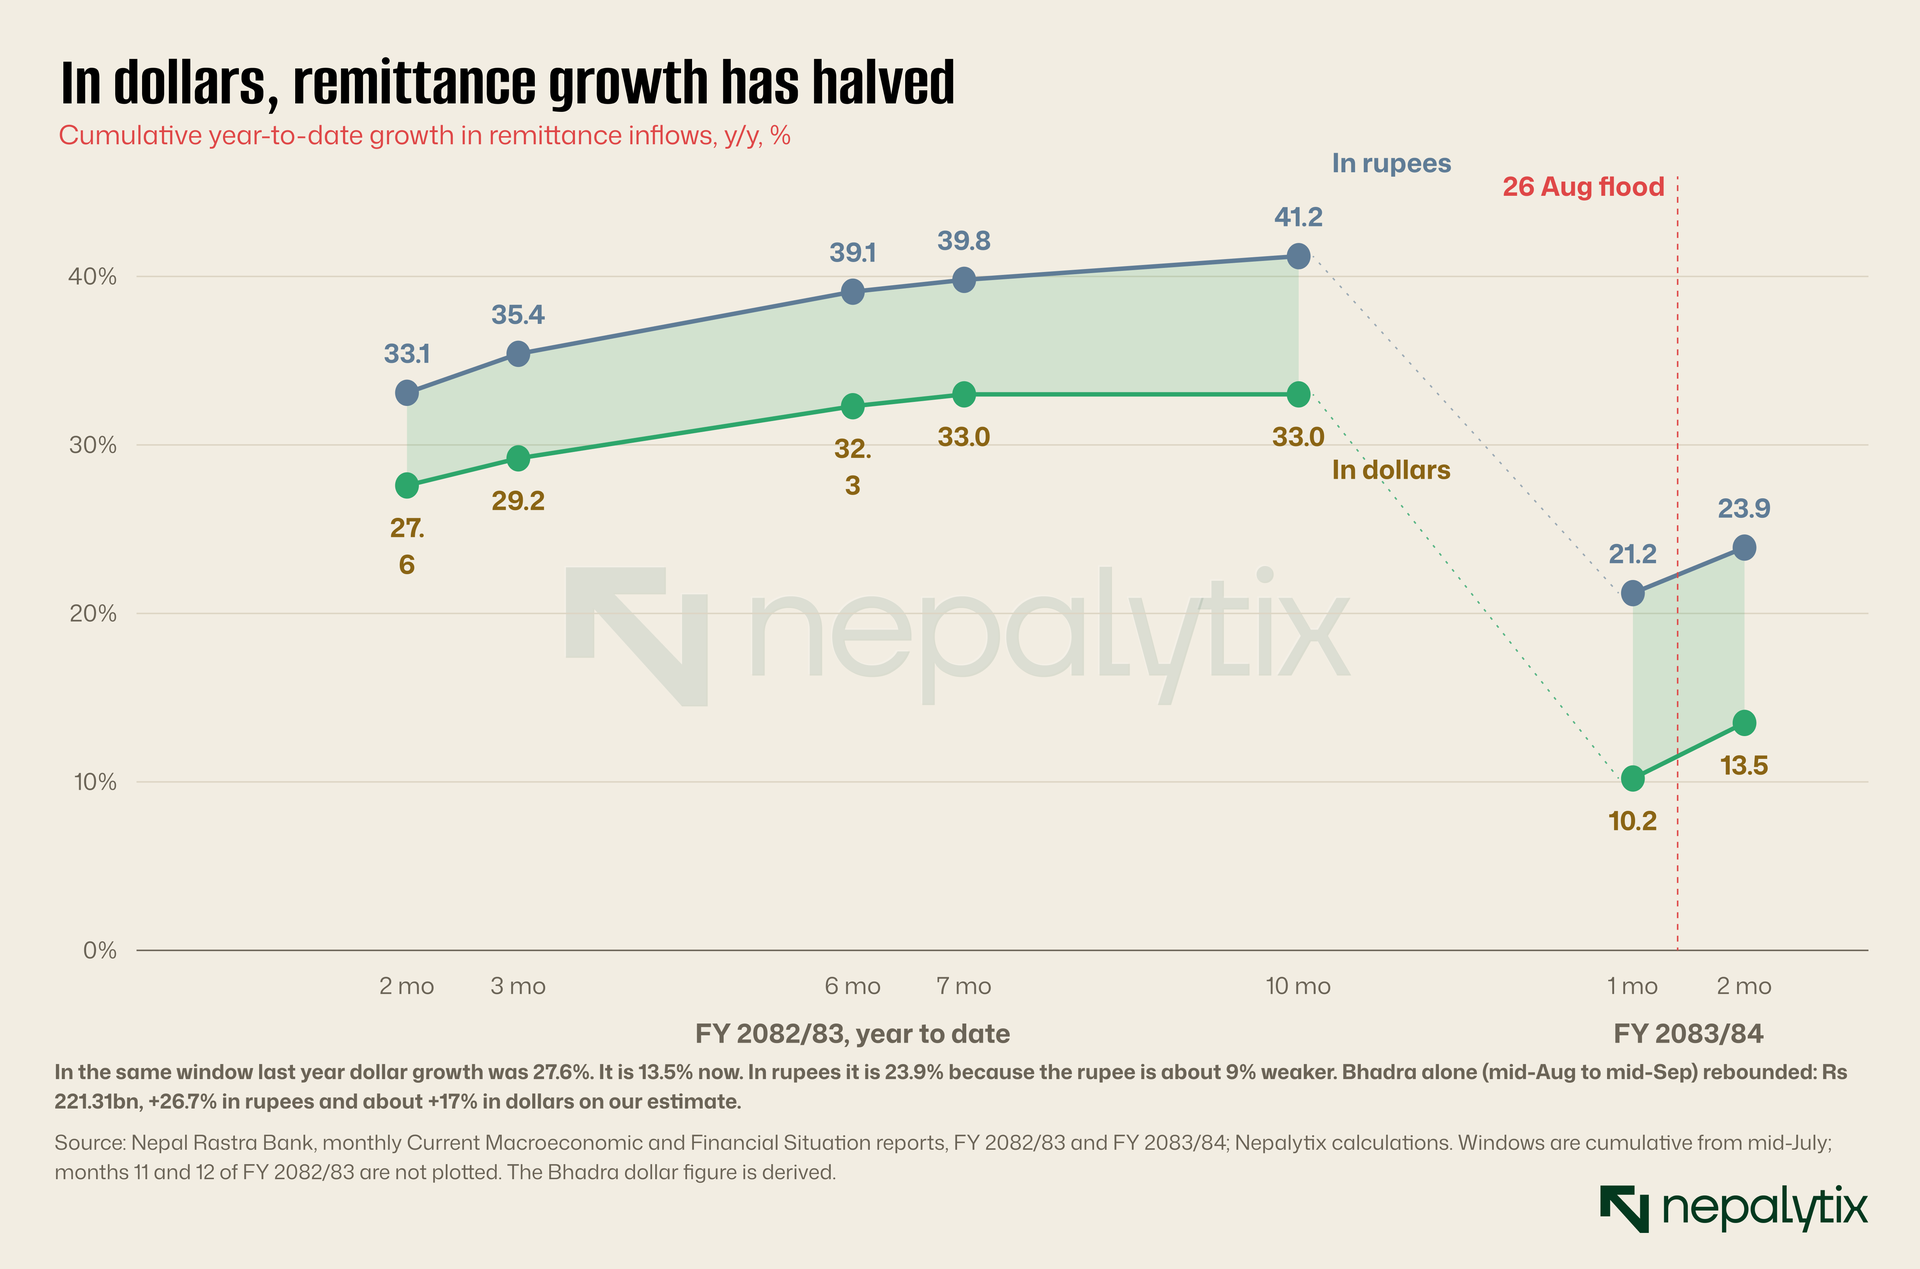
The gap between the two lines is the rupee’s slide. The totals imply about Rs 153 to the dollar now and Rs 140 a year ago, a 9.2% drop by our calculation. A reader who sees +23.9% is seeing slower dollar growth with a currency effect on top. Reserves are built in dollars.
There is a rebound inside the numbers. Bhadra alone, mid-August to mid-September, brought Rs 221.31bn against Rs 174.67bn a year ago. That is up 26.7% in rupees and by our estimate about 17% in dollars, better than the first month’s 10.2%. The other signal is the pipeline of workers: first-time foreign-employment approvals fell 13.2% to 78,320 while renewals rose 13.7% to 52,163. Fewer new workers are leaving.
08. Where the dollars end up
The balance of payments is where they land. In the two months the current account was in surplus by Rs 169.04bn and the overall balance of payments by Rs 187.68bn against Rs 153.68bn a year ago. Chart below builds it up.
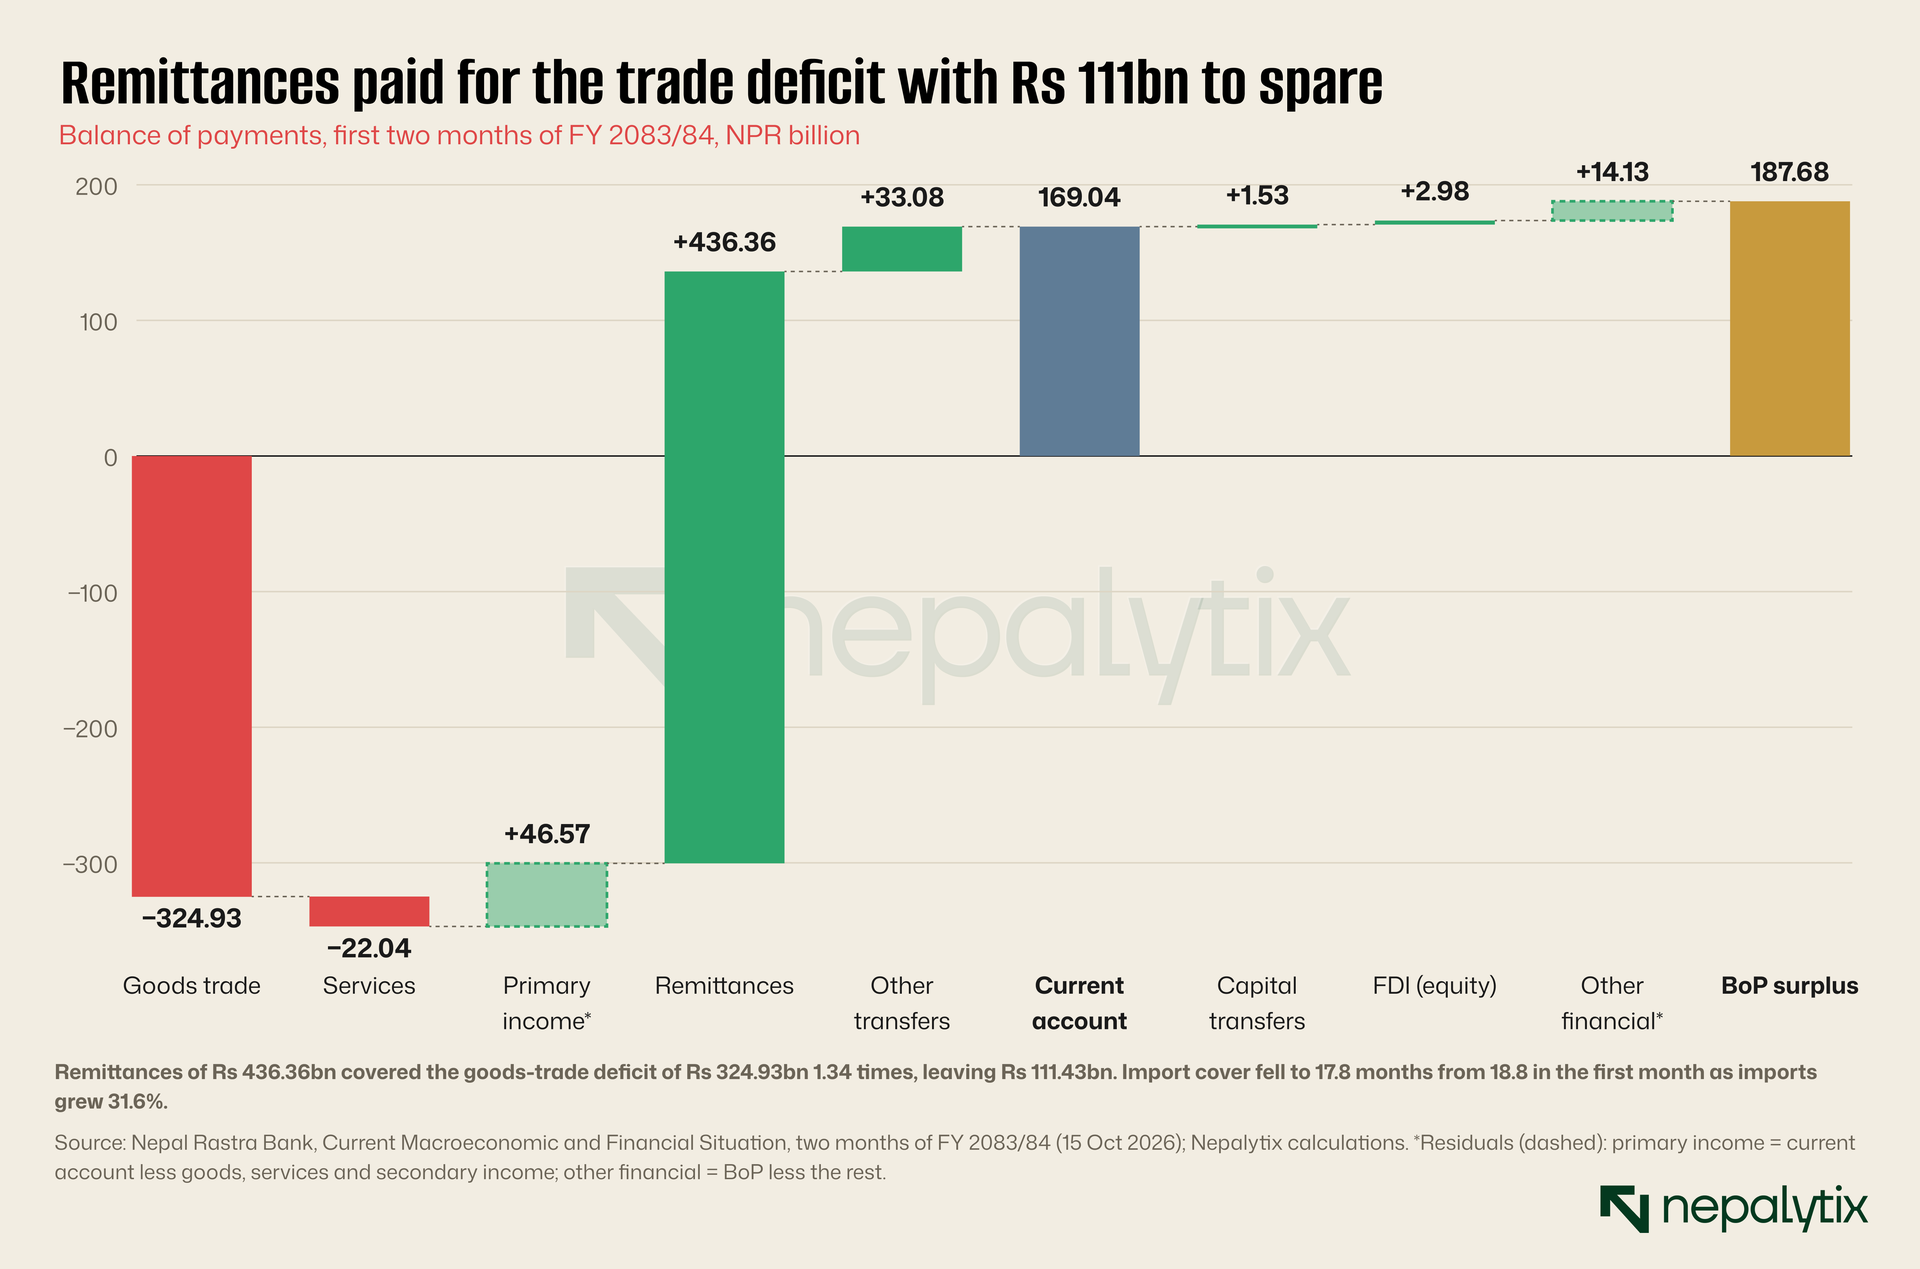
Remittances of Rs 436.36bn covered the goods-trade deficit of Rs 324.93bn 1.34 times leaving Rs 111.43bn. Exports rose 61.9% to Rs 76.59bn led by soybean oil, polyester yarn and palm oil. Imports rose 31.6% to Rs 401.52bn led by petroleum products, fertiliser and edible oil. Net foreign assets rose Rs 187.68bn which is why broad money is growing 14.9% a year while credit grows 7.3%.
Gross reserves are Rs 4,065.78bn ($26.48bn). They cover 17.8 months of goods and services imports, down from 18.8 in the first month’s report because imports are growing faster than reserves. That is far above the seven-month floor so it is a direction, not a risk.
One more number. Imports from China are up 17.2% and exports to China 137.6% even though the Rasuwagadhi crossing was damaged on 26 August. The window holds only about three weeks after the flood so the effect on trade is not yet visible.
09. The flood and the state
The report does not mention the 26 August flood, and its numbers cover only the three weeks after it. The flood came down the Bhote Koshi and Trishuli rivers, killed hundreds of people, badly damaged the Rasuwagadhi–Gyirong border crossing and hit hydropower plants along the Trishuli corridor. The Asian Development Bank cut its growth forecast for this fiscal year by 0.4 points to 4.1% and expects the floods to raise inflation by constraining supplies and lifting logistics costs. The government’s initial estimate of what recovery will need is Rs 723.31bn.
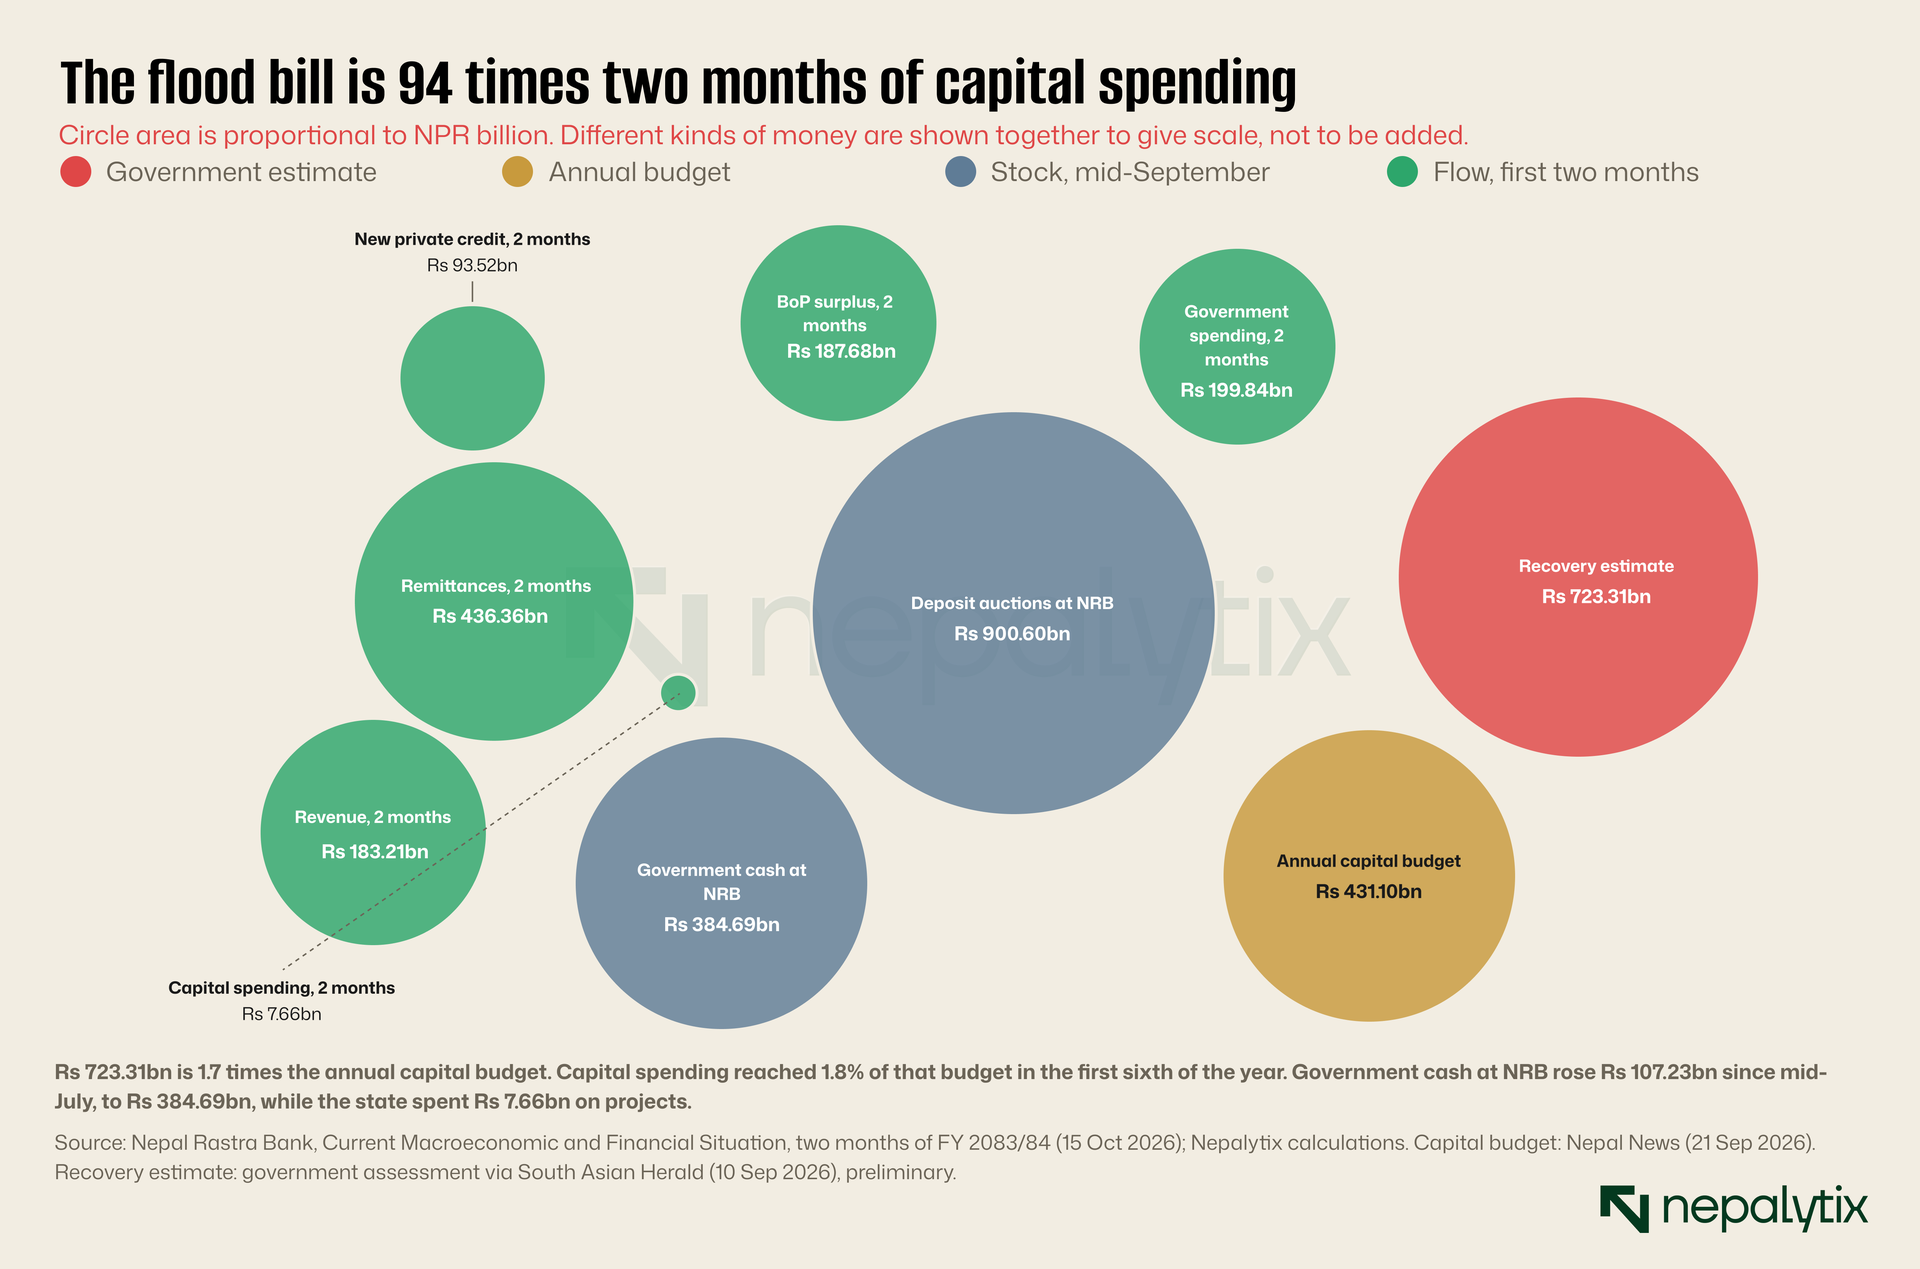
Set that against what the state is doing. In the first two months it spent Rs 199.84bn up 10.9%, of which only Rs 7.66bn, 3.8%, was capital spending. Two years ago capital spending was Rs 14.89bn, 10.8% of the total. Recurrent spending is 47% higher than two years ago and financial payments 77% higher. The annual capital budget is Rs 431.10bn and 1.8% of it has been spent in a sixth of the year.
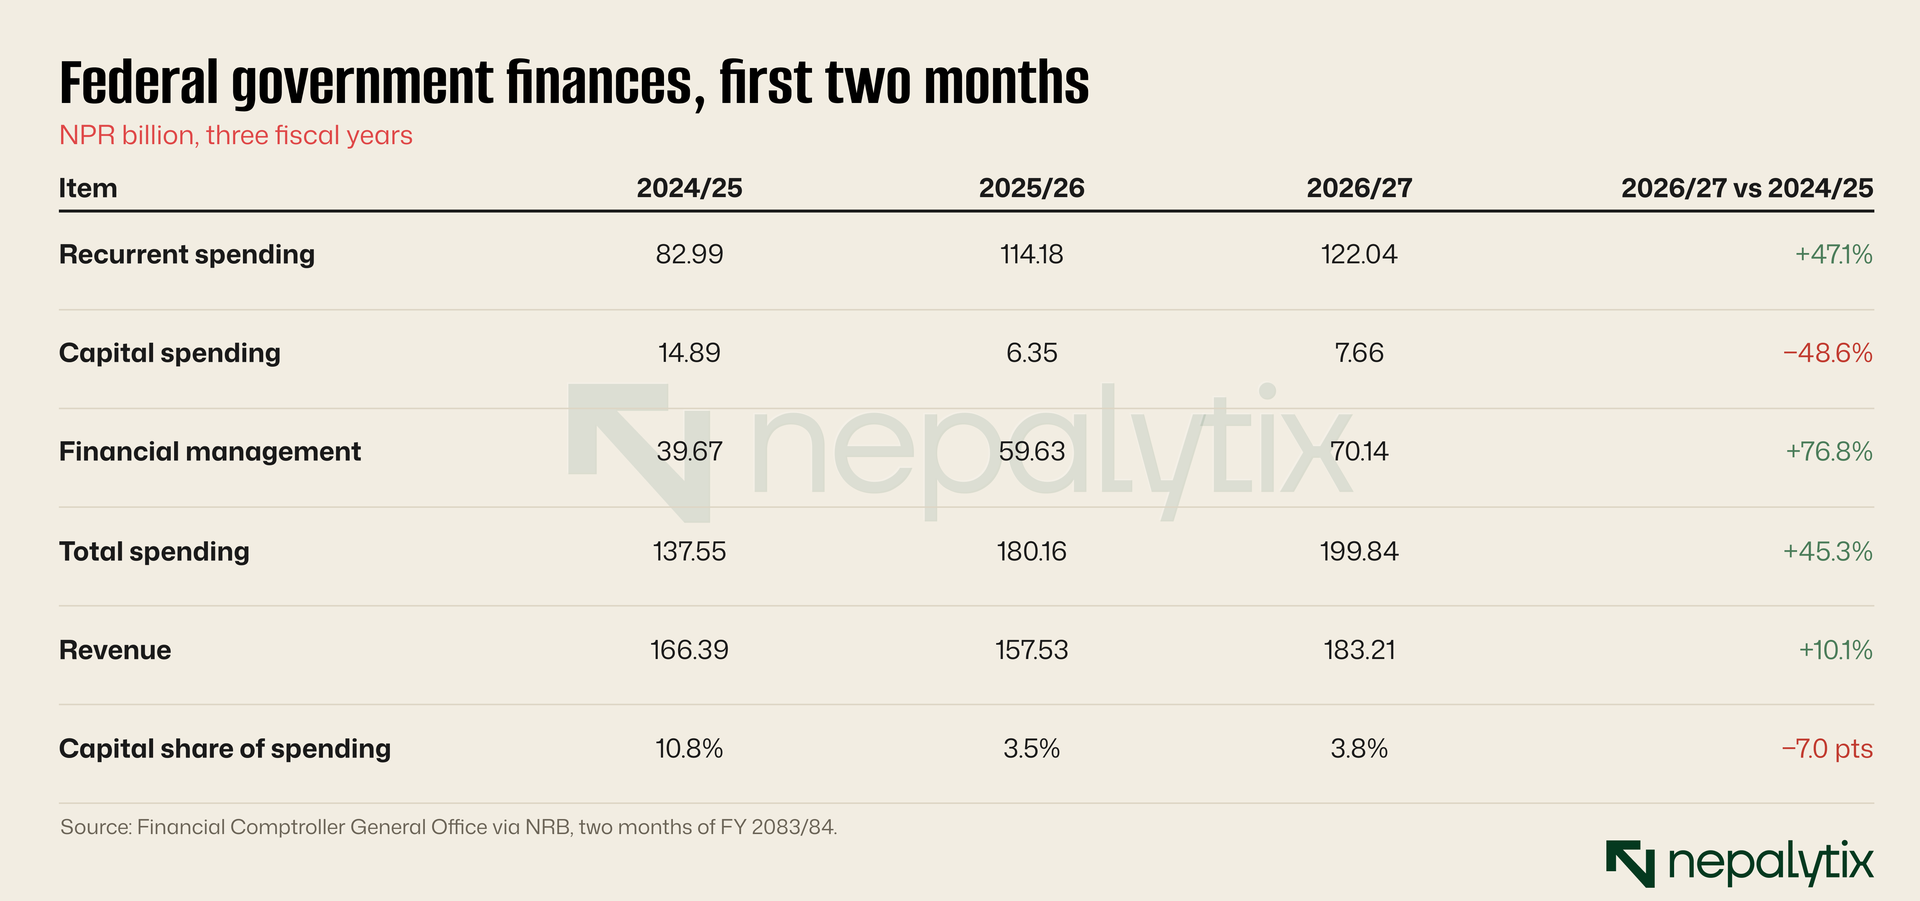
Revenue is doing better: Rs 183.21bn, up 16.3%, with indirect taxes at 75.3% of the total against 64.3% two years ago and direct taxes down to 18.2% from 21.3%. Government cash at NRB rose from Rs 277.46bn in mid-July to Rs 384.69bn, up Rs 107.23bn. The state is collecting more than it spends on projects, and holding the difference.
10. What it means
Three conclusions, each tied to a number above.
Rate cuts will not fix this. Real deposit returns are already −3.23 points and real lending rates about zero. A cut lowers the floor of the corridor and deposit rates further, and does nothing for loan demand which is not price-constrained. The instrument that matches the problem is the one NRB is already using absorbing liquidity. The job is now Rs 1,365.10bn.
The state is the missing demand. The system holds Rs 2.4 trillion of deposits that were not lent, the government holds Rs 384.69bn in cash, the recovery bill is Rs 723.31bn and the capital budget has spent 1.8% of itself. Turning idle money into rebuilt roads and power is the fastest way to restore supply. It carries a price: reconstruction competes for cement, steel and diesel in a year when the ADB already expects the flood to raise inflation. Spending is necessary and not free of price effects.
Banks carry the exposure. The spread is 0.43 points narrower, credit grows 7.3% against an 11% target and the NPL ratio was 5.66% in mid-July, before the flood. Hydropower, 17.8% of market value, is the sector whose assets the flood hit directly. Banks and insurers are 51.4%. First-quarter bank results, due in November, are the first read.
11. What to watch
NRB’s three-month report, covering the period to mid-October is expected in mid-November. It is the first with a full month after the flood. Five readings matter.
Inflation. Above 6.34% is a third month of acceleration. A fall would be the first sign the pressure is temporary.
Imports from China. They were up 17.2% in this report. If they fall, the flood has reached the trade data.
Capital spending. It was 3.8% of spending at two months. Watch whether that share rises.
Government cash at NRB. It was Rs 384.69bn. A fall means the state is spending. A rise means it is holding.
Bank first-quarter results and the NPL ratio. The first quarterly numbers after the flood, and a test of the 7.3% credit growth.
Disclaimer
This report has been prepared by Nepalytix for informational and educational purposes only and does not constitute investment advice, an offer, or a solicitation to buy or sell any securities.
The information contained in this report is based on sources believed to be reliable; however, Nepalytix does not guarantee its accuracy, completeness, or timeliness. Opinions, estimates, and projections expressed herein are those of the authors as of the date of publication and are subject to change without notice.
Investing in securities involves risks, including the possible loss of principal. Past performance is not indicative of future results. Readers are advised to conduct their own independent research and consult with a qualified financial advisor before making any investment decisions.
Nepalytix and its contributors may hold positions in the securities discussed in this report at the time of publication or thereafter.
Neither Nepalytix nor any of its affiliates accept any liability for any loss arising from the use of this report or its contents.