Nepal’s Hotel Earnings Puzzle
Nepal’s tourism arrivals have nearly returned to their 2019 peak but two of three listed hotels reporting earnings are still losing money.
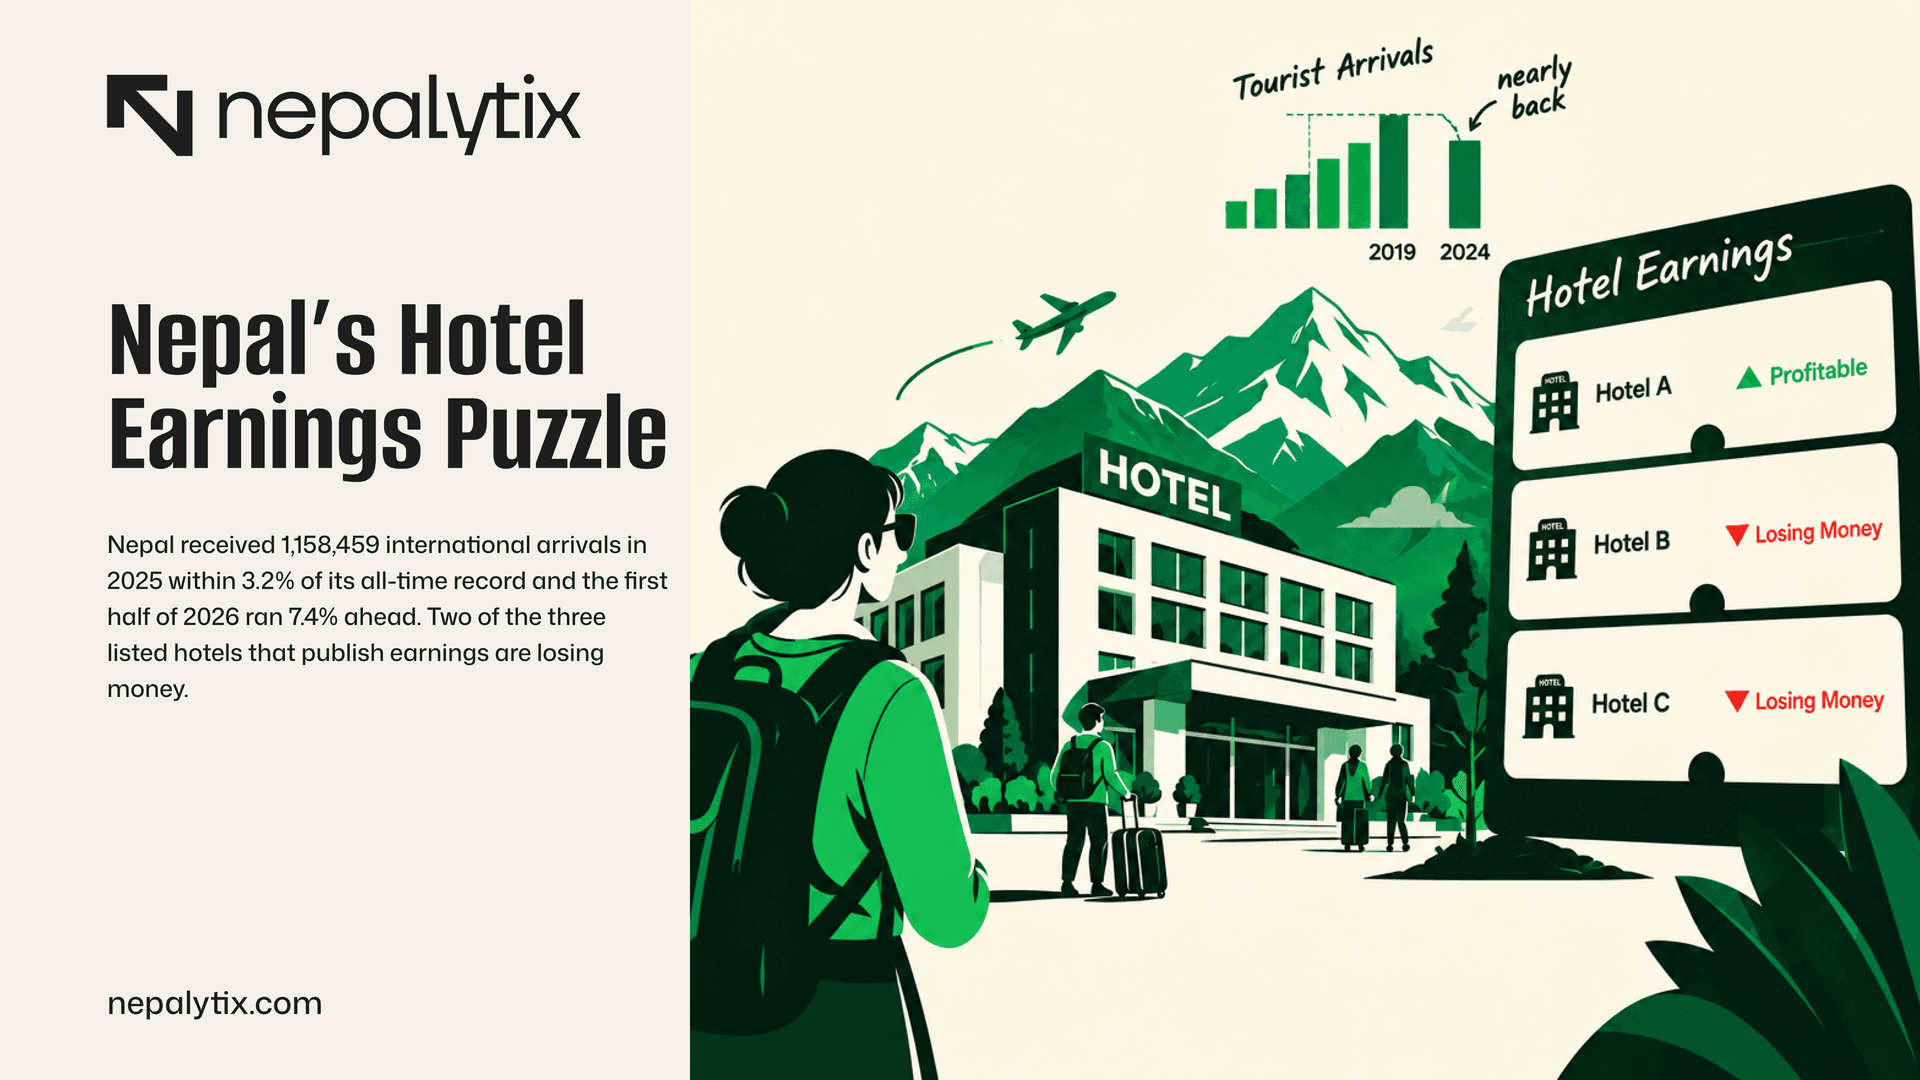
Nepal received 1,158,459 international arrivals in 2025 within 3.2% of its all-time record and the first half of 2026 ran 7.4% ahead. Two of the three listed hotels that publish earnings are losing money.
In 2019 Nepal received 1,197,191 international visitors, the most in its history. The following year it received 230,085. In 2021 it received 150,962.
Last year it received 1,158,459, which is 3.2% short of the record. The first half of 2026 ran 7.4% ahead of the same period in 2025.
Over that same recovery, the companies listed on the Nepal Stock Exchange to own hotels have been losing money.
The recovery
−3.2% 2025 arrivals against the 2019 peak
The arc is worth setting out precisely because the shape of it determines what a hotel business has been living through.
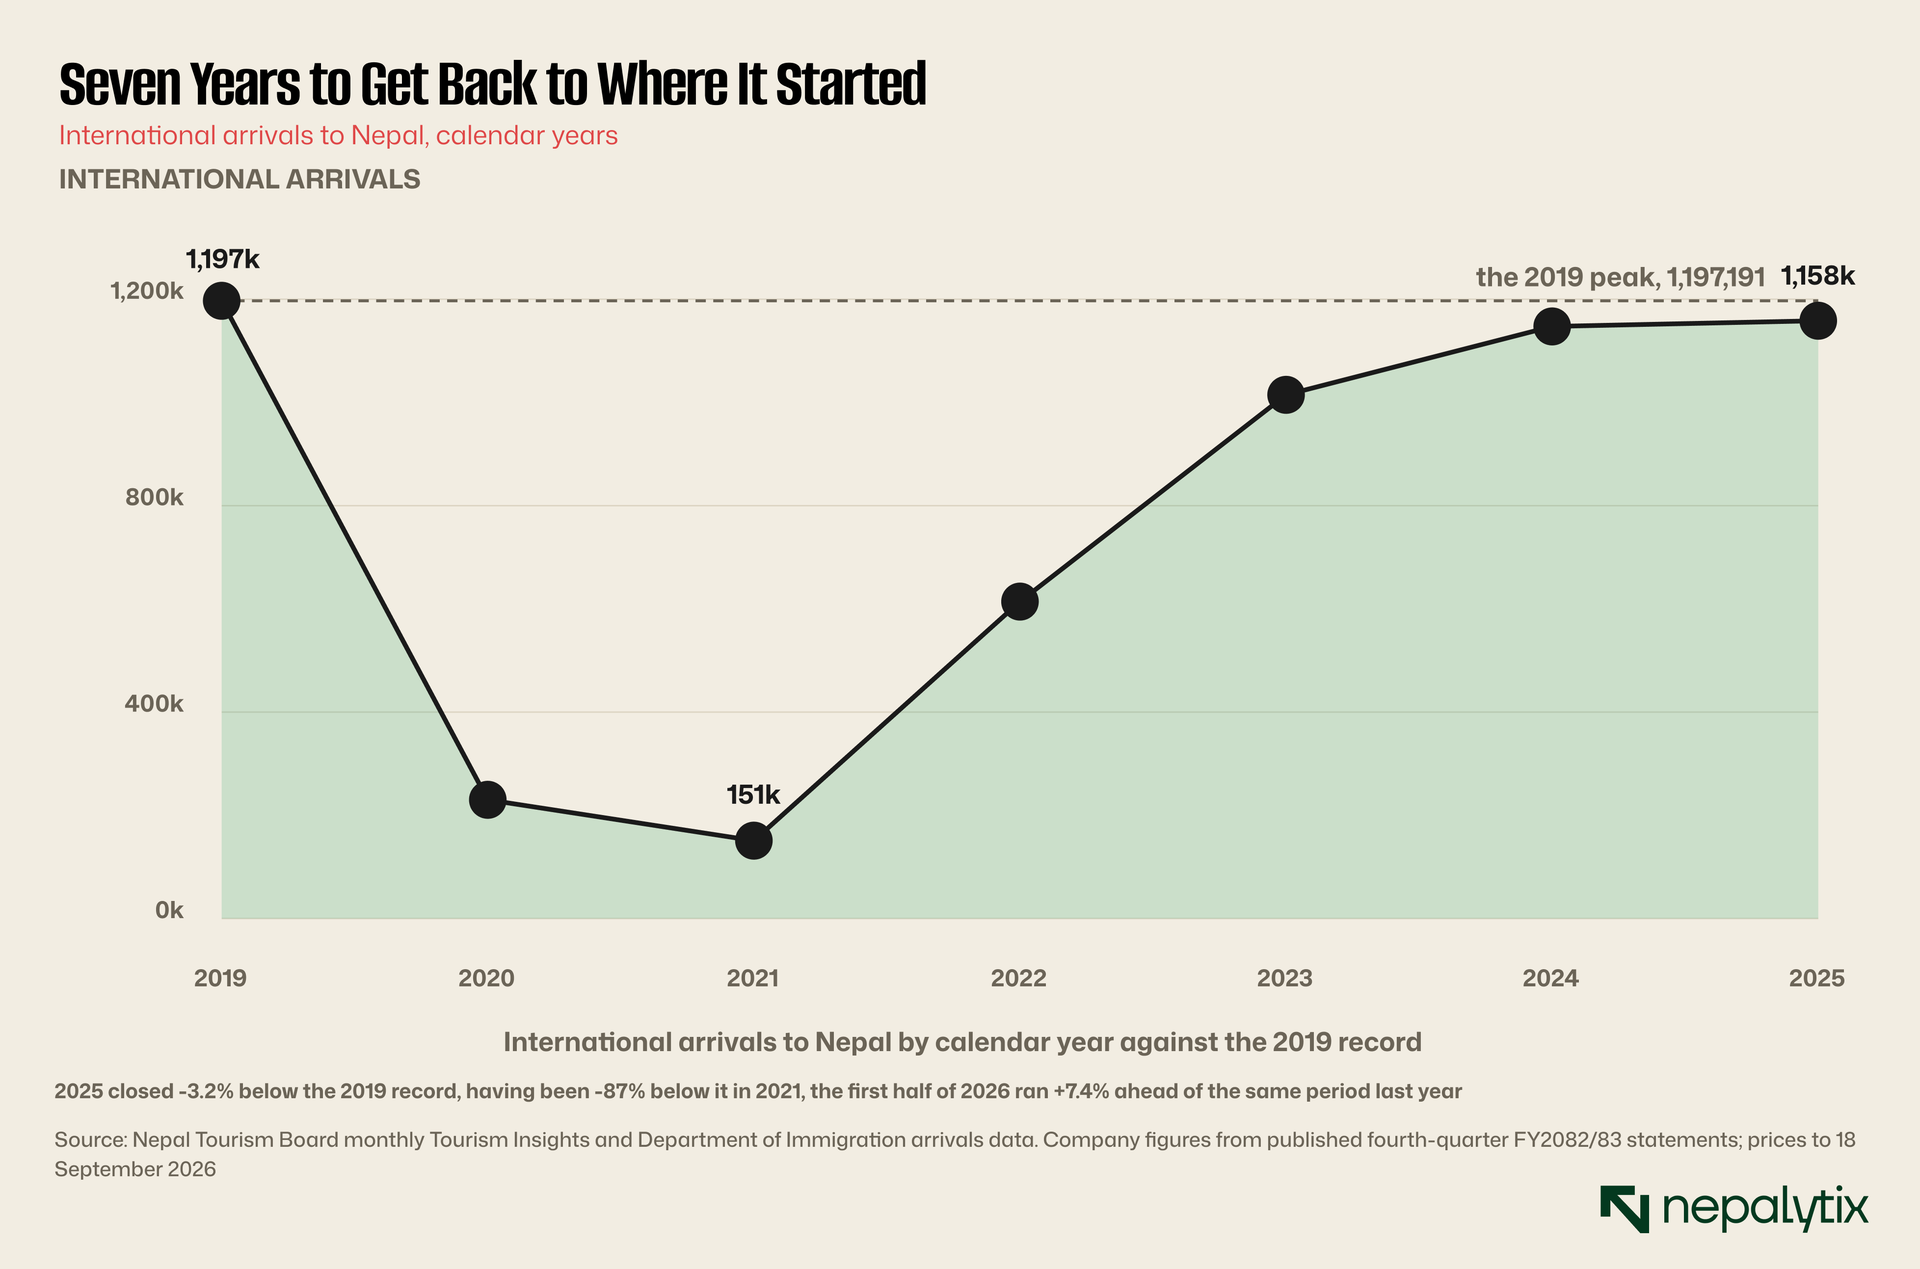
Arrivals fell 80.8% in 2020 and a further 34.4% in 2021. From a base of 150,962 they then rose to 614,148, then 1,014,882 then 1,147,567 then 1,158,459.
That is a seven-year round trip. A hotel that was full in 2019 was empty for two years then filled again over four and is now roughly where it started.
The growth between 2024 and 2025 was 0.9%. The recovery is essentially complete which means the sector has stopped being a recovery story and started being a normal business again.
6,20,453 arrivals in the first half of 2026
The first half of 2026 is the first period that can be read as ordinary growth rather than rebound. It came in at 620,453 against 577,700 a year earlier.
It is worth pausing on what those two empty years did to a hotel's balance sheet because the recovery in arrivals does not undo them.
A hotel is a fixed asset financed with debt. During 2020 and 2021 the asset earned almost nothing and the debt accrued interest regardless. Nepali banks restructured a great deal of hospitality lending through that period which deferred the obligation rather than removing it.
So a hotel arriving into 2025 with the same number of guests it had in 2019 does not arrive with the same balance sheet. It arrives with two years of deferred obligations, a depreciated property it could not maintain and in several cases restructured debt now amortising.
The arrivals chart measures the top of the income statement. Everything below that line carries the memory of the gap.
There is a second asymmetry. Arrivals returned to 2019 levels in nominal visitor numbers not in real spending. Nepali inflation compounded through the period and the rupee depreciated so the same number of visitors spending the same dollars supports a smaller real business than it did seven years ago. Nothing in the arrivals series captures that.
One more feature of the arc matters for anyone reading the 2026 figures as they arrive.
The recovery years each compared against a devastated prior year so the growth rates were enormous and meaningless: 307% in 2022, 65% in 2023, 13% in 2024. Those numbers described a base effect, not a business.
2025 grew 0.9%. 2026 is growing 7.4%. Those are the first two figures in six years that describe demand rather than recovery from a stoppage, and 7.4% is a genuinely good number for a mature destination.
So the sector's operating environment in 2026 is the best it has been since 2019 by any reasonable measure. That is the fact the rest of this piece has to be read against.
Two further features of the arrivals series deserve recording because they bound what the recovery means.
The first is that 2019 itself was an outlier. Nepal ran a Visit Nepal campaign into 2020 and the 1,197,191 of 2019 reflected a marketing push as well as underlying demand. Measuring recovery against a promoted peak sets a harder bar than measuring against trend.
The second is that the comparison is in visitor numbers rather than visitor days or spend. Nepal's tourism ministry has for years stated an objective of raising length of stay and spend per visitor rather than headcount, on the reasonable ground that a trekker staying eighteen days is worth more than six day-visitors.
If length of stay fell over the period, arrivals recovering to within 3.2% would correspond to bed-nights well below 2019 and the hotels would feel exactly that. Nepal publishes average length of stay annually and this note could not obtain a current figure.
So even the headline finding, that arrivals have recovered, carries a qualification: they have recovered in the unit that is counted which is not the unit a hotel sells.
The shape of the year
Nepal's tourism is seasonal in a way that determines almost everything about hotel economics and the shape is unusual: two peaks rather than one.
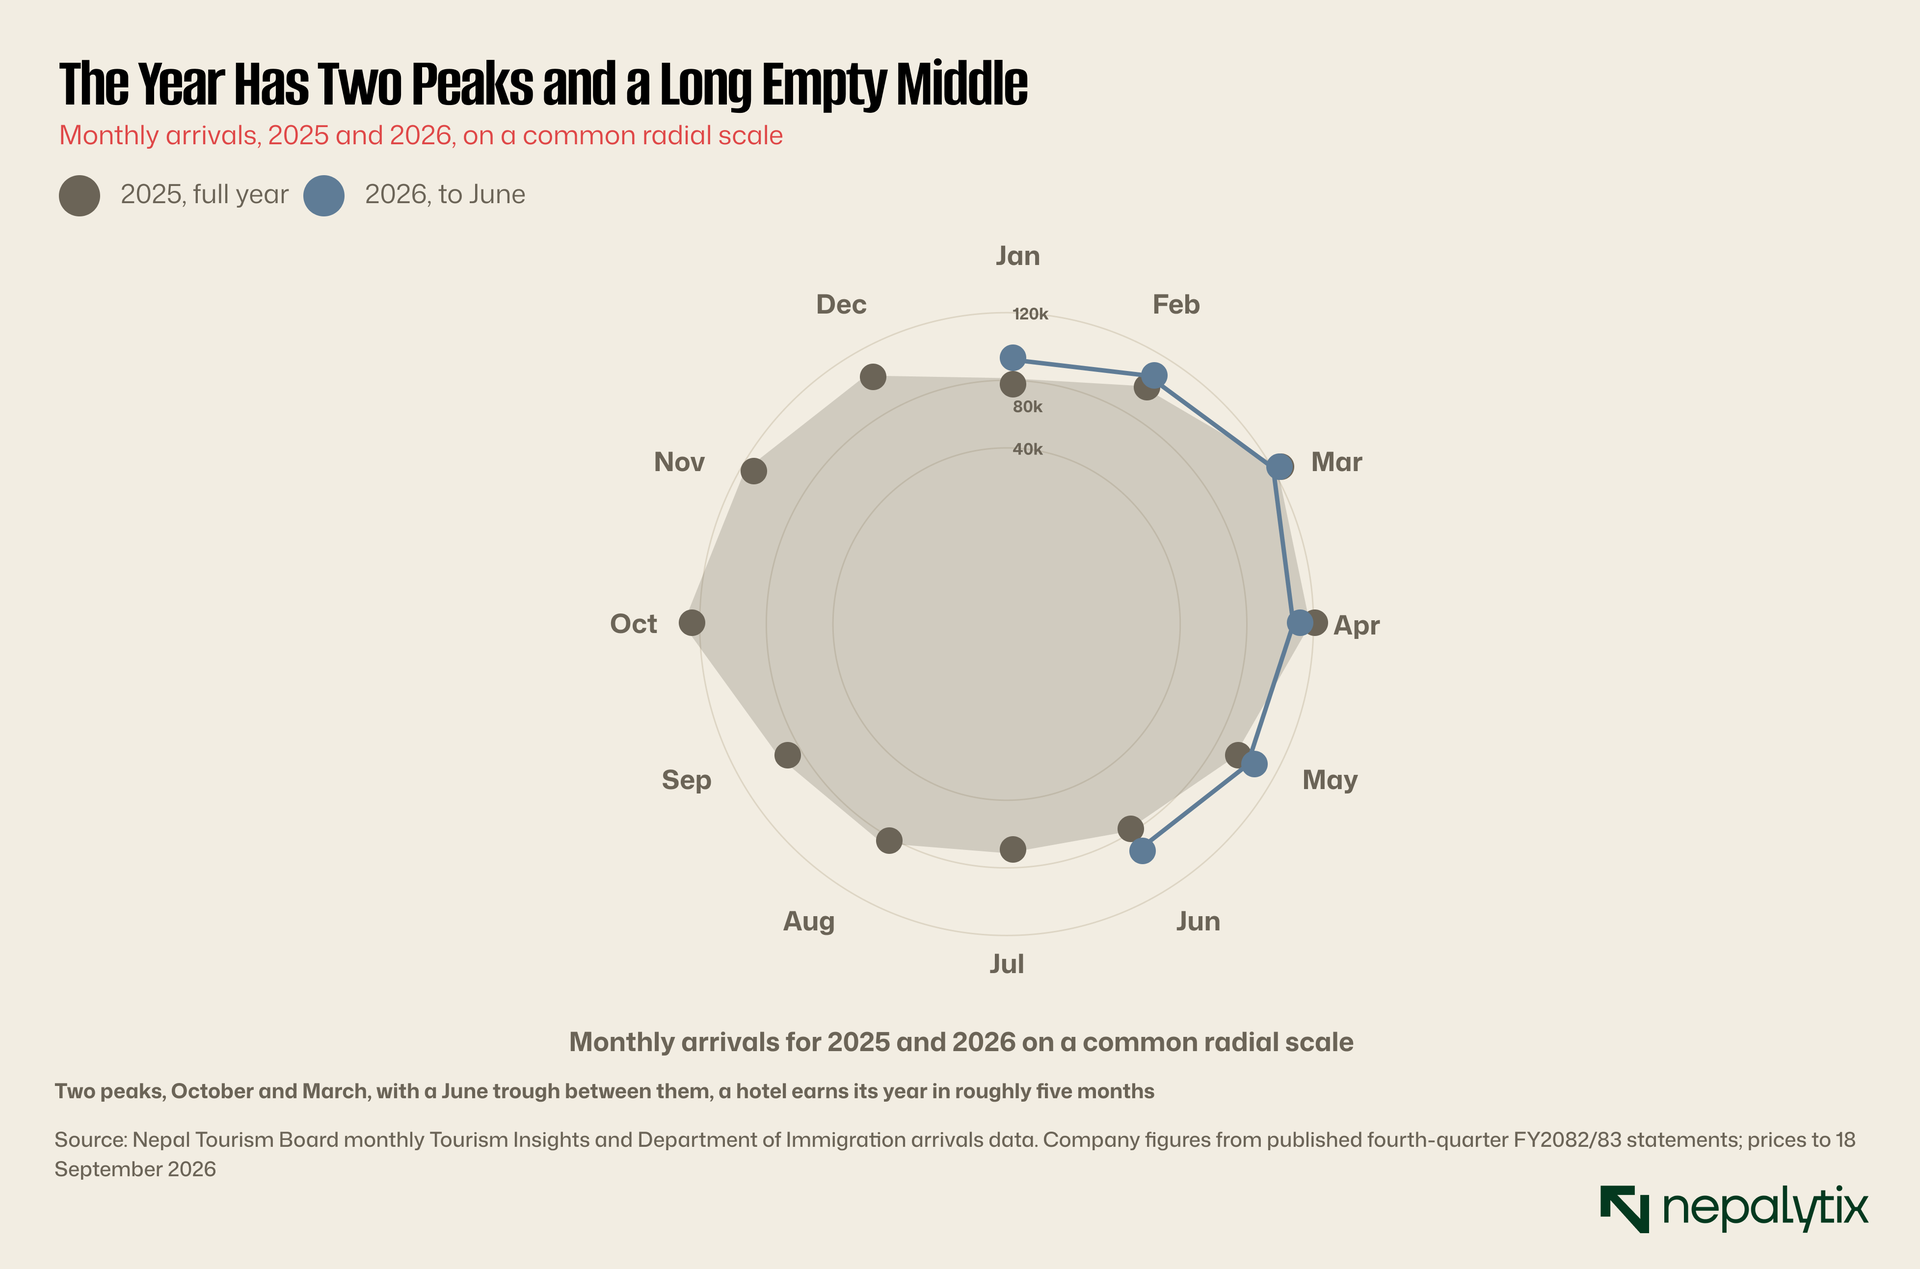
October is the larger peak driven by the autumn trekking season after the monsoon clears. October 2025 brought 128,443 visitors, the busiest month Nepal has recorded.
March is the second, smaller peak, the spring climbing and trekking window. Between them sit June, July and August when the monsoon closes the mountains.
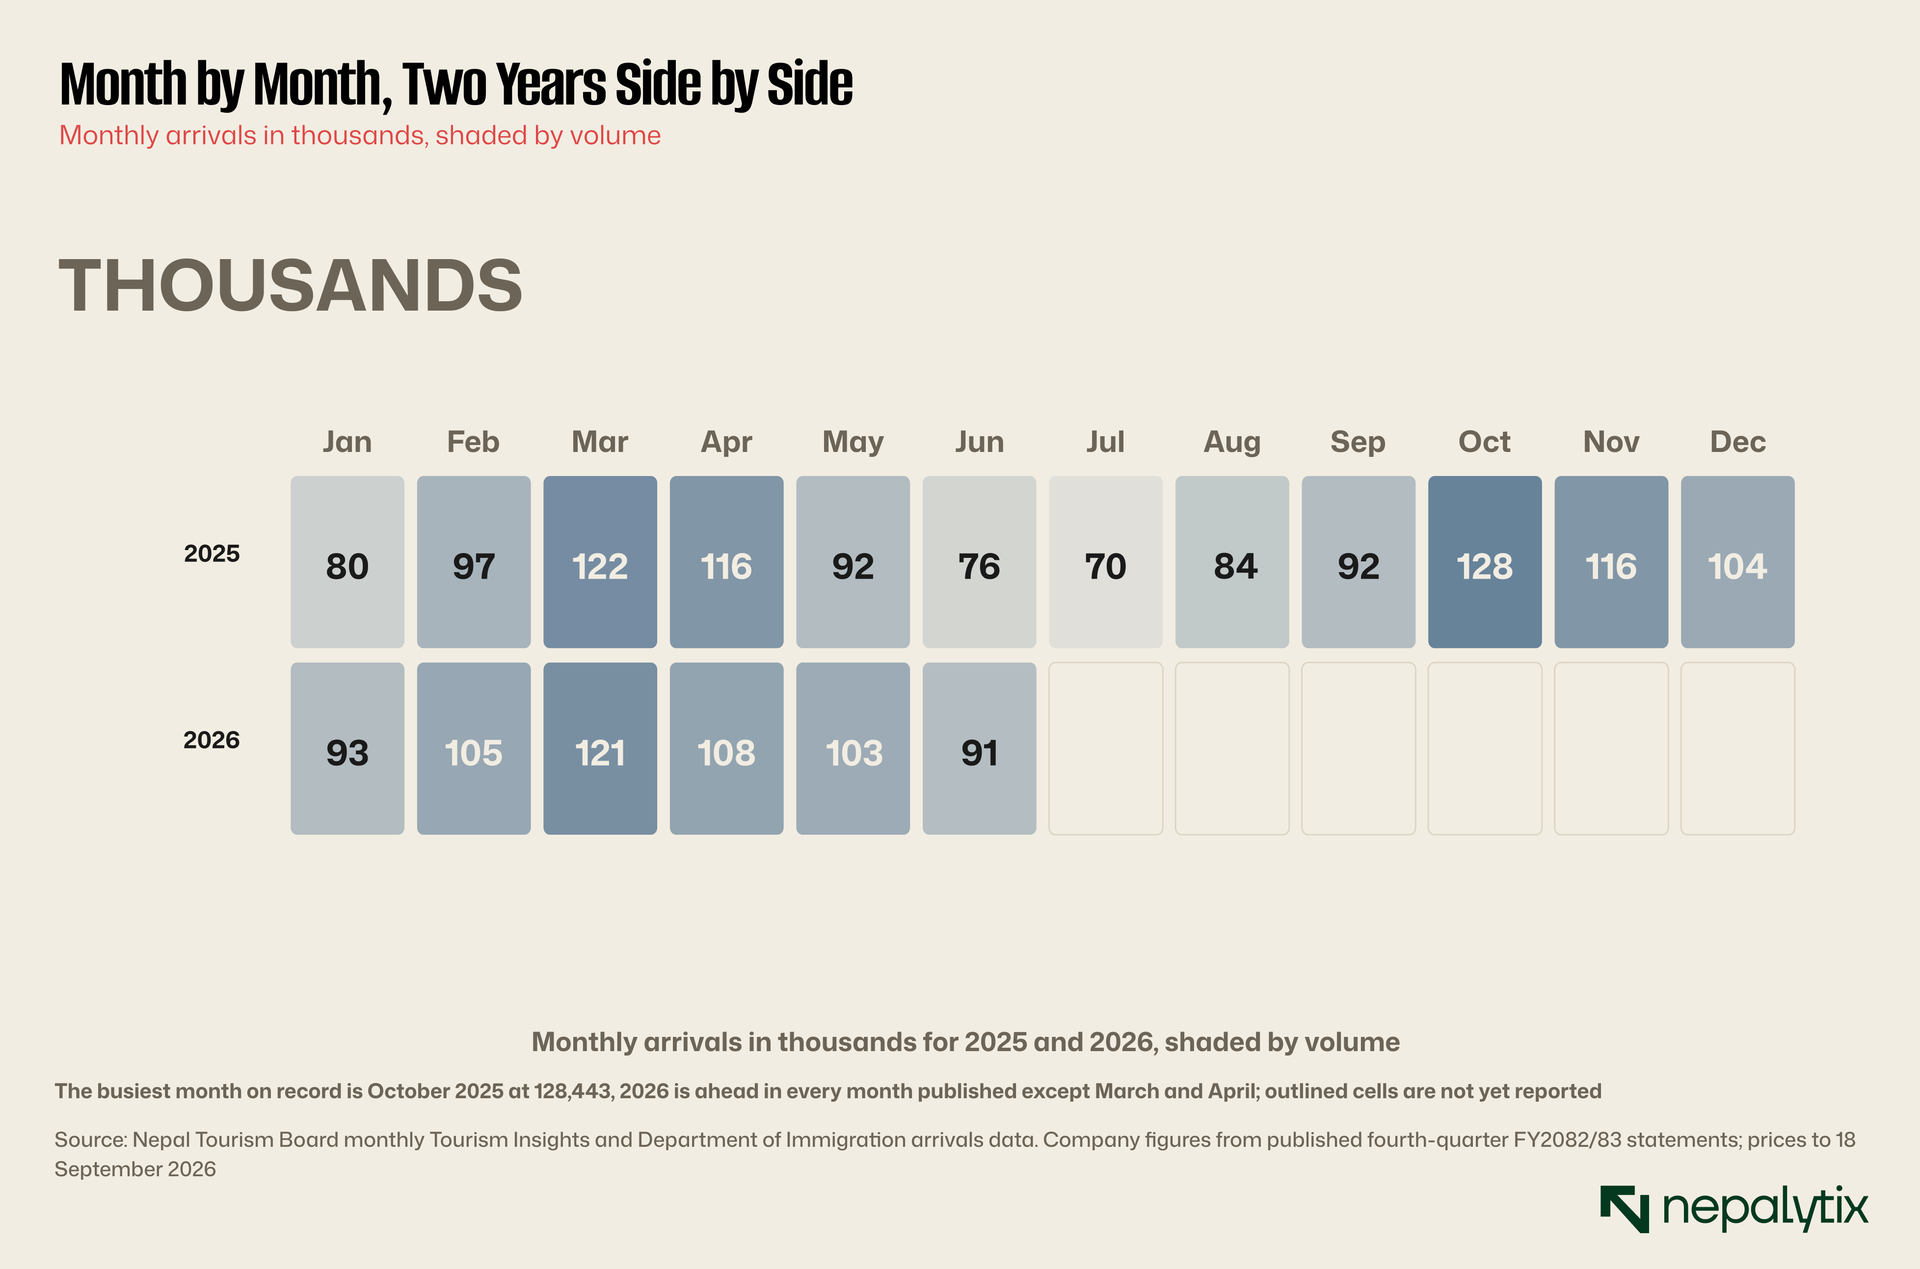
Put the two years side by side and 2026 is ahead in every published month except March and April both of which came in slightly below 2025.
The operational consequence is severe. A hotel earns its year in roughly five months and carries fixed costs through twelve. Staff, debt service, depreciation and maintenance do not observe the monsoon.
The seasonality also explains something about the listed cohort that a single year's earnings conceals: the quarterly statements are close to meaningless in isolation.
Nepal's fiscal year runs mid-July to mid-July. The first quarter therefore covers mid-July to mid-October which is the monsoon plus the start of the autumn peak. The second covers the October peak and November. The third covers the winter trough. The fourth covers the March peak and the pre-monsoon shoulder.
A hotel's quarters are not comparable with each other and a quarter-on-quarter comparison is noise. Only the same quarter a year earlier carries information and the published summaries this note could locate rarely present it that way.
Which is part of why Taragaon's annualised minus Rs 35.97 against a trailing plus Rs 6.73 is hard to read. Annualising a seasonal business from a single quarter produces a number that describes nothing.
That is a criticism of the convention rather than the company. Nepali quarterly statements annualise as standard and for a hotel the convention manufactures volatility that is not there.
The trough is worth one more look because of what it implies about the operating leverage.
Nepal's monsoon runs roughly mid-June to mid-September. In that window the mountains are closed, flights are unreliable and the trekking routes are unusable. June 2025 brought 76,425 arrivals against October's 128,443, a difference of 40%.
A hotel with 200 rooms has 200 rooms in June and 200 in October. Its staff are largely permanent because trained hospitality labour cannot be hired and released seasonally at scale. Its debt service is monthly.
So roughly forty per cent of the year's revenue has to cover something close to fifty per cent of the year's cost and the peak months have to carry the rest. That is high operating leverage and high operating leverage means small changes in annual occupancy produce large changes in profit.
It also means the peak months are where the money is made, and a disruption in October or March is worth several times a disruption in July. The August floods this publication covered fell between the two in the part of the year a hotel can most afford to lose.
The two-peak structure has a consequence for capital expenditure that shapes the whole industry.
A hotel can only refurbish in the monsoon. Closing floors in October or March costs the peak revenue that funds the refurbishment so the work has to fit into roughly ten weeks of low season.
That constrains how much can be done in any year, which means a property that has fallen behind on maintenance cannot catch up quickly. Three deferred monsoons compound into a property that needs a closure to fix and a closure costs a peak.
This is the mechanism by which the pandemic's damage persists into a recovered market and it operates on physical assets rather than on balance sheets. A hotel can refinance its debt. It cannot refinance a tired room.
Where the visitors come from
23.3% of April arrivals came from India
The second structural fact is concentration.
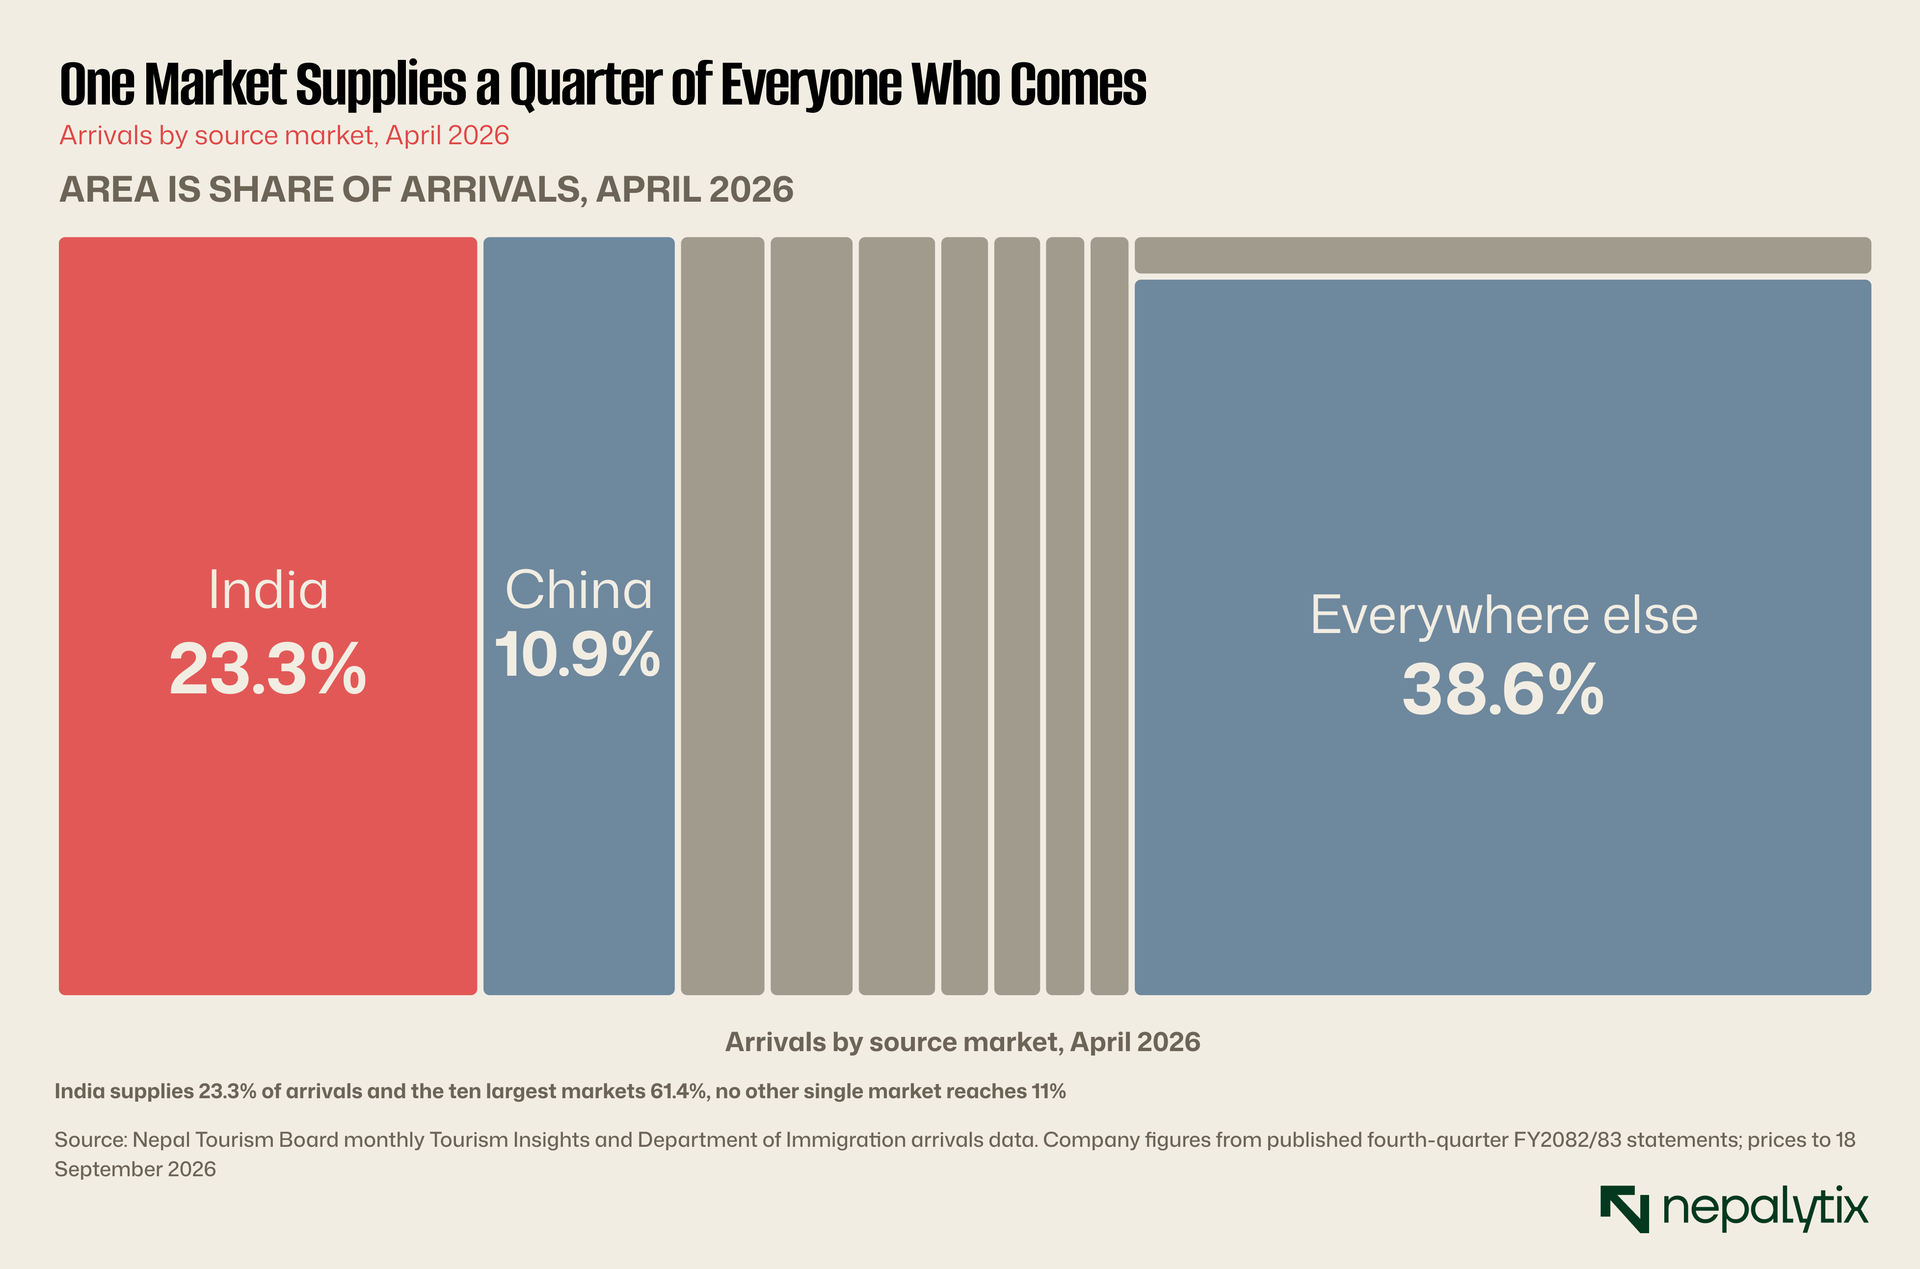
India supplied 25,196 of April's 107,934 arrivals or 23.3%. China followed at 11,722. No other single market reached 11% and the ten largest together supplied 61.4%.
Across the full year 2025 the ordering holds: India 292,438, the United States 112,316, China 95,480.
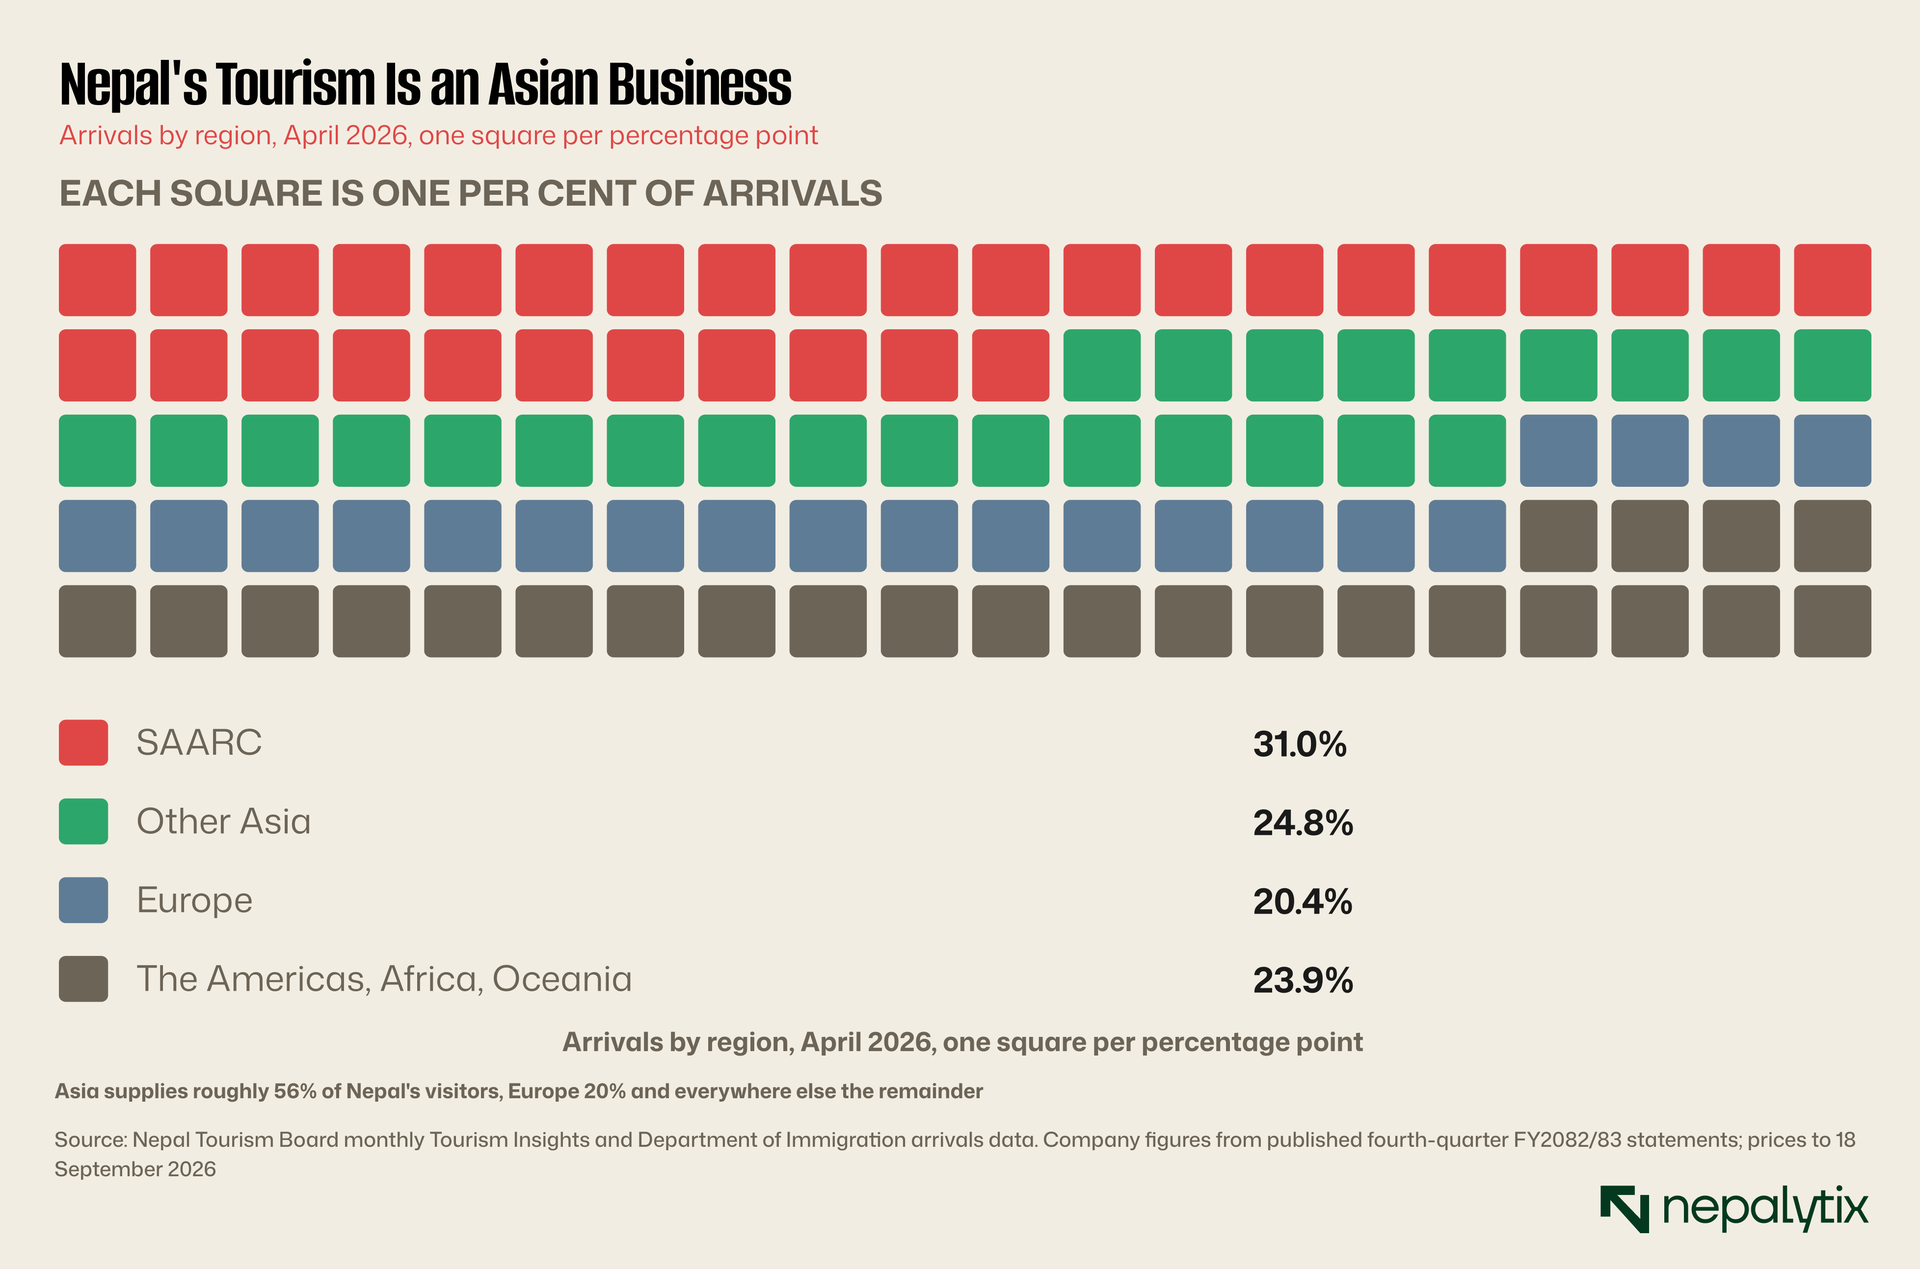
Grouped by region, SAARC countries supplied 31% of April's arrivals and other Asian countries a further 24.8%. Europe supplied 20.4%.
So roughly fifty-six per cent of Nepal's visitors come from Asia and a quarter of the total comes from a single neighbour with an open border.
That matters for what a hotel can charge. An Indian visitor arriving overland for a short religious or leisure trip and a European arriving by air for a three-week trek are different customers with different spending and the Nepali listed hotels serve the second while the arrivals growth is increasingly the first.
The India figure deserves closer reading than it usually gets because the visitor it describes is not one type of person.
Indian arrivals to Nepal fall into at least three groups. Religious travellers to Pashupatinath, Janakpur and Muktinath, typically overland often in organised groups staying in modest accommodation. Leisure travellers to Pokhara and Kathmandu, often by air staying mid-market. Business travellers to Kathmandu who overlap with the listed hotels customer base.
The Nepal Tourism Board does not publish the split. What is published is the total and the total is what gets quoted when the sector's prospects are discussed.
A hotel operating a five-star property in Kathmandu competes for the third group and a fraction of the second. Arrivals growth driven by the first affects its business hardly at all and may affect it negatively by crowding the destination's infrastructure without adding to its revenue.
This is the mix problem stated concretely, and it is the most plausible single explanation for why record arrivals and hotel losses coexist. It also cannot be tested from published data.
The China figure carries its own question. China supplied 95,480 visitors in 2025 and 11,722 in April 2026, but the April 2026 China number was 29.5% below April 2025 on the Tourism Board's own comparison. A market that large moving by nearly a third in a year is a material swing for hotels positioned to serve it.
The regional split has a further implication for how the growth should be read.
SAARC arrivals rose to 35.4% of the total in March and stood at 31% in April. Both figures are higher than the long-run pattern which means the composition is shifting toward the region even as the total recovers.
For Nepal's balance of payments that is broadly neutral; a visitor is a visitor and tourism earnings are tourism earnings. For a hotel positioned at the top of the market it is not neutral at all, because the segment growing fastest is the one it does not serve.
Thursday's Long Read of 24 September found the same pattern in remittances: an aggregate that looks healthy concealing a composition that had moved. Aggregates conceal composition, and in Nepal the composition is rarely published.
One thing the concentration figure does not mean should be cleared up, because it is often read the wrong way.
A Herfindahl index across the ten named markets comes to 0.076 which is low. Nepal is not dangerously dependent on India in the sense that a 23% market disappearing would end its tourism; seventy-seven per cent comes from elsewhere and no single other market exceeds eleven per cent.
Compare that with the remittance economy this publication examined on 24 September, where Saudi Arabia and Qatar together supplied 64% of departures at their peak. Tourism is considerably more diversified than labour migration.
The vulnerability is different and more specific. It is not that India is too large a share; it is that the Indian share is the part that is growing, and the Indian visitor is the one the listed hotels are least positioned to serve.
Diversification protects the country. It does not protect a company positioned in the segment that is not growing.
The companies
Eight companies sit in the hotels and tourism sector on the exchange. Before any comparison between them is possible, one problem has to be dealt with.
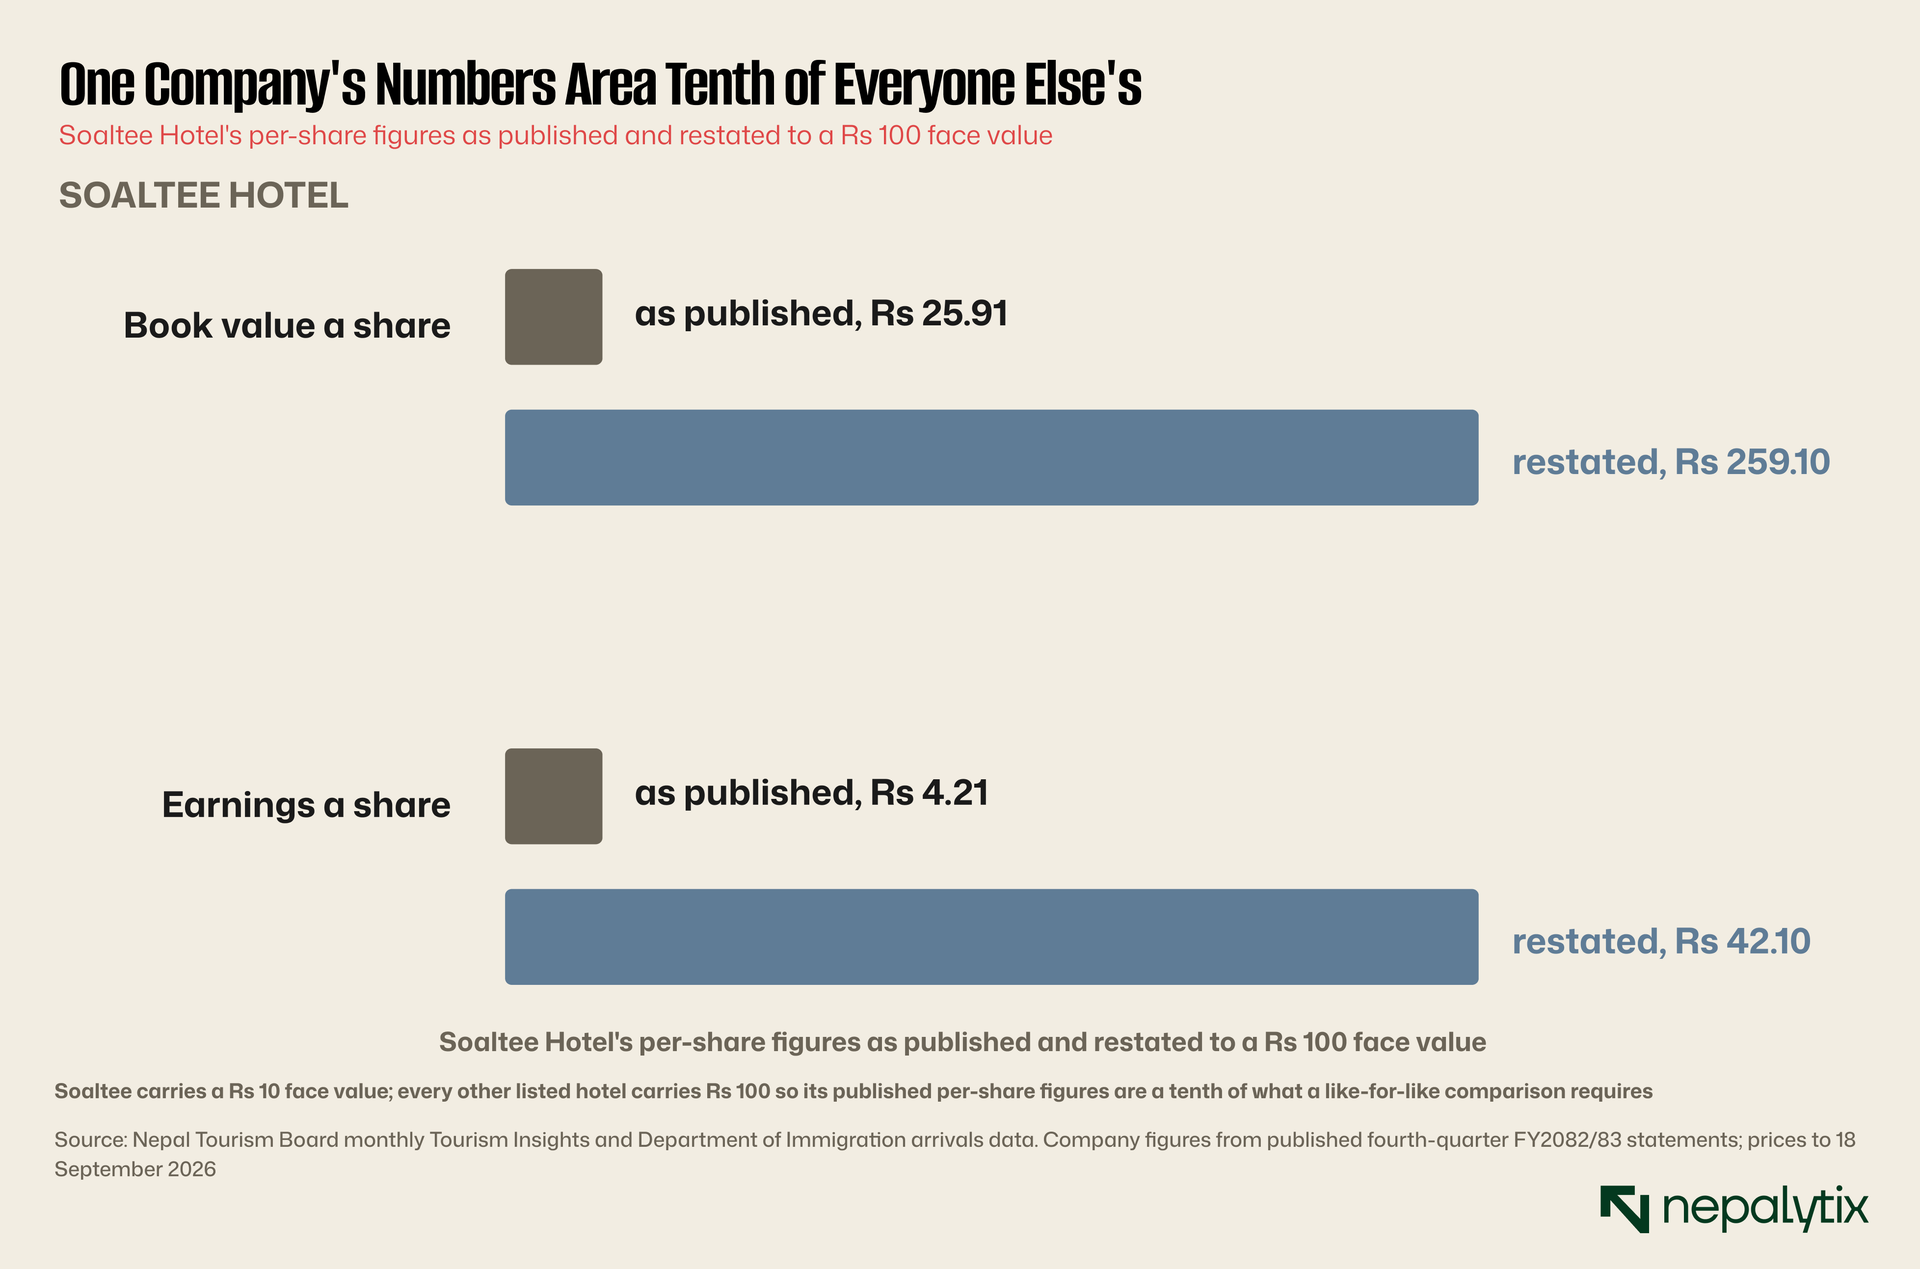
Soaltee Hotel carries a face value of Rs 10 a share. Every other listed hotel carries Rs 100.
So Soaltee's published book value of Rs 25.91 and earnings of Rs 4.21 are not comparable with Taragaon's Rs 118.71 and minus Rs 35.97. Restated to a common Rs 100 face, Soaltee's figures are Rs 259.10 of book and Rs 42.10 of earnings.
This is not a subtlety. Any table ranking Nepali hotels by earnings a share without restating will place Soaltee, the most profitable of them, near the bottom.
19.24x Soaltee's price to book value
With that fixed, the sector can be read.
The face value problem is worth one more paragraph because it is a general defect rather than a Soaltee quirk.
Nepal's Companies Act fixes ordinary share face value at Rs 100, and Sunday's piece set out what that does to dividend comparisons and what the exchange's index counts. Soaltee is an exception that predates the current convention and the exception is not flagged in the comparison tables that circulate.
An investor screening Nepali hotels on earnings a share, using any of the standard market data sites will see Soaltee at Rs 4.21 and Taragaon at minus Rs 35.97 and conclude both are poor. One of those is a company earning Rs 42.10 a share on a restated basis.
The same defect affects book value, dividend percentage and price-to-earnings. Soaltee's P/E of 118 is correct on its own face value and is not comparable with a Rs 100-face company's P/E without adjustment.
Restating is arithmetic and takes a moment. That the market data does not do it is a small failure with a large consequence for anyone comparing the sector.
Before the company figures, one more thing the arrivals data shows that bears directly on them.
April 2026 came in at 107,934 against April 2025's 116,490, a fall of 7.3%. March 2026 came in at 120,516 against 121,687, down 1.0%.
Both of those are peak-adjacent months and both went backwards. The 7.4% first-half growth is carried by January, February, May and June, which are shoulder and trough months.
So the composition of the growth is unfavourable to hotels in a second way. Arrivals are rising in the months when rooms are cheap and flat or falling in the months when they are expensive.
A hotel's revenue does not scale with arrivals; it scales with arrivals weighted by what a room fetches that month. Growth concentrated in the trough is worth a fraction of growth concentrated in October.
One methodological caution about the restatement before it is used because it is an adjustment this note is making rather than one the company publishes.
Multiplying Soaltee's per-share figures by ten converts them to a Rs 100 face basis correctly, because per-share amounts scale inversely with the share count and the share count scales inversely with face value. The arithmetic is exact.
What it does not do is make the price comparable. Soaltee's share price of roughly Rs 498 is a price for a Rs 10-face share. Restating the earnings without restating the price would produce a price-to-earnings of twelve rather than 118 which would be wrong.
So the restated figures in this note are for comparing companies on book value and earnings a share. The valuation multiples quoted are computed on each company's own consistent basis, and the two must not be mixed.
That is a fiddly point and it is exactly the sort of thing that goes wrong in published comparison tables.
What the recovery produced
City Hotel reports minus Rs 6.14 a share. It is the only listed hotel with negative reserves, and its shares have fallen 57.9% over twelve months.
Soaltee reports plus Rs 42.10 restated and is the profitable one.
Set that against the arrivals data and the contrast is the subject of this piece. Nepal received within 3.2% of its record number of visitors and two of the three listed hotels that publish earnings lost money doing it.
The earlier position of this sector is worth recording because it shows how recently the cohort was profitable.
For the first nine months of FY2024/25, five of the six hospitality companies then listed reported profits, and sector profit rose 1.58% on the year. Soaltee posted operating income of Rs 1.89 billion and Taragaon Rs 1.08 billion. Taragaon's net profit was Rs 337.5 million and Oriental's Rs 44.75 million.
Taragaon, in other words earned Rs 337.5 million in the nine months to Chaitra 2081 and is now reporting an annualised loss. Whatever changed, changed inside eighteen months and did not change because visitors stopped coming.
Oriental held the largest reserve balance in the sector at Rs 2.73 billion ahead of Soaltee at Rs 1.54 billion and Taragaon at Rs 1.03 billion. City Hotel was already the only company with negative reserves.
Those reserve positions matter for what follows. A company with Rs 2.73 billion of accumulated surplus can absorb several poor years. A company with negative reserves cannot absorb one.
Soaltee reports plus Rs 42.10 restated and is the profitable one.
Set that against the arrivals data and the contrast is the subject of this piece. Nepal received within 3.2% of its record number of visitors and two of the three listed hotels that publish earnings lost money doing it.
The word "publish" is doing work in that sentence. Five of the eight publish nothing this note could find, and it is possible they are profitable. A cohort where three-eighths of the members report and two of those three lose money supports a much weaker claim than the headline suggests, and the weaker claim is the one this piece makes.
Soaltee's position in the cohort deserves a separate note because it is genuinely unusual in the Nepali market.
It listed in February 1993 which makes it one of the longest-listed companies on the exchange and older than most of the banking sector. It operates a single large property in central Kathmandu under an international affiliation.
Its paid-up capital is Rs 1.18 billion against reserves of Rs 1.54 billion, so accumulated surplus exceeds subscribed capital. On the restated basis its book value is Rs 259.10 a share against a Rs 100 face meaning the company has retained more than one and a half times what shareholders originally put in.
That is the profile of a mature, self-funding business and it is rare in a listed universe dominated by banks meeting capital requirements and hydropower companies raising construction finance.
What the market pays
The pricing does not follow the earnings either.
Soaltee trades at 19.24 times book value and 118 times earnings on a market capitalisation of Rs 58.57 billion. Promoters hold 69% of it so the tradeable portion is Rs 18.16 billion.
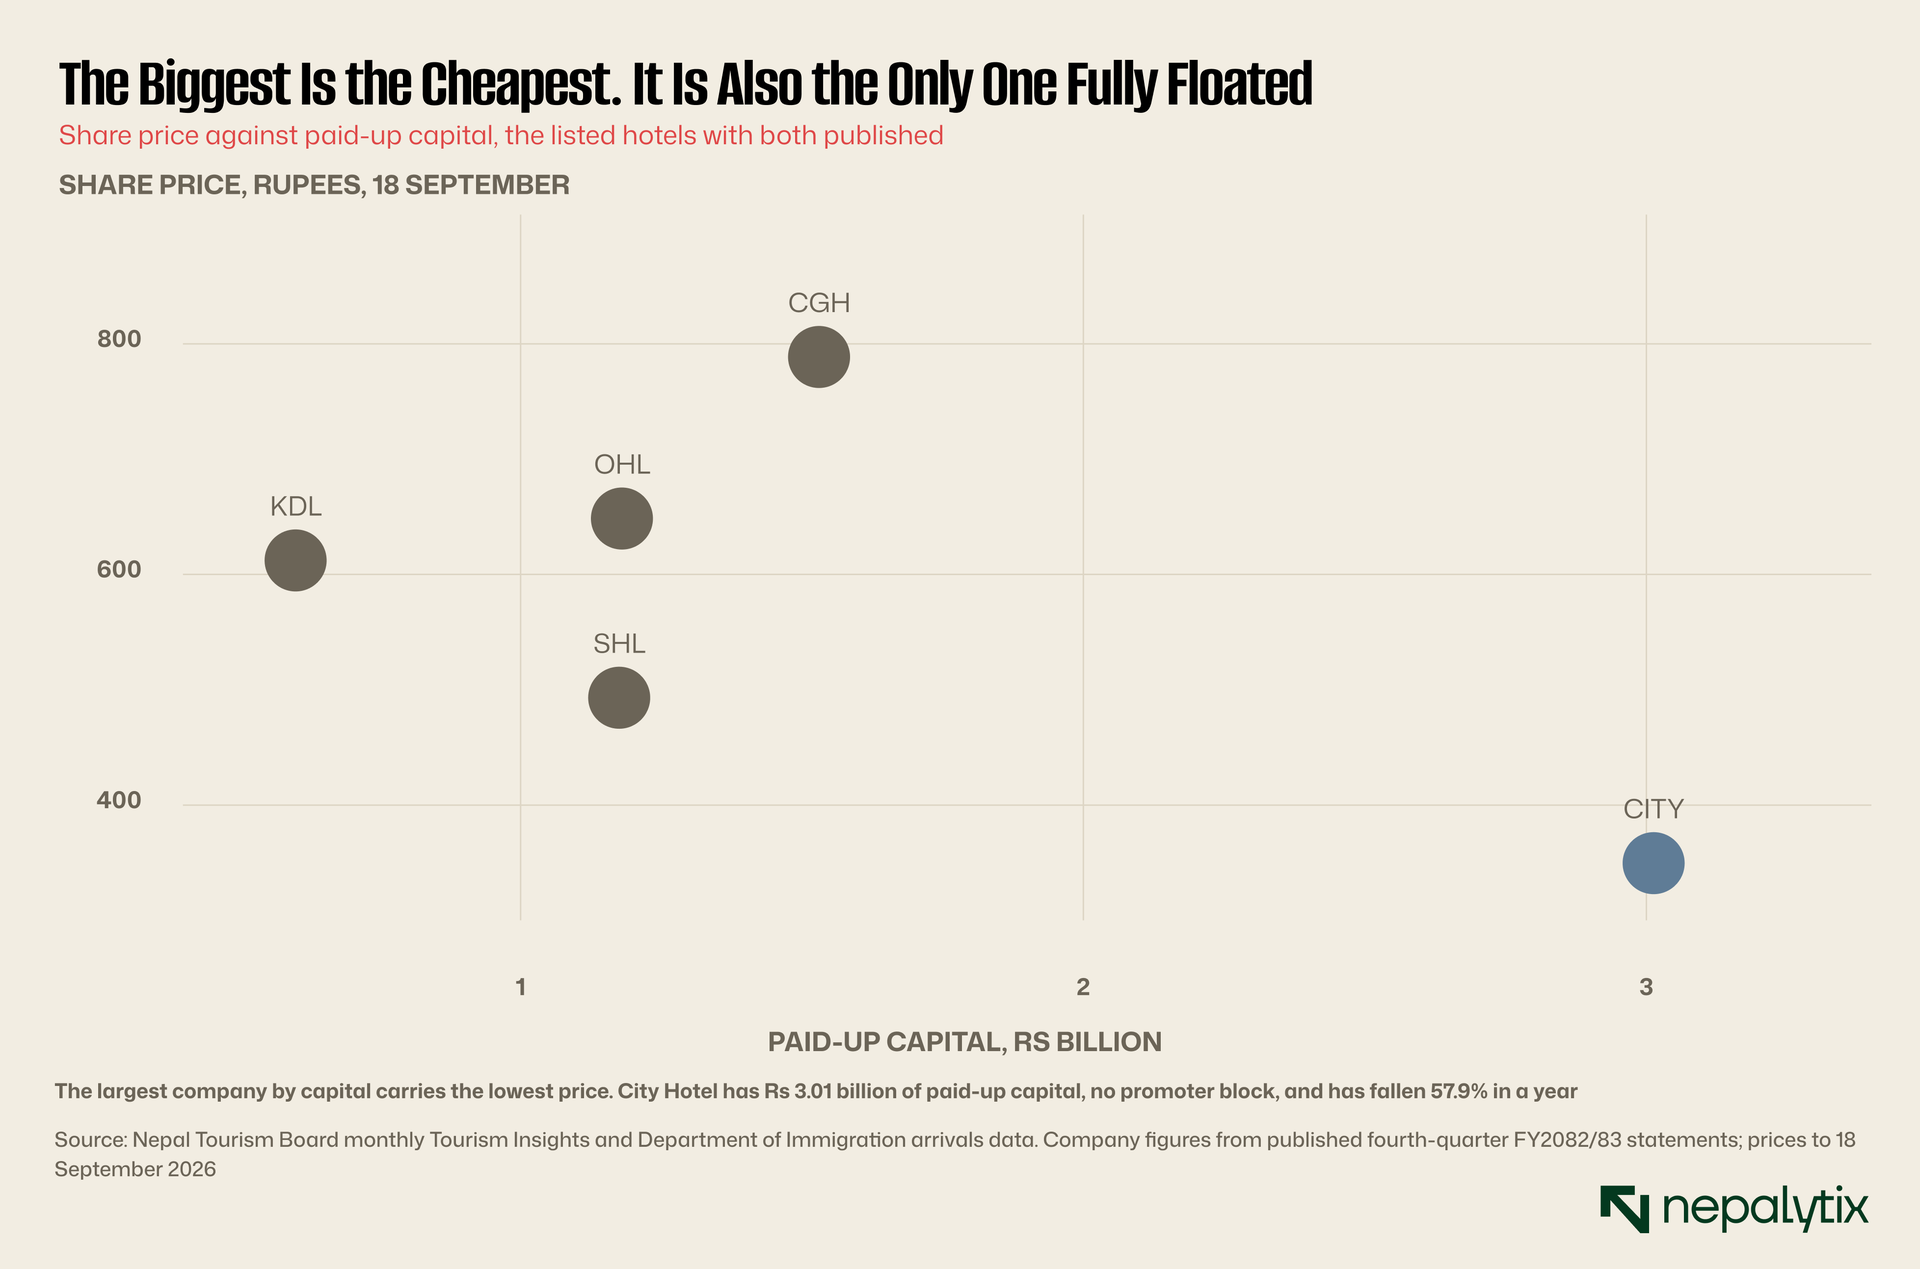
City Hotel trades at 3.74 times book on negative earnings, with a market capitalisation of Rs 10.97 billion and no promoter block at all. Every one of its 30,132,000 shares is public.
So the most expensive company in the sector has the smallest float, and the cheapest has the largest. That is the pattern this publication found in hydropower yesterday and in microfinance last week and it recurs because the mechanism is the same: a price set by a small float is not a valuation.
Soaltee's dividend is the other data point that cuts against the gloom.
Soaltee declared 31.5789% for FY2082/83, of which 15 points are bonus shares and 16.5789 cash. Applying the decomposition this publication set out on 21 September, the bonus carries a 0.79-point tax liability, so roughly 15.79 points of that declaration is money reaching shareholders.
It was the largest non-financial declaration located outside Unilever. A company distributing at that level is not a company in difficulty and it is the same company trading at 19.24 times book.
So the sector contains one clearly profitable, clearly distributing business and two clearly loss-making ones with five companies about which this note can say almost nothing. Generalising from three observations to a sector is the error this piece is trying not to make.
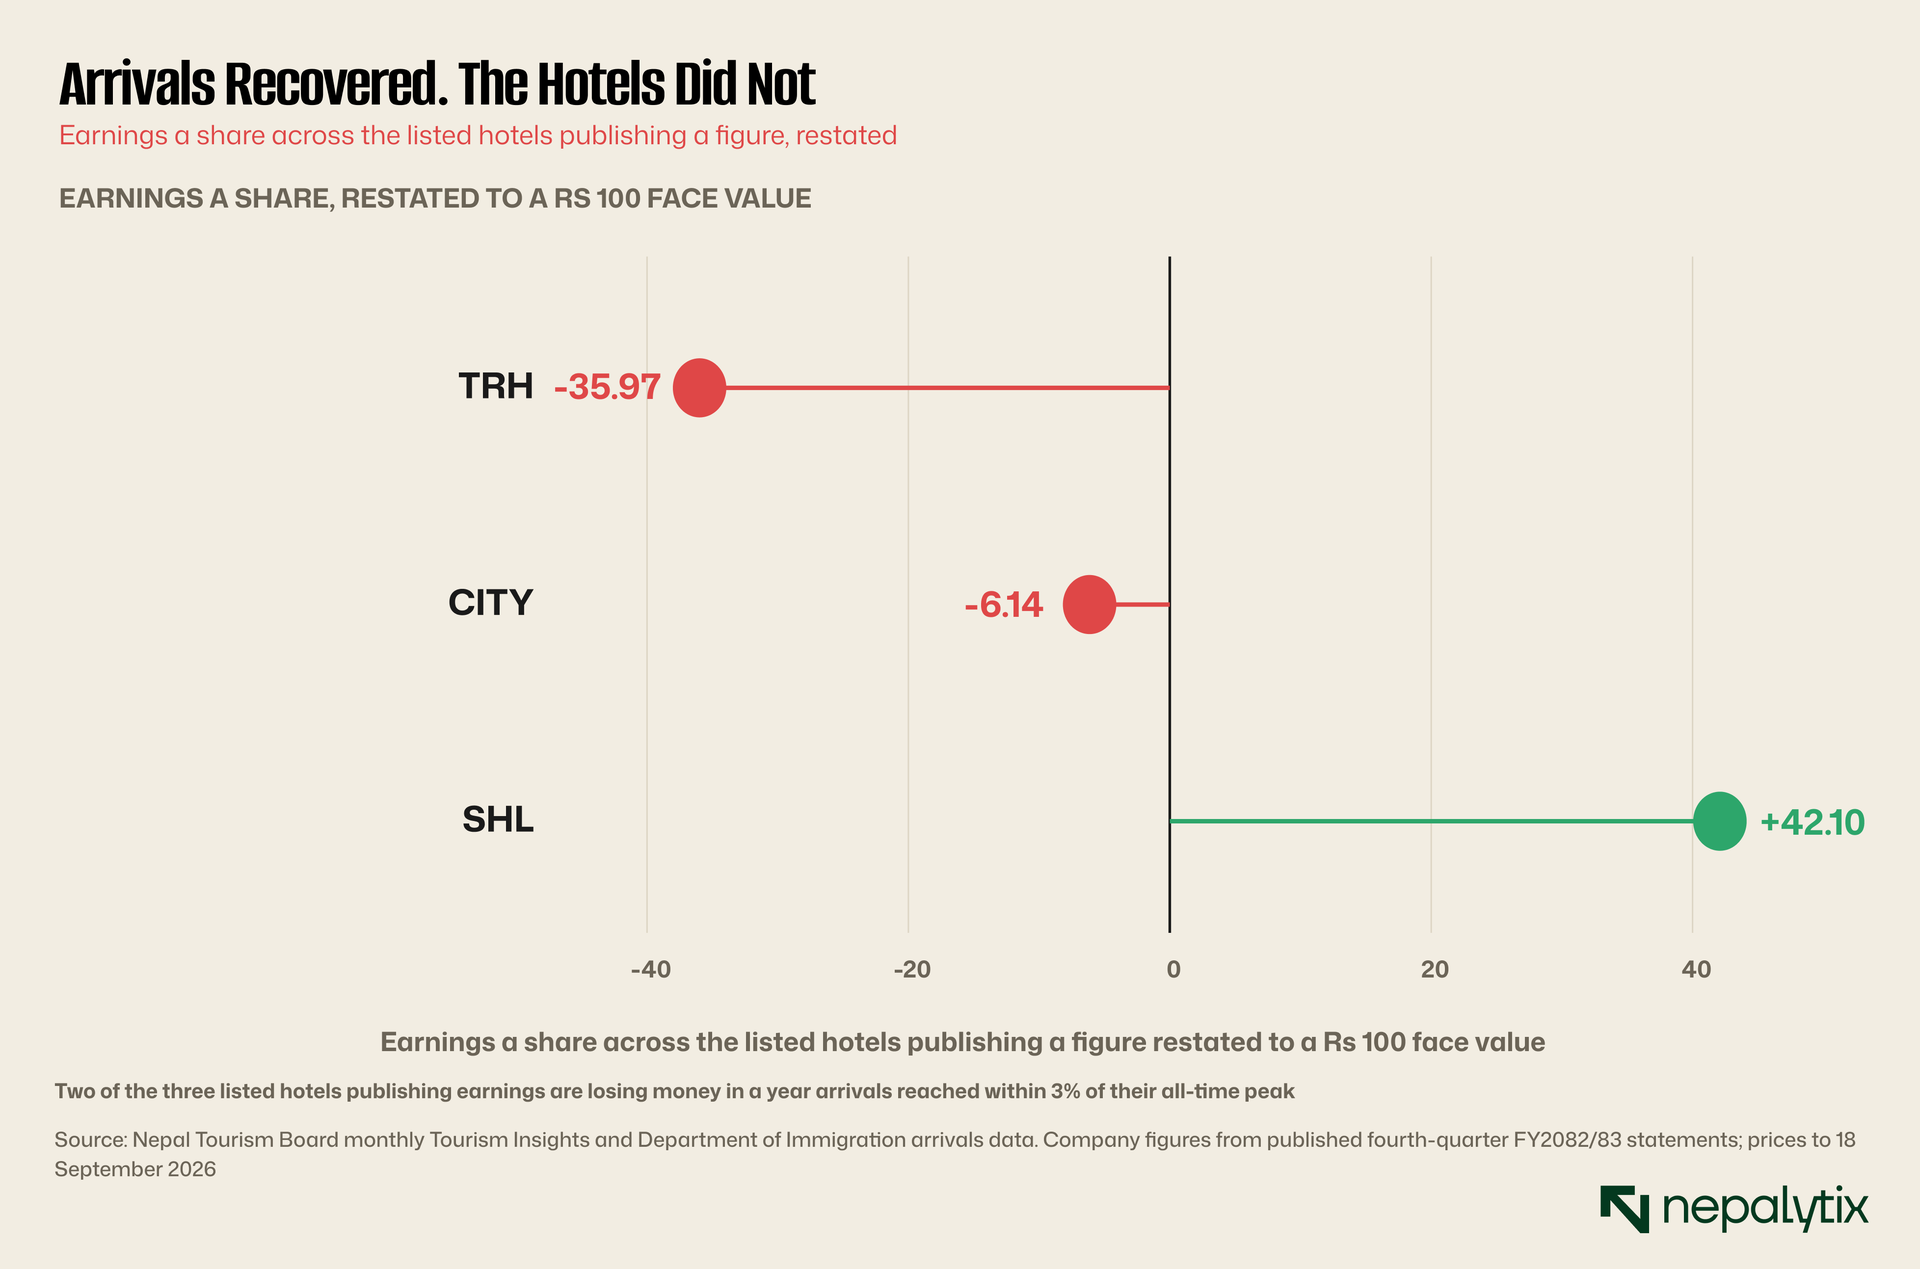
Three of the eight publish an earnings figure that could be located. Of those three, two are losing money.
Taragaon Regency which operates the Hyatt Regency in Kathmandu, reports annualised earnings of minus Rs 35.97 a share against a trailing twelve-month figure of plus Rs 6.73. The gap implies a fourth-quarter loss of roughly Rs 837 million on a paid-up capital of Rs 1.96 billion.
City Hotel's history explains part of its position and is worth stating because the percentage decline invites the wrong inference.
It listed in June 2023, which makes it one of the recent-listing cohort this publication screened on 18 September. That screen found every company listed within 180 sessions trading above its Rs 100 issue price at a median of 564%.
City Hotel trades at Rs 355.10 against a Rs 100 issue price, so it remains well above what subscribers paid even after falling 57.9% from its peak. Both facts are true: an allottee has more than trebled their money and anyone who bought in the last year has lost more than half.
That is the post-listing decay the screen described, arriving in a specific company. The 57.9% fall is not evidence that the business collapsed. It is evidence that the listing premium unwound.
Which does not explain the negative earnings or the negative reserves and those are separate and real.
The eight companies are also not all hotels which complicates the sector label.
Bandipur Cable Car operates a ropeway rather than accommodation. Himalaya Fincorp sits in the hotels and tourism classification for reasons its name does not explain. Chandragiri Hills runs a cable car and a resort together.
So a reader treating the sector sub-index as a proxy for hotel performance is aggregating accommodation, transport infrastructure and at least one company whose business this note could not determine.
That is a classification problem rather than a disclosure one, and it compounds the disclosure problem: a sector of eight where three publish earnings and at least two are not hotels leaves very little to reason from.
Why the recovery did not reach the accounts
Four explanations are available and the published data supports some of them better than others.
Capacity ran ahead of arrivals. Nepal added hotel rooms through the decade before the pandemic and kept adding through the recovery. If rooms grew faster than visitors, the occupancy each hotel achieves falls even as the national total rises. This is the most likely explanation and it cannot be tested here, because room counts by company were not obtained.
The mix moved down-market. Arrivals growth is concentrated in SAARC markets and a visitor arriving overland from India spends differently from one arriving by air from Europe. A listed five-star hotel in Kathmandu is positioned for the second.
Costs rose faster than rates. Nepali inflation ran at 5.14% and the rupee depreciated 10.9% against the dollar over the fiscal year as this publication reported on 24 September. A hotel importing equipment, supplies and food items pays that.
The losses are one-off. Taragaon's trailing figure is positive and its annualised figure is not which means a single quarter carried the loss. A quarter that contains an impairment, a provision or a revaluation is not a trading result.
The fourth is the most important because it is the most testable and it is where the disclosure runs out.
Ranking those four by how well the evidence supports them is the useful exercise and the ranking is not the order they were listed in.
The one-off explanation has the most direct support. Taragaon's trailing twelve-month earnings are positive and its annualised figure is not. Arithmetically that requires a single heavily negative quarter against three positive ones which is the signature of a charge rather than of trading.
The capacity explanation has the strongest theoretical case and no data. If Nepal added rooms faster than visitors, every hotel's occupancy falls while the national arrivals figure rises, and both the arrivals chart and the hotel losses are explained at once. It is the single most plausible account and this note could not obtain a national room-supply series.
The mix explanation is supported by the source-market data and not by anything company-level. SAARC arrivals are growing and spend less; the listed hotels serve the long-haul segment. The direction is right and the magnitude is unknown.
The cost explanation is the weakest. Inflation at 5.14% and a 10.9% currency depreciation are real, but a hotel with pricing power passes those on and Nepal's room rates are set in a competitive market rather than a regulated one. Costs alone do not turn Rs 337.5 million of profit into a loss.
There is a fifth explanation that belongs on the list and is uncomfortable, because it concerns the companies rather than the market.
The properties may be under-invested. A hotel that could not spend on maintenance through 2020 and 2021, and prioritised debt service through the recovery, arrives at 2026 with a property that has aged five years and been maintained for three.
Guests notice. A five-star property competing against newly built hotels in the same city with a tired room stock loses rate before it loses occupancy and losing rate is invisible in every figure these companies publish.
Nepal added international-brand properties through the decade to 2019 and the pipeline did not stop. A recovering market with new supply and ageing incumbent stock is a market where the incumbents lose share at the top end.
This explanation is consistent with everything observed and testable from none of it. It would require room counts, refurbishment capital expenditure and rate data and the companies publish no part of that.
A sixth possibility is worth recording for completeness even though it is the least likely because it is the one that would make the others irrelevant.
The arrivals figure may overstate hotel demand. The Department of Immigration counts entries, and a Tourism Board figure that includes same-day visitors and overland arrivals staying with relatives counts people who never occupy a paid room.
If the SAARC share is growing and a meaningful part of it is same-day or non-commercial accommodation then the room-nights generated by 1,158,459 arrivals in 2025 could be materially below those generated by 1,197,191 in 2019 even though the headline figures are close.
That would reconcile recovered arrivals with unrecovered hotel revenue directly, and it is testable from a bed-night series that Nepal does not publish.
Of the six explanations, three would be settled by company disclosure, two by national tourism statistics that exist elsewhere, and one by the companies own asset accounts. None requires anything to be newly measured.
What could not be established
5 of 8 listed hotels publish no earnings figure this note could locate
This note set out to compare eight companies and could locate current earnings for three.
Oriental Hotel, Chandragiri Hills, Kalinchowk Darshan, Bandipur Cable Car and Himalaya Fincorp publish quarterly statements, and figures for them could not be assembled from sources available here. Room counts, occupancy rates and average daily rates were not obtained for any of the eight.
Those last three are the operating metrics of a hotel business. Without them, a reader cannot tell whether Taragaon's loss came from empty rooms, from rooms sold too cheaply, or from something below the operating line entirely.
A hotel sector that publishes profit and not occupancy is publishing the answer without the working.
The float pattern deserves following through because it is the third time this publication has found it in six weeks.
Soaltee has 36,429,404 public shares against 81,084,804 held by promoters so 31% of the company trades. Its market capitalisation is Rs 58.57 billion and the tradeable portion is Rs 18.16 billion.
City Hotel has no promoter block at all. All 30,132,000 shares are public which is unusual on this exchange and follows from how the company listed.
Set the two against their valuations and the relationship is the one the Exit Register found across the whole market. The company with 31% floating trades at 19.24 times book. The company with 100% floating trades at 3.74 times book and has fallen 57.9%.
Two readings are possible and the data does not separate them. Either the market has correctly identified Soaltee as the better business and City as the worse one which the earnings support. Or a price tested by a small float stays high because nothing forces it down, while a price tested by a large float finds its level.
Both are probably operating. What can be said is that a 57.9% fall in a fully floated stock is information, and a high multiple on a 31% float is considerably less so.
One further consideration belongs here because it is the largest thing this note cannot measure and it sits outside the companies entirely.
Nepal's hotel supply is overwhelmingly unlisted. The eight companies examined here own a small number of properties in a country with thousands of hotels and guesthouses and the great majority of the accommodation serving 1.16 million visitors is in private hands.
So the listed cohort is not a sample of the tourism industry. It is eight mostly large, mostly Kathmandu, mostly upper-tier properties, which is a specific and unrepresentative slice.
Arrivals growth concentrated in budget and mid-market accommodation would show up as a booming tourism sector and a struggling listed cohort and both would be accurate descriptions of different things.
An investor cannot buy Nepali tourism. They can buy eight companies that operate in it, and the relationship between the two is not established anywhere.
A note on the valuation levels themselves, since 19.24 times book invites comparison.
Hotel companies internationally trade on asset value and on multiples of earnings before interest, tax, depreciation and amortisation because a hotel's book value is historic construction cost and bears little relation to what the property is worth. A Kathmandu hotel built decades ago on land now worth many times its carrying value will show a high price to book for reasons that have nothing to do with over-valuation.
Soaltee's property sits on a large site in central Kathmandu. Whether 19.24 times book is expensive depends entirely on what that land is worth and the accounts carry it at cost.
So the multiple is not evidence of anything on its own. What it is evidence of is that book value is the wrong measure for this sector which is the same conclusion Wednesday's piece reached about the draft issuance guidelines from a different direction.
Neither company publishes a revaluation and neither publishes the asset detail that would let a reader estimate one.
Taragaon's scale relative to its loss is worth putting plainly because Rs 837 million is abstract.
Taragaon reported operating income of Rs 1.08 billion across nine months of FY2024/25. The implied fourth-quarter loss of roughly Rs 837 million is therefore close to three quarters of what the company takes in over three quarters of a year.
A loss of that magnitude is not an operating shortfall from soft occupancy. Empty rooms cost a hotel its contribution margin, not its revenue. To lose Rs 837 million in a quarter a company almost certainly recognised something: an impairment, a provision, a write-down or a settlement.
Which is why chapter after chapter of this note returns to the audited accounts. A single disclosure note would convert the largest number in this analysis from a puzzle into a fact.
Kalinchowk Darshan is worth a mention as the smallest of the eight with Rs 600 million of paid-up capital because it illustrates the range.
The sector spans from Rs 600 million to Rs 3.01 billion of paid-up capital and from a company operating a single international-brand hotel in central Kathmandu to a cable car serving a pilgrimage site. Calling these eight a sector and computing a sub-index across them is a convention rather than an analytical judgement.
A reader wanting exposure to Nepali tourism has to choose between them on information that, for five of the eight, this note could not locate at all.
The position
Nepal's tourism recovered from 150,962 arrivals in 2021 to 1,158,459 in 2025 within 3.2% of its all-time record and continues to grow at 7.4%.
The recovery is concentrated in two months of the year and in one source market. It is being served by listed companies of which two of the three publishing earnings are losing money and priced by a market that pays 19.24 times book for the profitable one and 3.74 times book for the one that has fallen 57.9%.
Whether that gap is capacity, mix, costs or a single bad quarter cannot be determined from what these companies publish and the metric that would determine it, occupancy is not published by any of them.
A visitor economy that has come back to where it started ought to be a straightforward thing to invest in. On the available disclosure it is not and the obstacle is not the business. It is that nobody can see inside it.
The counter-case to this whole piece should be put because there is a reasonable one.
Eighteen months ago five of six listed hospitality companies were profitable and sector profit was rising. Soaltee remains profitable and has just declared its largest distribution. Oriental holds Rs 2.73 billion of reserves. Arrivals are growing at 7.4% and the October peak that carries the year has not yet been reported for 2026.
On that reading the sector is fine, Taragaon has had a bad quarter of the kind that shows up in a seasonal business annualised badly, City Hotel is a specific failure rather than a sector signal and this note has constructed a pattern from three data points.
That counter-case is strong and this piece does not defeat it. What it establishes is narrower: that the pattern cannot be checked because the metrics that would confirm or refute it are not published by any company in the sector.
A reader who concludes the sector is fine and a reader who concludes it is troubled are both reasoning from the same three earnings figures and neither can do better.
The exchange's own treatment of the sector is worth a sentence since Sunday's piece covered how the index works.
Hotels and tourism has its own sub-index on NEPSE, computed the same way as every other: market capitalisation weighted across eight companies. With Soaltee at Rs 58.57 billion and the others much smaller, that sub-index is close to being a Soaltee tracker.
An investor watching the hotels sub-index to judge how Nepali tourism is doing is watching one company with a 31% float in a sector where the two companies publishing losses barely register in the weighting.
The sub-index rose while City Hotel fell 57.9%. Both statements are true and only one of them describes the sector.
There is one more structural observation about this cohort that distinguishes it from every other sector examined here.
A bank, a microfinance institution and a hydropower company all sell something whose price is either regulated or contracted. A bank's spread sits inside a rate corridor. A hydropower company sells to a single buyer under a tariff agreement running decades.
A hotel sets its own price every night against whatever competitors are charging. It is the only sector on this exchange with genuine pricing freedom and genuine pricing exposure.
That makes the absence of rate disclosure more consequential here than the absence of comparable metrics elsewhere. For a hydropower company, knowing the tariff tells you most of the revenue story. For a hotel, the rate is the story, and it is the number nobody discloses.
What would make this analysable
Three disclosures would convert this sector from unanalysable to ordinary and hotels publish all three routinely in most markets.
Occupancy. The proportion of available room-nights sold. It is the single number that says whether a hotel's problem is demand or price and no Nepali listed hotel publishes it.
Average daily rate. What a sold room fetched. Occupancy and rate together give revenue per available room which is the industry's standard measure and would make these eight companies directly comparable with each other and with hotels anywhere.
Room count. The denominator for both and the measure of whether the company has been adding capacity into a recovering market or holding it.
None of these is commercially sensitive in any meaningful sense; competitors know each other's room counts and can estimate the rest. They are simply not part of the Nepali quarterly convention which was designed around banks.
That is the recurring finding of this publication's last six weeks, arriving in a new sector. The quarterly statement Nepali companies file carries a profit figure, a revenue figure and a capital figure and those three are sufficient for a bank and insufficient for almost everything else. A hydropower company's plant factor, a telecom operator's subscribers, a microfinance institution's arrears and a hotel's occupancy are all absent for the same reason.
The pattern across this publication's last six weeks is now clear enough to name because this is the fourth sector in which it has appeared.
Hydropower publishes profit and not plant factor. Telecom publishes profit and not subscribers or revenue per user. Microfinance publishes profit and not arrears by institution. Hotels publish profit and not occupancy.
In each case the missing number is the operating metric that determines whether the profit figure means anything and in each case it is collected by the company as a matter of course and required by nobody.
The common cause is that Nepal's quarterly disclosure framework was built around banks, where the financial statements are the operating statements. For a bank, net interest income is both an accounting result and a business metric. For everyone else the two come apart and the framework only asks for one.
Fixing it does not require legislation. It requires the regulator to specify, sector by sector, the three or four operating metrics that must accompany the financial statement. Every listed hotel in every comparable market does this voluntarily because investors demand it. In Nepal investors have not demanded it partly because so few of them can sell.
One comparison closes the disclosure argument.
Every commercial bank on this exchange publishes, quarterly, its non-performing loans, capital adequacy, cost of funds and distributable profit. Monday's research of 28 September used exactly those to decompose a bank's profit increase into a provision release and an operating contribution.
A hotel publishing occupancy, average daily rate and room count would be disclosing less commercially sensitive information than a bank disclosing its bad loans, and it would make the same kind of analysis possible.
The asymmetry is not a judgement about which sector matters. It is an artefact of which sector the disclosure framework was designed around.
What to watch
The October 2026 arrivals figure. October carries the year. October 2025 set the record at 128,443. Whether 2026 exceeds it is the single most informative number the sector will produce, and it publishes within weeks of the month end.
Taragaon's audited FY2082/83 accounts. They will show whether the implied Rs 837 million fourth-quarter loss was operating or exceptional, which is the difference between a bad business and a bad quarter.
City Hotel's reserves. It is the only listed hotel with a negative reserve balance and it is losing money. A company in that position either raises capital, is acquired or continues eroding. Each shows up differently in the filings.
Whether Soaltee's distribution holds. 31.5789% on a recovering business is confident. A company that cuts it is telling you something the earnings line has not yet said.
Any company that starts publishing occupancy. The first Nepali hotel to disclose it will be doing so because the number is good and it will force the others.
Disclaimer
This report has been prepared by Nepalytix for informational and educational purposes only and does not constitute investment advice, an offer, or a solicitation to buy or sell any securities.
The information contained in this report is based on sources believed to be reliable; however, Nepalytix does not guarantee its accuracy, completeness, or timeliness. Opinions, estimates, and projections expressed herein are those of the authors as of the date of publication and are subject to change without notice.
Investing in securities involves risks, including the possible loss of principal. Past performance is not indicative of future results. Readers are advised to conduct their own independent research and consult with a qualified financial advisor before making any investment decisions.
Nepalytix and its contributors may hold positions in the securities discussed in this report at the time of publication or thereafter.
Neither Nepalytix nor any of its affiliates accept any liability for any loss arising from the use of this report or its contents.